

Abstract
Recent microarray profiling studies on breast cancer have identified distinct subtypes that are associated with different clinical outcomes. Promoter hypermethylation of several known or putative tumor suppressor genes occurs frequently during the pathogenesis of breast cancer. We proposed that immunohistopathologic subtypes of breast cancer are likely to contain distinct promoter methylation patterns. A panel of ten gene promoters was assessed by quantitative multiplex methylation-specific PCR in 114 invasive ductal carcinomas from Korea representing the three major subtypes [57 luminal, 24 human epidermal growth factor 2 (HER2), and 33 basal-like] based on immunohistochemical findings of estrogen receptor, progesterone receptor, HER2, cytokeratin 5/6 and epidermal growth factor receptor. The median methylation levels of HIN1, RASSF1A and TWIST, and the average methylation ratio were significantly lower in basal-like subtype compared to luminal or HER2 subtypes. In contrast, BRCA1 methylation level was significantly higher in basal-like subtype than in luminal subtype. The methylation status of a panel of four genes (APC1, CDH, BRCA1 and RAR-β) in luminal and HER2 subtypes were dissimilar, where HER2 tumors showed a significantly higher level of methylation compared to luminal tumors. These results suggest that gene methylation in breast cancer can potentially serve as epigenetic biomarkers and may contribute further to current breast cancer classification.
Keywords: breast cancer, basal-like, luminal, HER2, methylation, quantitation
Introduction
Breast cancer is the most common malignancy in Korean women and represents 16% of all female cancers.1 Breast cancer is a heterogeneous disease, that includes a number of distinct biological entities that are associated with specific pathological features and clinical behavior.2,3 More problematic in informing treatment decisions are breast cancers of apparently homogeneous morphologic characters, since they vary in response to therapy and have distinct outcomes4.
Recent gene-expression profiling of breast cancer has now firmly established that distinct molecular subclasses are present within tumors that are apparently morphologically similar.5,6 Microarray profiling of the transcriptome of breast cancers identified five distinct subtypes of tumors [luminal A, luminal B, normal breast-like, human epidermal growth factor receptor 2 (HER2) overexpressing and basal-like] that are associated with different clinical outcomes. Compared with the luminal subtype, basal-like breast cancers are associated with worse overall and disease-free survival.7,8 However, gene expression microarray analysis cannot be readily applied to clinically available, formalin-fixed, paraffin-embedded tissues, remains relatively expensive and is not established as a robust technology that can be used in routine patient management. Several immunohistochemical surrogates have been proposed for the routine classification of breast cancers. Nielsen et al.9 identified an immunohistochemical surrogate based on four markers [estrogen receptor (ER), HER2, cytokeratin (CK) 5/6 and epidermal growth factor receptor (EGFR)].
Similar to other types of human cancer, breast carcinoma development likely follows a multistep process of activation of oncogenes and inactivation of tumor suppressor genes.10 Inactivation of multiple tumor suppressor genes by aberrant promoter hypermethylation is a fundamental process involved in the development of many malignant tumors, including breast cancer.11,12 Evidence supports the notion that promoter methylation is not randomly distributed in carcinogenesis, and is gene specific and cancer-type specific.13-17 In breast cancer, several genes have been identified as differentially methylated in specific histologic subtypes.18-21 However, the association between promoter methylation and the distinct molecular subtypes of breast cancer has not been well investigated.22-27
The purpose of this study was to test the hypothesis that distinct immunohistopathological subtypes of breast cancer are likely to contain distinct promoter methylation patterns for a candidate gene panel. A panel of ten gene promoters known to be involved in breast carcinogenesis (APC1, BRCA1, BRCA2, CDH1, Cyclin D2, ESR1, HIN-1, RAR-β, RASSF1A and TWIST) was selected and assessed by quantitative multiplex methylation-specific PCR (QM-MSP) in sporadic invasive ductal carcinomas (IDC) from Korea representing the three major subtypes based on immunohistochemical findings of ER, progesterone receptor (PR), HER2, CK5/6 and EGFR. The biological consequence of promoter methylation was demonstrated for one of the genes, RAR-β, by immunohistochemical analysis of primary tissues.
Results
Clinicopathologic characteristics
Table 1 shows clinicopathologic characteristics of the study subjects across the three subtypes of breast cancer. Significant differences in at least one pair of the subtypes were found for age using the Kruskal-Wallis t test (p = 0.021), where a post hoc test indicated that patients with HER2 tumors were significantly younger compared to those with luminal tumors (p = 0.013). Scarff-Bloom-Richardson grade was significantly different across the subtypes (p = 0.0004) with the rates of grade 3 histology seen in the basal-like (26/33, 78.8%) and HER2 (15/24, 62.5%) significantly higher than that observed in the luminal tumors (19/57, 33.3%) (p = 0.0002 and p = 0.024, respectively). Tumor size and stage were similar across the three subtypes.
Table 1. Clinicopathologic characteristic of each subtype.
| Tumor subtype | ||||
|---|---|---|---|---|
| Characteristics | Basal-like (n = 33) |
Luminal (n = 57) |
HER2 (n = 24) |
p value* |
| Age (y) | ||||
|
| ||||
| Mean (±SD) | 52.1 (11.1) | 55.4 (11.6) | 48.0 (12.5) | 0.021 |
|
| ||||
| Median (range) | 51 (30–82) | 58 (26–75) | 46 (30–75) | |
|
| ||||
| Tumor size | ||||
|
| ||||
| Mean (±SD) | 24.6 (11.4) | 21.7 (9.4) | 27.2 (11.7) | 0.091 |
|
| ||||
| Median (range) | 22 (11–60) | 18 (8–53) | 23.5 (14–58) | |
|
| ||||
| Grade [n (%)] | ||||
|
| ||||
| 1 | 2 (6.1) | 13 (22.8) | 1 (4.2) | 0.0004 |
|
| ||||
| 2 | 5 (15.1) | 25 (43.9) | 8 (33.3) | |
|
| ||||
| 3 | 26 (78.8) | 19 (33.3) | 15 (62.5) | |
|
| ||||
| Stage [n (%)] | ||||
|
| ||||
| I | 8 (24.2) | 20 (35.1) | 5 (20.8) | 0.494 |
|
| ||||
| II | 19 (57.6) | 28 (49.1) | 12 (50.0) | |
|
| ||||
| III | 6 (18.2) | 9 (15.8) | 7 (29.1) | |
p value obtained using the nonparametric Kruskal-Wallis test for continuous data and exact chi-square test for categorical data.
Methylation levels
Using the QM-MSP assay, we examined promoter methylation of a panel of ten cancer-related genes involved in breast cancer pathways. In general, samples revealed varying levels of methylation of nine genes, whereas methylation of BRCA2 was not detectable in the samples and thus was excluded from the analyses. Statistically significant differences in median methylation levels for at least one pair of the subtypes of breast cancer were found in six genes, with the exception for Cyclin D2, ESR1 and RAR-β (Table 2, Fig. 2). Overall significant differences in methylation levels were observed for APC (p = 0.023), BRCA1 (p = 0.005), CDH1 (p = 0.0002), HIN1 (p = 0.004), RASSF1A (p < 0.0001), TWIST (p = 0.002) (Table 2). In particular as a special case with the GST approach (Table 3), HIN1, RASSF1A and TWIST methylation levels were significantly lower in basal-like subtype compared to luminal (p = 0.006, p < 0.0001 and p = 0.0006, respectively) or HER2 subtypes (p = 0.003, p = 0.048 and p = 0.009, respectively), whereas their methylation levels were found to be similar between luminal and HER2 subtypes (p > 0.999, p = 0.090 and p = >0.999, respectively). BRCA1 methylation level was significantly higher in basal-like subtype compared to luminal subtype (p = 0.012) and had shown a trend towards higher methylation levels in basal-like than HER2 tumors, although the difference was not statistically significant (p = 0.402). APC showed a significantly higher methylation level in HER2 tumors than in basal tumors (p = 0.003). CDH1 methylation levels were significantly higher in HER2 subtype compared to luminal subtype (p < 0.0001).
Table 2. Methylation levels in subtypes of invasive breast carcinoma.
| Methylation level (mean ± SD, median) | ||||
|---|---|---|---|---|
| Gene | Basal-like (n = 33) | Luminal (n = 57) | HER2 (n = 24) | p value* |
| TWIST | 9.1 ± 20.0, 0.19 | 30.4 ± 35.5, 11.64 | 20.7 ± 27.6, 9.37 | 0.002 |
|
| ||||
| RASSF1A | 15.0 ± 22.3, 1.59 | 38.0 ± 27.7, 40.01 | 23.0 ± 21.4, 13.87 | <0.0001 |
|
| ||||
| HIN-1 | 12.8 ± 28.5, 0.01 | 38.9 ± 43.4, 6.59 | 37.7 ± 37.5, 32.18 | 0.004 |
|
| ||||
| APC1 | 18.9 ± 32.2, 0.30 | 31.9 ± 38.4, 1.25 | 45.9 ± 35.1, 55.87 | 0.023 |
|
| ||||
| CDH1 | 1.7 ± 4.4, 0.01 | 0.5 ± 1.7, 0.00 | 2.4 ± 3.6, 0.52 | 0.0002 |
|
| ||||
| BRCA1 | 21.1 ± 35.5, 0.00 | 0.8 ± 3.9, 0.00 | 0.9 ± 4.4, 0.00 | 0.005 |
|
| ||||
| RAR-β | 10.7 ± 18.1, 4.38 | 12.2 ± 20.9, 1.49 | 14.9 ± 16.1, 10.94 | 0.098 |
|
| ||||
| CYCLIN D2 | 10.5 ± 24.9, 0.00 | 18.2 ± 30.1, 0.48 | 13.7 ± 24.0, 0.26 | 0.223 |
|
| ||||
| ESR1 | 0.2 ± 0.9, 0.00 | 0.7 ± 2.9, 0.00 | 2.2 ± 9.5, 0.00 | 0.641 |
p value obtained using the nonparametric Kruskal-Wallis test.
Figure 2.
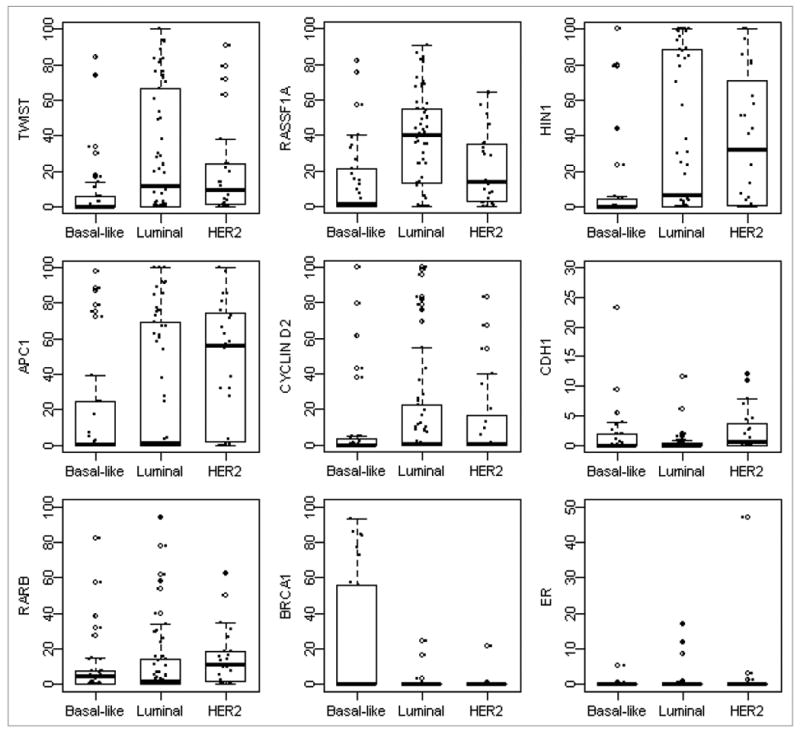
Distributions of gene methylation across subtypes. Box plots showed distribution of individual gene methylation across three subtypes. The box represents the middle 50% of the data. The ends of the box represent the 25th and 75th percentiles, the bars indicate the 10th and 90th percentiles, and a horizontal line inside the box shows the median. The open circles outside the box represent the extreme values and the solid circles represent the raw data.
Table 3. Comparison of methylation levels between subtypes of invasive breast carcinoma.
| Basal-like vs. luminal | Basal-like vs. HER2 | Luminal vs. HER2 | ||||
|---|---|---|---|---|---|---|
| Gene | Global effect1 | p value2 | Global effect1 | p value2 | Global effect1 | p value2 |
| TWIST | 0.412 | 0.0006 | 0.422 | 0.009 | -0.042 | >0.999 |
|
| ||||||
| RASSF1A | 0.522 | <0.0001 | 0.347 | 0.048 | -0.279 | 0.090 |
|
| ||||||
| HIN-1 | 0.355 | 0.006 | 0.467 | 0.003 | 0.020 | >0.999 |
|
| ||||||
| CYCLIN D2 | 0.192 | 0.336 | 0.227 | 0.396 | 0.004 | >0.999 |
|
| ||||||
| APC1 | 0.134 | 0.831 | 0.457 | 0.003 | 0.251 | 0.153 |
|
| ||||||
| CDH1 | -0.234 | 0.168 | 0.350 | 0.048 | 0.548 | <0.0001 |
|
| ||||||
| BRCA1 | -0.284 | 0.012 | -0.184 | 0.402 | 0.142 | 0.480 |
|
| ||||||
| RAR-β | -0.121 | 0.975 | 0.251 | 0.351 | 0.276 | 0.114 |
|
| ||||||
| ESR1 | -0.093 | >0.999 | -0.029 | >0.999 | 0.076 | >0.999 |
|
| ||||||
| 9-gene panel3 | 0.098 | 0.165 | 0.257 | <0.0001 | 0.111 | 0.210 |
|
| ||||||
| 3-gene panel4 | 0.430 | <0.0001 | 0.412 | 0.0002 | -0.100 | 0.861 |
|
| ||||||
| 4-gene panel5 | -0.126 | 0.198 | 0.218 | 0.042 | 0.304 | <0.0001 |
An nonparametric estimate measuring the degree of dissimilarity between the two groups.
p values obtained using nonparametric rank-sum-type global statistical test and adjusted by Bonferroni correction.
9-gene panel includes TWIST, RASSF1A, HIN-1, CYCLIN D2, APC1, CDH1, BRCA1, RAR-β and ESR1.
3-gene panel includes TWIST, RASSF1A, HIN-1.
4-gene panel includes APC1, RAR-β, CDH1, BRCA1.
In this study, none of the genes analyzed showed a correlation of methylation with tumor grade across any of the groups. Only methylation of RAR-β was found to be negatively associated with patients' age (p = 0.036). The multivariate GST analysis indicated that the observed differences in methylation among the three subtypes remained significant after adjusting for age and tumor grade except for TWIST and RASSF1A where the difference between basal-like and HER2 tumors was no longer statistically significant after adjustment for the above confounding factors (data not shown).
The global effect of gene combinations across the subtypes was then explored using the GST approach to differentiate difference between groups and meanwhile account for correlations among multiple outcomes in calculation of the estimate of the global effect, its variance and the test statistic. The global effect using all the nine genes as a whole suggested a significantly higher methylation levels in HER2 subtypes compared to basal-like subtypes (GE = 0.257, p < 0.0001). Consistent trends were observed towards higher methylation in HER2 tumors compared to luminal tumors in APC, CDH, BRCA1 and RAR-β, respectively. As result, a global effect was estimated for the 4-gene panel and a GST was performed to combine information from these four genes into a single test of dissimilarity between the two subtypes. Results indicated a significant global effect towards higher methylation in HER2 tumors (GE = 0.304, p < 0.0001; Table 3), which may imply that all these four genes were globally important in assessing promoter hypermethylation status between these two subtypes. Similarly, the GST showed that the global effect of the 3-gene panel (e.g., HIN1, RASSF1A and TWIST) was strong and associated with a significant degree of dissimilarity between basal-like and luminal subtypes (GE = 0.430, p < 0.0001). The addition of Cyclin D2 and APC1 into the 3-gene panel did not improve the global effect on the comparison between methylation status between basal-like and luminal subtypes (data not shown).
Overall rate of promoter hypermethylation
To further explore the possible use of methylation patterns for breast cancer classification and whether such cutoff-based methylation patterns were consistent with what we observed using the quantitative methylation values, we defined the promoter hypermethylation (positive vs. negative) using the selected cutoff values. The cutoff values were calculated based on the 90 percentile rank of normal values.33 The differences in promoter hypermethylation frequencies among three subtypes of breast cancer were similar to the differences of methylation level among three subtypes (data not shown). For HIN1, RASSF1A and TWIST the methylation frequency observed in basal-like subtype was significantly lower than that of luminal or HER2 subtypes, whereas the difference of methylation frequency between luminal and HER2 subtypes was similar. For BRCA1, the methylation frequency in basal-like subtype was higher than that of luminal or HER2 subtypes, however, statistical significance was only seen between basal-like and luminal subtypes. For APC, CDH1 and RAR-β, the methylation frequency in HER2 subtype was higher than that of luminal subtype.
Promoter hypermethylation of at least one gene of the ten genes was identified in 93.9% (31/33), 96.5% (55/57) and 100% (24/24) in basal-like, luminal and HER2 subtypes, respectively. The average MR, defined as a fraction that represents the number of genes methylated/the number of genes tested, was 0.33, 0.40 and 0.50 in basal-like, luminal and HER2 subtypes, respectively; the difference of MR between basal-like and HER2 subtype was statistically significant (p = 0.002).
We performed a correlative analysis of hypermethylation with clinicopathologic features such as tumor size, lymph node status, tumor grade and stage. Promoter hypermethylation of the genes tested, with the exception of RASSF1A and RAR-β showed no significant association with the known risk factors (data not shown). We found that tumors at an advanced stage (stage III) exhibit a significantly higher frequency of promoter hypermethylation in RASSF1A and RAR-β compared to those at the early stages (stages I and II) (p = 0.002 and p = 0.027, respectively).
Immunohistochemical analysis
To determine whether the RAR-β promoter hypermethylation was correlated with the loss of RAR-β expression, immunohistochemical staining using an anti-RAR-β antibody was carried out on all samples that were subjected to methylation analysis in this study. Representative results of RAR-β immunohistochemistry are shown in Figure 3. Thirty-five (68.6%) of 51 tumors that contained methylated RAR-β by the QM-MSP analysis were negative for RAR-β expression, whereas 10 of 63 (15.9%) tumors containing unmethylated RAR-β showed negative expression of RAR-β, which indicated a strong correlation between RAR-β methylation and loss of expression (p < 0.001, chi-square test).
Figure 3.
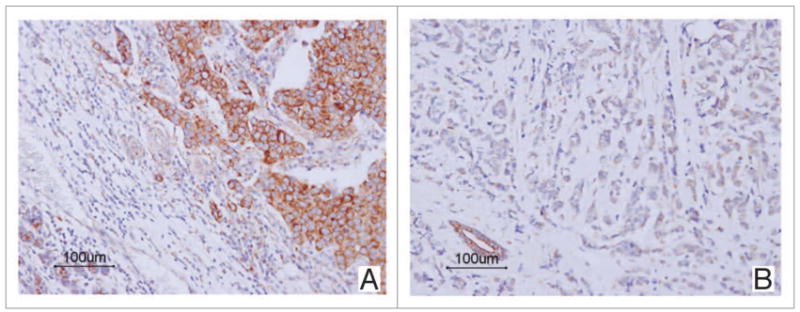
Positive and negative immunohistochemical staining of RAR-β in invasive ductal carcinoma of the breast. Tumor cells show diffuse perinuclear and cytoplasmic staining representing a positive expression of RAR-β (A). Tumor cells show negative staining, but adjacent non-neoplastic breast tissues show strong RAR-β expression (B).
Discussion
Microarray profiling of invasive breast carcinomas has identified several distinct molecular subtypes of tumors.5,6 We propose that molecular subtypes are likely to contain distinct patterns of gene silencing based on promoter hypermethylation. In this study, we have conducted promoter methylation analysis using QM-MSP in IDC representing luminal, HER2, and basal-like subtypes based on immunohistochemical findings. The genes chosen for analysis all have been implicated in some aspects of breast carcinogenesis. For instance, TWIST has been implicated in invasion and metastasis, and recently in stem cell function.34 RAR-β has been known to function as a differentiation protein during normal development and in maturation of mammary epithelial cells.34 We have demonstrated that basal-like breast cancers display methylation patterns for this panel of genes that are different compared to luminal and HER2 subtypes. The methylation pattern with respect to a panel of the four genes was also dissimilar between the luminal and HER2 subtypes.
Aberrant methylation of CpG islands in the promoter region of tumor suppressor genes has become established as an important epigenetic mechanism for gene silencing,11,12 often with notable biological consequences. We have demonstrated a significant correlation between the promoter hypermethylation of RAR-β and the data obtained from immunohistochemical analyses. Promoter hypermethylation of RAR-β resulted in loss of RAR-β protein expression in samples with methylation. These data provide evidence that RAR-β promoter hypermethylation is a major mechanism involved in RAR-β gene silencing, resulting in impaired RAR-β function during breast cancer development.
Microarray profiling and immunohistochemical expression analysis of invasive breast carcinomas has identified distinct subtypes of tumor that are associated with different clinical outcomes.7,8 However, the association between DNA methylation and the molecular phenotypes of breast cancer has been rarely investigated.22-27 Using conventional gel-based MSP analysis, the incidence of BRCA1 methylation was reported to be more common in basal-like subtypes.22-24 Contrary to this finding, Matros et al.25 detected BRCA1 promoter methylation in 16 out of 75 (21%) sporadic breast tumors but found no significant difference between the proportions of methylated tumors in three groups (low grade ER-positive, HER2-positive and basal-like) as defined by hierarchical clustering of gene expression.
In this study, we classified breast cancer into three distinct subtypes (luminal, basal-like and HER2) based on the expression of four immunohistochemical markers. Although similar to previous reports22-24 statistical significance was only seen between basal-like and luminal subtypes, in our study BRCA1 methylation level and frequency was higher in basal-like subtype compared to luminal or HER subtypes. On the other hand, the methylation levels and frequencies of HIN1, RASSF1A and TWIST, and average MR were significantly lower in basal-like subtype compared to luminal or HER2 subtype. Performed on an independent tumor panel from the Netherlands, a recent collaborative study with our group also reported higher methylation levels in sporadic breast cancer compared to BRCA1-associated cancer.35 BRCA1-associated carcinomas frequently show a basal-like phenotype. Suijkerbuijk et al.35 examined 11 genes (APC1, BRCA1, BRCA2, CDH1, CDHK2A, Cyclin D2, ERα, HIN-1, RAR-β, RASSF1A and TWIST) for methylation in 32 BRCA1-associated cancer and 46 sporadic breast carcinomas using QM-MSP. The median for APC1, HIN1, RASSF1A, TWIST and the 11-gene panel was significantly lower in BRCA1-associated than in sporadic breast tumors. In contrast, the mean of BRCA1 methylation in BRCA1-associated tumors was higher than that of sporadic breast tumors, although the difference was not statistically significant. These data suggest that epigenetic mechanisms in general may play a lesser role, compared to others subtypes, in the development of basal-like breast cancer.
Basal-like cancer has a triple-negative phenotype; as a result, the majority of these tumors cannot be managed effectively with existing targeted treatments (trastuzumab and hormonal treatments).36 DNA-repair defects, especially homologous recombination induced by BRCA1 dysfunction, confer sensitivity to DNA-damaging agents.37 The high prevalence of BRCA1 methylation in basal-like subtype identified in our study strongly implicate a fundamental defect in the BRCA1 or associated DNA-repair pathways in sporadic basal-like breast cancer. This could possibly account for the success observed with agents that prevent repair of DNA damage, such as the PARP-inhibitors for the treatment of BRCA-mutant as well as basal-like breast cancer38.
In this study, the methylation status of luminal and HER2 subtypes with respect to a panel of four genes were dissimilar based on a multiple outcomes approach. Thus, it is likely that molecular subtypes of breast cancer are likely to contain distinct profiles of gene silencing based on promoter hypermethylation. Additional studies are needed to determine the mechanisms underlying the differences of methylation profiles in molecular phenotypes of breast cancer.
The genes undergoing methylation during progression of malignancy are potential prognostic markers. We found that advance stage tumors (stages III) exhibit a significantly higher frequency of promoter hypermethylation in RASSF1A and RAR-β compared to early stage (stages I and II) tumors. Whether aberrant promoter methylation in breast cancer patients is associated with prognosis remains to be elucidated by long-term follow-up of our cohort.
In conclusion, we found that basal-like breast cancer display differential methylation profiles compared to luminal and HER2 subtypes. The methylation profiles of luminal and HER2 subtypes are different with respect to four genes. These findings collectively suggest that different histological subtypes of breast cancer may differ with regard to epigenetic inactivation patterns. Detection of methylation levels for some genes is potentially useful as epigenetic markers in breast cancer classification.
Materials and Methods
Case selection
A total of 114 sporadic invasive ductal carcinomas (IDC) from Korea consisting of the three major subtypes (57 luminal, 24 HER2 and 33 basal-like) were selected based on immunohistochemical findings of ER, PR, HER2, CK5/6 and EGFR. We subclassified IDC based on ER, PR and HER2 expression.9 HER2-positive IDCs were classified as HER2 subtype, while HER2-negative and ER and/or PR-positive IDCs were classified as luminal. CK 5/6 and EGFR immunohistochemical analysis was performed on the cases that were negative for ER, PR and HER2 (triple negative). IDC that lacked the expression of ER, PR and HER2 but showed expression of at least one basal-enriched marker (CK 5/6 and/or EGFR) were classified as basal-like (Fig. 1). IDC negative for hormone receptors and HER2 as well as basal markers were not included in this analysis. Specimens for this study were provided by the Chonnam National University Hwasun Hospital National Biobank of Korea, a member of the National Biobank of Korea, which is supported by the Ministry of Health, Welfare and Family Affairs. All samples collected from the National Biobank of Korea were used with informed consent under protocols approved by the institutional review board.
Figure 1.
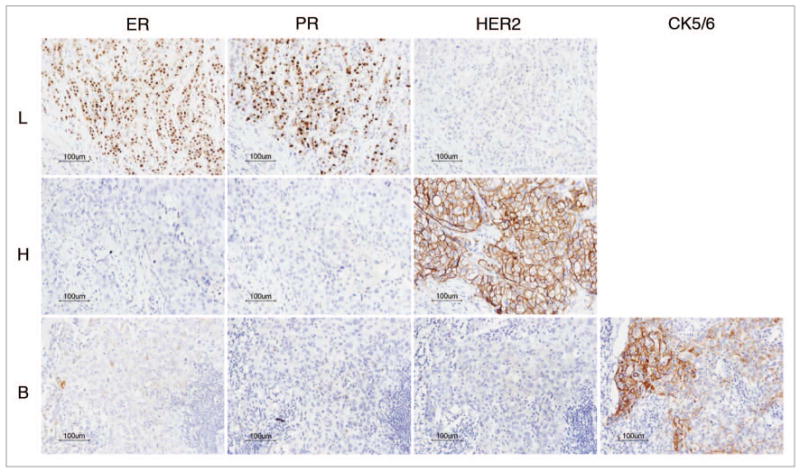
Invasive ductal carcinoma corresponding to luminal (L), heR2 (H) and basal-like (B) subtypes according to immunophenotype of ER, PR, HER-2 and CK5/6.
Immunohistochemistry and interpretation
Four to 6 μm sections were cut from paraffin-embedded blocks, and deparaffinized in xylene. Sections were rehydrated with graded mixes of alcohol and water, and heated in a steamer for 10 min in a 0.01 mol/L concentration of pH 6 citrate buffer for heat-induced epitope retrieval. Sections were cooled at room temperature for 20 min, rinsed thoroughly with water and placed in Tris-buffered saline for 5 min. Endogenous peroxidases were blocked with 3% hydrogen peroxide for 5 min and slides were washed with Tris-buffered saline. Incubation was carried out with commercially available primary monoclonal antibodies for ER (1:35, clone 1D5, Dako), PR (1:50, clone PgR 636, Dako), HER2 (1:250, Dako), CK5/6 (1:50, clone D5/6 B4, Dako), EGFR (1:200, clone H11, Dako) and RAR-β (1:50 clone C-19, Santa Cruz Biotechnology). Samples were visualized by the EnVision method (Dako) according to the manufacturer's instructions. Positive controls were included in all runs for each of the antibodies used. Paraffin sections of normal breast were used as positive controls for CK5/6, IDC of the breast for ER, PR, HER2 and RAR-β, and a squamous cell carcinoma of the skin was used for EGFR. The primary antibody incubation step was omitted in the negative control.
Cases were considered positive for ER or PR when strong nuclear staining was observed in at least 10% of tumor cells tested. HER2 immunostaining was considered positive when strong (3+) membranous staining was observed in at least 30% of tumor cells, whereas cases with 0–2+ were regarded as negative. Any degree of cytoplasmic staining for CK 5/6 and any degree of distinct membranous staining for EGFR were counted as positive for expression.9 RAR-β expression was considered to be negative (loss of expression) when <10% of cells exhibited cytoplasmic or perinuclear staining28.
DNA extraction, sodium bisulfite treatment and QM-MSP analysis
For DNA extraction, one 5-μm tissue section was deparaffinized by treatment with xylene (2X, 10 min each). Using a hematoxylin-eosin stained slide of an adjacent section as a guide, the region of interest was manually scraped off to ensure a cell population of more than 70% cancer cells in each preparation. The scraped tissue was extracted in 27 μl TNES (10 mM Tris, pH 8.0, 150 mM NaCl, 2 mM EDTA, 1% SDS) containing 3 μl proteinase K for 4 h at 52°C. The tissue extract was heat inactivated at 99°C for 7 min and clarified by centrifugation at 13,000 rpm for 30 s. 13.5 μl of the supernatant was used directly as a source of DNA for sodium bisulfite treatment. Sodium bisulfite treatment was scaled down to a micromethod as described.29 QM-MSP is a two step method. The first step consists of amplifying multiple genes from sodium bisulfite treated DNA using primer pairs common to both unmethylated and methylated DNA located outside the CpG island, followed by a real-time nested PCR analysis of each gene's CpG island separately using diluted aliquots of the first reaction as described by Fackler et al.29,30 Detailed methods and primer sequences have been previously described29,30 and are presented in Supplementary Table 1. All assays had a correlation coefficient of the standard curve of 0.99 or higher and a slope of approximately -3.33, indicating 2-fold increases in PCR product per cycle in the linear phase of the quantitative PCR reaction.
Percent methylation for each gene was calculated as follows: % methylation (M) = [number of copies of methylated DNA/(number of copies of methylated + unmethylated DNA)] × 100.
To determine the overall rate of promoter hypermethylation in individual samples, we calculated the methylation ratio (MR). MR was defined as a fraction that represents the number of genes methylated/the number of genes tested.
Statistical analysis
Patient and tumor characteristics (e.g., age, tumor grade, size, tumor stage) were compared across the three different breast cancer subtypes using exact chi-square test for categorical data and nonparametric Kruskal-Wallis test for continuous data. Distributions of methylation levels across different subtypes were depicted for each gene using box plots. To better understand the difference in methylation status with gene combinations between the subtypes, a multiple outcome approach was adopted for pairwise comparisons of panel methylation, in which a rank-based measure (i.e., global effect, GE) was calculated to quantify the degree of dissimilarity between groups.31 The GE is a value between -1 and 1 with GE = 0 implying no global difference, GE = 1 or -1 implying the two groups are entirely different, and larger positive GE values corresponding to higher degree of dissimilarity between groups. A global statistical test (GST) was then used to combine information from multiple outcomes into a single test of group differences.32 Such an approach harbors advantages including taking correlation among panel genes into account, accommodating skewed methylation data distributions and invariant to scales of methylation levels with respect to each gene. Evaluation of difference across subtypes for each individual gene methylation was simply a special case with this approach. Multivariate analyses were explored by adjusting for potential confounding influences of age and tumor grade through the GST approach. The Bonferroni correction was used to adjust for multiple testing resulting from comparisons among subtypes. The use of GST in this application was not intended to show improvement over the individual gene but was conceived as an exploration on the global effect from multiple epigenetic outcomes across the three subtypes. All tests were two-sided and considered statistically significant at p < 0.05. Analyses were performed using SAS (v. 9.1.3, SAS Institute, Cary, NC) and R software packages.
Supplementary Material
Acknowledgments
This work was supported by NIH SPORE P50 CA88843 and DOD-COE W81XWH-04-1-0595 to S.S. and the Korea Research Foundation Grant funded by the Korean Government (MOEHRD, Basic Research Promotion Fund) (KRF-2007-313-E00099) to Ji Shin Lee.
Abbreviations
- ER
estrogen receptor
- CK
cytokeratin
- HER2
human epidermal growth factor receptor-2
- QM-MSP
quantitative multiplex-methylation-specific PCR
- IDC
invasive ductal carcinoma
- PR
progesterone receptor
- MR
methylation ratio
- GE
global effect
- GST
global statistical test
Footnotes
References
- 1.Ko SS Korean Breast Cancer Society. Chronological changing patterns of clinical characteristics of Korean breast cancer patients during 10 years (1996–2006) using nationwide breast cancer registration on-line program: biannual update. J Surg Oncol. 2008;98:318–23. doi: 10.1002/jso.21110. [DOI] [PubMed] [Google Scholar]
- 2.Reis-Filho JS, Lakhani SR. Breast cancer special types: why bother? J Pathol. 2008;216:394–8. doi: 10.1002/path.2419. [DOI] [PubMed] [Google Scholar]
- 3.Simpson PT, Reis-Filho JS, Gale T, Lakhani SR. Molecular evolution of breast cancer. J Pathol. 2005;205:248–54. doi: 10.1002/path.1691. [DOI] [PubMed] [Google Scholar]
- 4.Alizadeh AA, Ross DT, Perou CM, van de Rijn M. Towards a novel classification of human malignancies based on gene expression patterns. J Pathol. 2001;195:41–52. doi: 10.1002/path.889. [DOI] [PubMed] [Google Scholar]
- 5.Sørlie T, Perou CM, Tibshirani R, Aas T, Geisler S, Johnsen H, et al. Gene expression patterns of breast carcinomas distinguish tumor subclasses with clinical implications. Proc Natl Acad Sci USA. 2001;98:10869–74. doi: 10.1073/pnas.191367098. [DOI] [PMC free article] [PubMed] [Google Scholar]
- 6.Sørlie T, Tibshirani R, Parker J, Hastie T, Marron JS, Nobel A, et al. Repeated observation of breast tumor subtypes in independent gene expression data sets. Proc Natl Acad Sci USA. 2003;100:8418–23. doi: 10.1073/pnas.0932692100. [DOI] [PMC free article] [PubMed] [Google Scholar]
- 7.Sotiriou C, Neo SY, McShane LM, Korn EL, Long PM, Jazaeri A, et al. Breast cancer classification and prognosis based on gene expression profiles from a population-based study. Proc Natl Acad Sci USA. 2003;100:10393–8. doi: 10.1073/pnas.1732912100. [DOI] [PMC free article] [PubMed] [Google Scholar]
- 8.van't Veer LJ, Dai H, van de Vijver MJ, He YD, Hart AA, Mao M, et al. Gene expression profiling predicts clinical outcome of breast cancer. Nature. 2002;415:530–6. doi: 10.1038/415530a. [DOI] [PubMed] [Google Scholar]
- 9.Nielsen TO, Hsu FD, Jensen K, Cheang M, Karaca G, Hu Z, et al. Immunohistochemical and clinical characterization of the basal-like subtype of invasive breast carcinoma. Clin Cancer Res. 2004;10:5367–74. doi: 10.1158/1078-0432.CCR-04-0220. [DOI] [PubMed] [Google Scholar]
- 10.Kern SE. Progressive genetic abnormalities in human neoplasia. In: Mendelsohn J, Howley PM, Israel MA, editors. The Molecular Basis of Cancer. 2nd. Philadelphia: WB Saunders; 2001. pp. 41–69. [Google Scholar]
- 11.Baylin SB, Chen WY. Aberrant gene silencing in tumor progression: implications for control of cancer. Cold Spring Harb Symp Quant Biol. 2005;70:427–33. doi: 10.1101/sqb.2005.70.010. [DOI] [PubMed] [Google Scholar]
- 12.Baylin SB. DNA methylation and gene silencing in cancer. Nat Clin Pract Oncol. 2005;1:4–11. doi: 10.1038/ncponc0354. [DOI] [PubMed] [Google Scholar]
- 13.Risinger JI, Maxwell GL, Berchuck A, Barrett JC. Promoter hypermethylation as an epigenetic component in Type I and Type II endometrial cancers. Ann N Y Acad Sci. 2003;983:208–12. doi: 10.1111/j.1749-6632.2003.tb05975.x. [DOI] [PubMed] [Google Scholar]
- 14.Toyooka S, Maruyama R, Toyooka KO, McLerran D, Feng Z, Fukuyama Y, et al. Smoke exposure, histologic type and geography-related differences in the methylation profiles of non-small cell lung cancer. Int J Cancer. 2003;103:153–60. doi: 10.1002/ijc.10787. [DOI] [PubMed] [Google Scholar]
- 15.Gonzalgo ML, Yegnasubramanian S, Yan G, Rogers CG, Nicol TL, Nelson WG, et al. Molecular profiling and classification of sporadic renal cell carcinoma by quantitative methylation analysis. Clin Cancer Res. 2004;10:7276–83. doi: 10.1158/1078-0432.CCR-03-0692. [DOI] [PubMed] [Google Scholar]
- 16.Motoshita J, Oue N, Nakayama H, Kuraoka K, Aung PP, Taniyama K, et al. DNA methylation profiles of differentiated-type gastric carcinomas with distinct mucin phenotypes. Cancer Sci. 2005;96:474–9. doi: 10.1111/j.1349-7006.2005.00074.x. [DOI] [PMC free article] [PubMed] [Google Scholar]
- 17.Costa VL, Henrique R, Ribeiro FR, Pinto M, Oliveira J, Lobo F, et al. Quantitative promoter methylation analysis of multiple cancer-related genes in renal cell tumors. BMC Cancer. 2007;7:133. doi: 10.1186/1471-2407-7-133. [DOI] [PMC free article] [PubMed] [Google Scholar]
- 18.Bae YK, Brown A, Garrett E, Bornman D, Fackler MJ, Sukumar S, et al. Hypermethylation in histologically distinct classes of breast cancer. Clin Cancer Res. 2004;10:5998–6005. doi: 10.1158/1078-0432.CCR-04-0667. [DOI] [PubMed] [Google Scholar]
- 19.Lehmann U, Celikkaya G, Hasemeier B, Länger F, Kreipe H. Promoter hypermethylation of the death-associated protein kinase gene in breast cancer is associated with the invasive lobular subtype. Cancer Res. 2002;62:6634–8. [PubMed] [Google Scholar]
- 20.Fackler MJ, McVeigh M, Evron E, Garrett E, Mehrotra J, Polyak K, et al. DNA methylation of RASSF1A, HIN-1, RAR-beta, Cyclin D2 and Twist in in situ and invasive lobular breast carcinoma. Int J Cancer. 2003;107:970–5. doi: 10.1002/ijc.11508. [DOI] [PubMed] [Google Scholar]
- 21.Tisserand P, Fouquet C, Barrois M, Gallou C, Dendale R, Stoppa-Lyonnet D, et al. Lack of HIN-1 methylation defines specific breast tumor subtypes including medullary carcinoma of the breast and BRCA1-linked tumors. Cancer Biol Ther. 2003;2:559–63. doi: 10.4161/cbt.2.5.511. [DOI] [PubMed] [Google Scholar]
- 22.Magdinier F, Ribieras S, Lenoir GM, Frappart L, Dante R. Downregulation of BRCA1 in human sporadic breast cancer; analysis of DNA methylation patterns of the putative promoter region. Oncogene. 1998;17:3169–76. doi: 10.1038/sj.onc.1202248. [DOI] [PubMed] [Google Scholar]
- 23.Catteau A, Harris WH, Xu CF, Solomon E. Methylation of the BRCA1 promoter region in sporadic breast and ovarian cancer: correlation with disease characteristics. Oncogene. 1999;18:1957–65. doi: 10.1038/sj.onc.1202509. [DOI] [PubMed] [Google Scholar]
- 24.Esteller M, Silva JM, Dominguez G, Bonilla F, Matias-Guiu X, Lerma E, et al. Promoter hypermethylation and BRCA1 inactivation in sporadic breast and ovarian tumors. J Natl Cancer Inst. 2000;92:564–9. doi: 10.1093/jnci/92.7.564. [DOI] [PubMed] [Google Scholar]
- 25.Matros E, Wang ZC, Lodeiro G, Miron A, Iglehart JD, Richardson AL. BRCA1 promoter methylation in sporadic breast tumors: relationship to gene expression profiles. Breast Cancer Res Treat. 2005;91:179–86. doi: 10.1007/s10549-004-7603-8. [DOI] [PubMed] [Google Scholar]
- 26.Turner NC, Reis-Filho JS, Russell AM, Springall RJ, Ryder K, Steele D, et al. BRCA1 dysfunction in sporadic basal-like breast cancer. Oncogene. 2007;26:2126–32. doi: 10.1038/sj.onc.1210014. [DOI] [PubMed] [Google Scholar]
- 27.Bertolo C, Guerrero D, Vicente F, Cordoba A, Esteller M, Ropero S, et al. Differences and molecular immunohistochemical parameters in the subtypes of infiltrating ductal breast cancer. Am J Clin Pathol. 2008;130:414–24. doi: 10.1309/J3QV9763DYPV338D. [DOI] [PubMed] [Google Scholar]
- 28.Chang YS, Chung JH, Shin DH, Chung KY, Kim YS, Chang J, et al. Retinoic acid receptor-beta expression in stage I non-small cell lung cancer and adjacent normal appearing bronchial epithelium. Yonsei Med J. 2004;45:435–42. doi: 10.3349/ymj.2004.45.3.435. [DOI] [PubMed] [Google Scholar]
- 29.Fackler MJ, Malone K, Zhang Z, Schilling E, Garrett-Mayer E, Swift-Scanlan T, et al. Quantitative multiplex methylation-specific PCR analysis doubles detection of tumor cells in breast ductal fluid. Clin Cancer Res. 2006;12:3306–10. doi: 10.1158/1078-0432.CCR-05-2733. [DOI] [PubMed] [Google Scholar]
- 30.Fackler MJ, McVeigh M, Mehrotra J, Blum MA, Lange J, Lapides A, et al. Quantitative multiplex methylation-specific PCR assay for the detection of promoter hyper-methylation in multiple genes in breast cancer. Cancer Res. 2004;64:4442–52. doi: 10.1158/0008-5472.CAN-03-3341. [DOI] [PubMed] [Google Scholar]
- 31.Huang P, Woolson RF, O'Brien PC. A rank-based sample size method for multiple outcomes in clinical trials. Stat Med. 2008;27:3084–104. doi: 10.1002/sim.3182. [DOI] [PMC free article] [PubMed] [Google Scholar]
- 32.Huang P, Tilley B, Woolson R, Lipsitz S. Adjusting O'Brien's test to control type I error for the generalized nonparametric Behrens-Fisher problem. Biometrics. 2005;61:532–9. doi: 10.1111/j.1541-0420.2005.00322.x. [DOI] [PMC free article] [PubMed] [Google Scholar]
- 33.Lee JS, Fackler MJ, Teo WW, Lee JH, Choi C, Park MH, et al. Quantitative promoter hypermethylation profiles of ductal carcinoma in situ in North American and Korean women: potential applications for diagnosis. Cancer Biol Ther. 2008;7:1398–406. doi: 10.4161/cbt.7.9.6425. [DOI] [PubMed] [Google Scholar]
- 34.Widschwendter M, Jones PA. DNA methylation and breast carcinogenesis. Oncogene. 2002;21:5462–82. doi: 10.1038/sj.onc.1205606. [DOI] [PubMed] [Google Scholar]
- 35.Suijkerbuijk KP, Fackler MJ, Sukumar S, van Gils CH, van Laar T, van der Wall E, et al. Methylation is less abundant in BRCA1-associated compared with sporadic breast cancer. Ann Oncol. 2008;19:1870–4. doi: 10.1093/annonc/mdn409. [DOI] [PMC free article] [PubMed] [Google Scholar]
- 36.Rakha EA, Reis-Filho JS, Ellis IO. Basal-like breast cancer: a critical review. J Clin Oncol. 2008;26:2568–81. doi: 10.1200/JCO.2007.13.1748. [DOI] [PubMed] [Google Scholar]
- 37.Turner N, Tutt A, Ashworth A. Targeting the DNA repair defect of BRCA tumours. Curr Opin Pharmacol. 2005;5:388–93. doi: 10.1016/j.coph.2005.03.006. [DOI] [PubMed] [Google Scholar]
- 38.Pal SK, Mortimer J. Triple-negative breast cancer: novel therapies and new directions. Maturitas. 2009;63:269–74. doi: 10.1016/j.maturitas.2009.06.010. [DOI] [PubMed] [Google Scholar]
Associated Data
This section collects any data citations, data availability statements, or supplementary materials included in this article.