Abstract
A capability of high-frequency ultrasound detection to monitor the process of energy deposition into a molecular system via Raman excitation is experimentally demonstrated. It is shown that the generated ultrasound signal is directly proportional to the optical signal generated in stimulated Raman scattering. Ultrasound detection provides a simple way to discriminate against laser-induced breakdown and allows for the quantification of the stimulated Raman scattering process where direct optical detection is not available. Additionally, it can be used for stimulated Raman imaging in deep tissue, provided that the generated photoacoustic signal is sufficiently strong.
Stimulated Raman scattering was first experimentally observed in 1962 [1] and then theoretically explained by quantum mechanics [2] and classical theory of nonlinear susceptibilities [3]. Over the past several years there has been a renewed interest in stimulated Raman processes, both as a possible way to extend the palette of generated wavelengths of light available for applications [4,5] and to gain spectroscopic information about chemical reactions [6,7] and biological systems [8,9]. Unlike parametric processes, stimulated Raman scattering transfers the energy to the molecular system, which allows successful stimulated Raman detection using a sensitive ultrasound transducer, as it was first proposed by Nechaev and Ponomarev [10]. Recently, our group suggested and demonstrated that a powerful combination of stimulated Raman excitation and photoacoustic (PA) detection can be used in condensed phase as well [11–13], and that this methodology has potential for deep-tissue imaging in a chemically specific and noninvasive manner [13]. Most recently, Shashkov et al. applied stimulated Raman excitation with PA detection to cytometry [14].
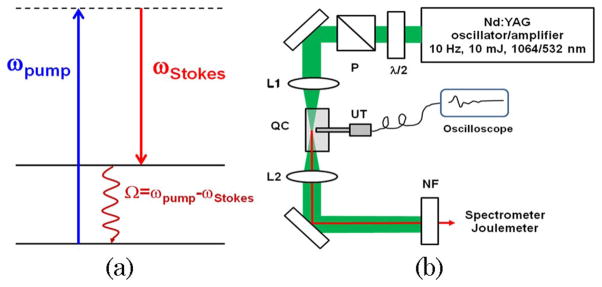
In a typical stimulated Raman scattering experiment, an incident, high-intensity light of frequency ωLaser provides an amplification to the Stokes light at frequency ωStokes, such that Ω = ωLaser − ωStokes, where Ω is the frequency of molecular vibration [see Fig. 1(a)]. As a result, the number of Stokes photons increases. If the rate of amplification exceeds the rate of absorption, an exponential increase of the output Stokes radiation is observed. However, we should point out that the residual energy, i.e., ħ(ωLaser − ωStokes) = ħΩ, gets absorbed by molecular systems in the sample and can result in the generation of heat. If short laser pulses are used, this heating will result in a rapid thermoelastic expansion of the excitation volume, leading to a broadband ultrasonic emission. The later ultrasound waves, generated as a result of optical absorption in material, are often referred to as PA waves, and can be used to characterize the energy deposition process and/or for imaging of absorbing centers [15].
Fig. 1.
(Color online) (a) Schematic energy diagram of the stimulated Raman scattering process. (b) Schematic diagram of the experimental set up: L1, L2, lenses; P, polarizer; λ/2, half-wavelength plate; NF, Raman notch filter for 532 nm; UT, ultrasound transducer; QC, quartz cell with an active medium.
In this Letter, we evaluate the energy relationships in the process of stimulated Raman scattering, using simultaneous optical and ultrasound detection. The purpose of these measurements is twofold. First, we aim to evaluate the efficiency of stimulated Raman PA detection to provide a direct comparison with optical detection schemes, and to quantify the efficiency of energy deposition into a molecular system; second, we are developing a novel tool to monitor stimulated Raman processes by adding a non-optical sensing capability. The ultimate goal is to develop stimulated Raman PA microscopy, as a chemically specific, deep-tissue imaging modality [13]. We believe our use of mineral oil as a simulant for a lipid-based biological material with high efficiency for Raman conversion is novel. We find that the generated PA signal from mineral oil can be substantially strong, and its shape can be a good indicator of optical breakdown that might occur at the higher excitation levels.
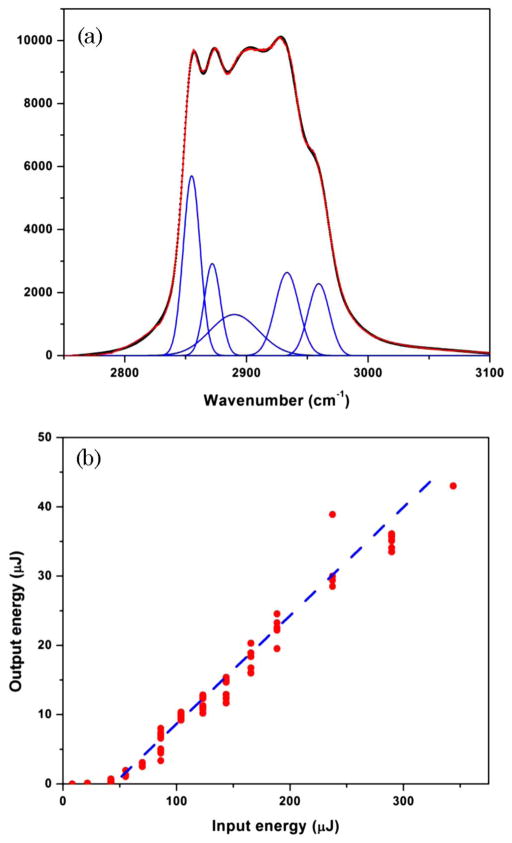
Our experimental setup is illustrated schematically in Fig. 1(b). In brief, a picosecond Nd:YAG laser (GCR-3RA, Spectra Physics, Inc.) generated pulses as strong as several millijoules with a pulse duration of 40 ps at 532 nm (the second harmonic of the fundamental radiation). To avoid a possible absorption in the near-IR spectral region, we used the second harmonic (532 nm) radiation to pump the quartz cuvette (2 cm path length, Helma Cells, Inc.) filled with a mineral oil, which was purchased at a local supermarket. A spontaneous Raman spectrum of this liquid in the high-frequency spectral range is shown in Fig. 2(a); Raman lines in the low-frequency range (<2000 cm−1) are relatively weak and do not appear in any observable stimulated Raman spectra.
Fig. 2.
(Color online) (a) Spontaneous Raman spectrum of a mineral oil: dots, experimentally measured spectrum; red solid line, fit with five Lorentzian peaks, which are shown in blue dashed lines. (b) Experimentally measured energy of the generated Raman signal as a function of the incident energy (red circles). Dashed blue line is shown to provide a guide to the eye and indicates a threshold for the stimulated Raman scattering process at around 50 μJ.
We used a half-wave plate in a sequence with a polarizing beam splitter to adjust the incident energy of the pump beam. The pulse-to-pulse energy stability was measured by an energy meter (EPM1000 with J4-09, Coherent, Inc.) to be about 5% (rms). The laser radiation was focused into the cuvette into a spot of about 50 μm using a 25 cm focal length lens. The output beam was recolli-mated and directed through a Raman notch filter (Kaiser Optical, Inc.), which rejected residual 532 nm radiation, and further into a joulemeter and/or spectrometer (USB2000, Ocean Optics, Inc.). A needle hydrophone (HNC1500 and AH-2010-20-025, Onda, Inc.) was used to detect the ultrasonic waves generated in mineral oil by placing its tip approximately 1 cm away from the line of the incident beam propagation. The position along this line was chosen by maximizing the PA signal amplitude while translating the detector along the beam propagation. The acoustic signal, after being converted to an electrical signal, was displayed on a fast-digitizing oscilloscope (TDS3054B, Tektronix, Inc.), and the peak amplitude of the generated wavefront was used for quantifying the amplitude of the acoustic wave. We realize the existence of a bandwidth mismatch of our detector (20 MHz) and the generated acoustic wave front (25 GHz, which corresponds to the inverse pulse duration of the excitation pulse). Our previous results indicate that, by using a higher-frequency response detector, a much stronger signal can be recorded. Alternatively, a multiple-pulse excitation sequence can be used to enhance the generated PA signal [16].
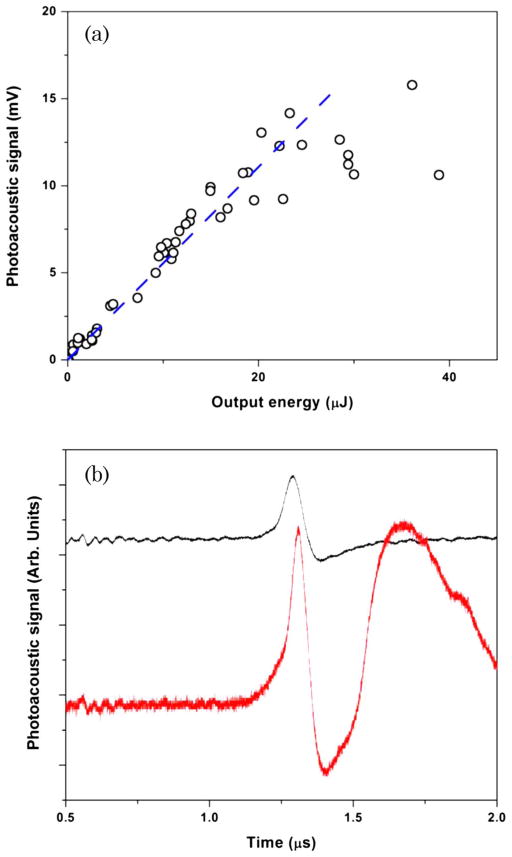
In the first set of experiments, we measured the output energy of the red Raman emission as a function of the incident energy. This graph is shown in Fig. 2(b), and it exhibits a typical dependence of the stimulated Raman signal as a function of the incident energy with a threshold for stimulated Raman scattering of about 50 μJ. We focused on the almost linear region of the curve, for which we observed, when the reflection losses are taken into account, close to 20% energy conversion of the incident light radiation into stimulated Raman radiation. The mode quality of the “red” beam remained round and featureless until the incident energy reached a certain threshold (approximately 0.3 mJ), after which we observed the appearance of the side lobes and an overall degradation of the mode quality. After identifying these initial regimes, we measured simultaneously the energy of the generated Raman radiation and the amplitude of the ultrasonic wave. The later one is known to provide a good measure of the energy deposited into molecular systems in PA experiments [17]. These results are presented in Fig. 3(a), and clearly show a linear dependence between the PA signal and the total energy of the generated Raman light. These results can be explained in terms of the energy conversion process, whereby each photon generated through the stimulated Raman scattering takes only a portion of energy from the incident photon, while the rest of the energy, ħΩ, goes into molecular system generating both nonthermal and thermal effects. Assuming that the portion of energy being converted into heat does not change dramatically with the excitation energy, we should get a linear dependence between the amount of heat absorbed and the amount of Raman light generated.
Fig. 3.
(Color online) (a) Experimentally measured amplitude of the PA signal as a function of the output energy of a stimulated Raman amplifier. 1 mV corresponds to about 3 kPa pressure. Blue dashed line is shown to provide a guide to the eye. (b) Experimentally recorded PA wave fronts for low energy excitation (upper black curve) and for high energy excitation (lower red curve). The threshold incident energy was found to be around 0.3 mJ.
The above measurements were performed for every shot of the laser, allowing recording wave fronts of the acoustic signal for each of the shots and overlaying those shots after a proper normalization. We find that the shape of those acoustic signals does not change from shot to shot for different incident laser intensities within a rather large range of acoustic signal amplitudes. However, when the laser intensity exceeds a certain threshold (about 0.3 mJ), we observed a sudden change in the shape of the acoustic transient [see Fig. 3(b)]. We attribute this effect to the laser-induced breakdown in the medium induced by a very intense laser pulse.
Within the incident light intensities used in our experiments, we did not observe any signs of continuum generation, which is expected considering the relatively long pulse duration of the incident radiation. However, we attempted to measure the spectrum development of the Raman beam as a function of the incident pump intensity. No significant variations of stimulated Raman spectral intensity were observed for the input energies below the threshold for the laser breakdown.
In summary, we demonstrate the applicability of PA detection for analyzing the stimulated Raman scattering process. The PA signal is readily detectable just near the threshold for the stimulated Raman scattering process and scales linearly with the total optical Raman signal generated in the active medium. These results enable the consideration for stimulated Raman PA imaging of biologically related lipids in tissues. Concurrently, we point to an obvious shortcoming of PA detection—its low sensitivity. As seen from Fig. 3(a), the sensitivity of a given ultrasound transducer (10 kPa, as specified by a vendor) is somewhat comparable with that of a joulemeter. Clearly, more sensitive high-frequency ultrasound detectors and more advanced excitation schemes, such as the one described in [16], are needed to achieve the detection limit available through optical instruments. PA imaging should be able to provide complementary information about the spatial distribution of the energy transfer during the stimulated Raman processes.
Acknowledgments
This work was partially supported by the National Institutes of Health (NIH) grants R21EB011703 and R15EY020805 (V. V. Yakovlev), National Science Foundation (NSF) grants ECS-0925950 and DBI 0964225 (V. V. Yakovlev), the Air Force Research Laboratory, Human Effectiveness Directorate, contract FA8650-08-D-6920 (M. L. Denton and G. D. Noojin). V. V. Yakovlev also acknowledges the generous support of the Air Force Consortium Research Fellows Program.
References
- 1.Woodbury EJ, Ng WK. Proc IRE. 1962;50:2367. [Google Scholar]
- 2.Hellwarth RW. Phys Rev. 1963;130:1850. [Google Scholar]
- 3.Shen YR, Bloembergen N. Phys Rev. 1965;137:A1787. [Google Scholar]
- 4.Rong H, Jones R, Liu A, Cohen O, Hak D, Fang A, Paniccia M. Nature. 2005;433:725. doi: 10.1038/nature03346. [DOI] [PubMed] [Google Scholar]
- 5.Cerny P, Jelinkova H, Zverev PG, Basiev TT. Prog Quantum Electron. 2004;28:113. [Google Scholar]
- 6.McCamant DW, Kukura P, Yoon S, Mathies RA. Rev Sci Instrum. 2004;75:4971. doi: 10.1063/1.1807566. [DOI] [PMC free article] [PubMed] [Google Scholar]
- 7.Takeuchi S, Rihman S, Tsuneda T, Chiba M, Taketsugu T, Tahara T. Science. 2008;322:1073. doi: 10.1126/science.1160902. [DOI] [PubMed] [Google Scholar]
- 8.Ploetz E, Laimgruber S, Berner S, Zinth W, Gilch P. Appl Phys B. 2007;87:389. [Google Scholar]
- 9.Freudiger CW, Min W, Saar BG, Lu S, Holton GR, He CW, Tsai JC, Kang JX, Xie XS. Science. 2008;322:1857. doi: 10.1126/science.1165758. [DOI] [PMC free article] [PubMed] [Google Scholar]
- 10.Nechaev SY, Ponomarev YN. Sov J Quantum Electron. 1975;5:752. [Google Scholar]
- 11.Arora R, Petrov GI, Yakovlev VV. Proc SPIE. 2009;7169:71690G. [Google Scholar]
- 12.Yakovlev VV, Petrov GI, Zhang HF, Noojin GD, Denton ML, Thomas RJ, Scully MO. J Mod Opt. 2009;56:1970. doi: 10.1080/09500340903082671. [DOI] [PMC free article] [PubMed] [Google Scholar]
- 13.Yakovlev VV, Zhang HF, Noojin GD, Denton ML, Thomas RJ, Scully MO. Proc Natl Acad Sci USA. 2010;107:20335. doi: 10.1073/pnas.1012432107. [DOI] [PMC free article] [PubMed] [Google Scholar]
- 14.Shashkov EV, Galanzha EL, Zharov VP. Opt Express. 2010;18:6929. doi: 10.1364/OE.18.006929. [DOI] [PMC free article] [PubMed] [Google Scholar]
- 15.Wang LV. Nat Photon. 2009;3:503. doi: 10.1038/nphoton.2009.157. [DOI] [PMC free article] [PubMed] [Google Scholar]
- 16.Liu T, Wang J, Petrov GI, Yakovlev VV, Zhang HF. Med Phys. 2010;37:1518. doi: 10.1118/1.3352666. [DOI] [PMC free article] [PubMed] [Google Scholar]
- 17.Wang LV. IEEE J Sel Top Quantum Electron. 2008;14:171. doi: 10.1109/JSTQE.2007.913419. [DOI] [PMC free article] [PubMed] [Google Scholar]


