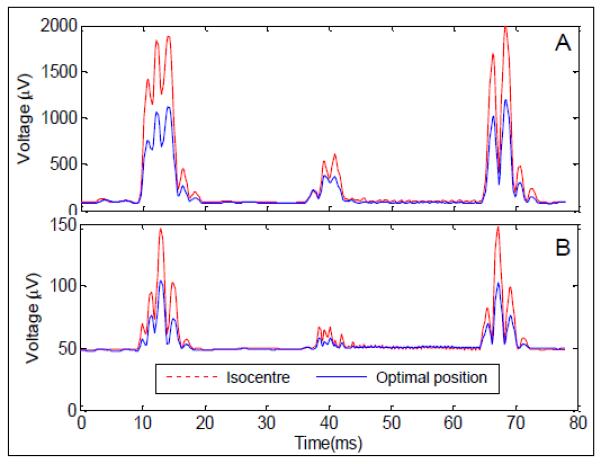
Figure 4.

A: The RMS over channels of the average slice artefact before artefact correction averaged across subjects at the iso-centre (red dashed line) and optimal position (blue line). B: The standard deviation across slices after artefact correction using AAS averaged across subjects at the iso-centre (red dashed line) and optimal position (blue line). Only data acquired during time periods when the subject was stationary were used here.
