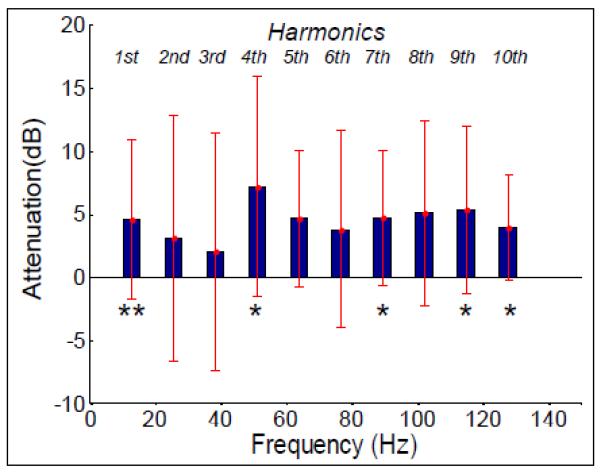
Figure 5.

Attenuation of signal power at optimal position compared to iso-centre after gradient artefact correction for first ten harmonics of the slice frequency, averaged over channels and subjects. Error bars: standard deviation over subjects. Asterisks indicate where a significant reduction was found: ** denotes p< 0.05 and * denotes p<0.1.
