

Abstract
In many sensory systems, receptive fields (RFs) measured by spike responses undergo progressive refinement during development. It has been proposed that elimination of excitatory synaptic inputs underlies such functional refinement. However, despite many extracellular recording and anatomical studies, direct in vivo intracellular evidence has remained limited. In this study, by cell-attached recordings in the developing optic tectum of zebrafish, we found that during a short period after the initial formation of retinotectal synapses, spike visual RFs of tectal neurons underwent a two-stage developmental modulation: from an initial expansion to a later refinement. Whole-cell voltage-clamp recordings revealed that the underlying excitatory synaptic RF exhibited a similar developmental progression, with its spatial extent first increased and then reduced, and its spatial tuning profile gradually sharpened. The inhibitory RF was initially larger than the excitatory RF but became matched with the excitatory RF at later stages. Simulation with the integrate-and-fire neuron model suggested that the developmental changes of excitatory RFs primarily accounted for the initial enlargement and later refinement of spike RFs, whereas inhibitory inputs generally reduced the size of the spike RF without affecting its developmental progression. In addition, spike RF of individual retinal ganglion cells did not significantly change in size during the same period, and the spatial extent and tuning profile of the tectal excitatory RF barely changed after intratectal excitatory connections were silenced. Together, our results demonstrate that the functional refinement of tectal visual RFs results primarily from a selective elimination of feedforward retinotectal inputs.
Introduction
In many sensory systems, functional receptive fields (RFs) (i.e., receptive fields measured by spike responses) of neurons undergo progressive refinement during development, as demonstrated by previous extracellular recording experiments (Sanes and Constantine-Paton, 1985; Fagiolini et al., 1994; Tavazoie and Reid, 2000; Huang and Pallas, 2001; Zhang et al., 2001). Anatomical studies on the morphology of afferent axonal arbors (Antonini and Stryker, 1993; McLaughlin et al., 2003) have led to a generally accepted view that excitatory synaptic connections are initially broad and diffuse but are refined later through a selective elimination of inappropriate connections (Katz and Shatz, 1996; Zhang and Poo, 2001; Ruthazer and Cline, 2004). Consistent with this hypothesis, slice recordings with minimal electrical stimulation technique have suggested a reduction in the number of convergent retinal inputs to individual lateral geniculate neurons over development (Chen and Regehr, 2000; Hooks and Chen, 2006). In vitro studies, however, cannot directly reveal the relationship between RF properties of the neuron and its synaptic inputs. To address this issue, in vivo examinations of patterns of sensory-evoked synaptic inputs in young animals are required. Such studies remain limited mostly because of technical difficulties.
Interestingly, recent in vivo whole-cell recordings in rodent barrel and auditory cortex provide evidence against apparent elimination of excitatory inputs during postnatal development (Bureau et al., 2004; Sun et al., 2010). The results, however, do not exclude the possibility that functional synaptic elimination occurs well before the onset of sensory experience in mammals. The retinotectal system of lower vertebrates such as fish and frogs provides an ideal experimental model for examining sensory-evoked synaptic inputs at earliest possible stages, because there the sensory receptors begin to function at much earlier stages than in mammals (Baier, 2000; Ramdya and Engert, 2008). Surprisingly, in zebrafish, a Ca2+ imaging study suggests that various visual response properties, including spatial RFs, are established soon after the onset of synaptogenesis and that a protracted period of RF refinement is absent (Niell and Smith, 2005). In contrast, in Xenopus tadpoles, synaptic inputs to tectal neurons are shown to undergo a developmental reduction in their spatial extent (Tao and Poo, 2005). Because the retinotectal systems of the two species closely resemble each other, we hypothesize that common mechanisms apply to the visual RF development in these two species. In the present study, we performed cell-attached and whole-cell voltage-clamp recordings in zebrafish tectum at various stages of larval development. We found that the previous conclusion on the absence of RF refinement (Niell and Smith, 2005) was mainly attributable to an incomplete examination of a critical developmental period. Instead, our results indicate that spike RFs of tectal neurons undergo an initial enlargement and a later refinement. By further determining the spatial patterns of excitatory and inhibitory inputs to individual tectal cells, the size of spike RF of individual retinal ganglion cells (RGCs), as well as the relative contribution of intratectal inputs, we conclude that the refinement of the tectal spike RF can be attributed primarily to a selective elimination of feedforward retinotectal connections.
Materials and Methods
Animal preparation and electrophysiology.
All experimental procedures are approved by the Institutional Animal Care and Use Committee of University of Southern California. Zebrafish embryos were collected and raised according to established procedures (Westerfield, 1993). Larvae at stages from 4 to 9 d postfertilization (dpf) were used in this study. At these young stages, the gender could not be determined. It is reasonable to believe that females and males were equally picked. Larvae were first anesthetized with saline containing 0.007% tricaine methanesulfonate (Sigma) and then secured by insect pins to a sylgard-coated dish and incubated in a recording medium equilibrated with 95% O2 and 5% CO2. The recording medium contained the following (in mm): 118 NaCl, 3 KCl, 3 CaCl2, 1.5 MgSO4, 1.25 NaH2PO4, 26 NaHCO3, 10 glucose, and 0.02 d-tubocurarine, pH 7.4. The surgical exposure of the tectum and retina was performed as described previously (Smear et al., 2007). In our preparation, both the periventricular layer of cell bodies and the neuropil surface were exposed to the extracellular solution. The tectal tissue was oriented so that the cell body layers (from which the recordings were made) were on top of the neuropil. For whole-cell voltage-clamp recordings, the intra-pipette solution contained the following (in mm): 138 Cs-gluconate, 5 NaCl, 3 tetraethylammonium-Cl, 1 EGTA, 10 HEPES, 1 QX-314 [N-(2,6-dimethylphenylcarbamoylmethyl)triethylammonium bromide], 3 ATP-Mg, and 0.3 GTP, pH 7.4. For current-clamp recordings, the intra-pipette solution contained the following (in mm): 138 K-gluconate, 5 NaCl, 1 KCl, 1 CaCl2, 10 EGTA, 10 HEPES, 3 ATP-Mg, and 0.3 GTP, pH 7.4. The whole-cell capacitance was fully compensated, and the series resistance was compensated by 60–75% (lag, 100 μs). Signals were filtered at 5 kHz and sampled at 10 kHz using Axoscope software (Molecular Devices). A liquid junction potential of 10 mV was corrected. Excitatory and inhibitory responses were recorded at −70 and 0 mV in voltage-clamp mode, respectively. For cell-attached recording of spike responses, the pipette was loaded with the extracellular solution, and a loose seal (∼100 MΩ) was made on the soma. Spikes were recorded under voltage-clamp mode, and a command potential was applied to obtain a zero baseline current. For consistency among different animals, neurons at similar tectal locations (medial to posterior part of the periventricular zone) were recorded. To record from retinal cells, whole-mount retina was isolated after removing the lens. The retina was flattened and glued to the bottom of the recording dish.
Visual stimulation.
Visual images from a miniature liquid crystal display screen (Sony) were projected to the flattened retina through the optics of the microscope (Engert et al., 2002; Tao and Poo, 2005; Smear et al., 2007). Visual images were generated by custom LabVIEW (National Instruments) codes. For mapping RFs, bright squares within an 8 × 7 grid over a dark background were flashed for 1 s in a pseudorandom sequence, with a 2 s interstimulus interval. Mapping was repeated for three times for synaptic responses or three to six times when spike RFs were examined. Because RGCs exhibited much smaller RFs than tectal neurons, grid of a smaller size (approximately half) was used to map RGC RFs, to obtain RFs with a similar resolution.
Tectal silencing.
To block neuronal spiking in the tectum, a glass pipette (2 μm opening) containing muscimol and SCH50911 [(2S)(+)5,5-dimethyl-2-morpholineacetic acid] (1:1.5 mm), pH 5 (B. H. Liu et al., 2007), was placed on top of the tectal center. The length of the tectum was ∼150 μm, and the thickness of the tectal tissue was 100–140 μm (Xiao et al., 2005 and our own observations). Holding current was −5 nA, and the current for iontophoretic application was 15 nA (Y. Liu et al., 2007). Under this condition, spikes of tectal cells within ∼200 μm distance from the tip of the iontophoresis pipette were effectively blocked. Conversely, retinal circuits were unlikely affected because the distance between the tectum and the contralateral retina was much larger than 300 μm. To test the effect of the muscimol mixture on cells buried in the tectal tissue, a patch electrode penetrated the tectal tissue and was placed at 50–70 μm (i.e., approximately half of the thickness of the tectum) below the periventricular surface to make a loose seal. Visually evoked spikes disappeared and recovered within seconds after the start and cessation of the iontophoresis, respectively. To estimate the effect of the mixture application on the membrane leakage conductance, we measured the input resistance before and after tectal silencing by applying step voltage changes. We found that input resistance reduced by 30 ± 18% (mean ± SD, n = 12) when the muscimol mixture was applied. Because the series resistance (8–12 MΩ) was much smaller than the input resistance (0.9–1.6 GΩ), the input resistance was mainly determined by the membrane leakage conductance. If the percentage reduction of input resistance is r%, the percentage increase of membrane leakage conductance can be calculated as 1/(1 − r%) − 1. We then estimated that there was a 59 ± 47% (mean ± SD) increase of membrane leakage conductance during the mixture application. The excitatory RF was mapped for a single trial before and during the iontophoretic application, and this was repeated for three times.
Data analysis.
Visually evoked responses were analyzed with custom-written LabVIEW and MATLAB (MathWorks) codes. Because most of tectal cells (88%) exhibited stronger On responses than Off responses, we focused on On responses for quantifying RF properties. For synaptic responses, the integrated charge was measured within a 250 ms window after the response onset, which was determined according to the average trace of all the responses in RF mapping. The same time window was applied to responses to all the spots. The RF was determined as the retinal area within which unit stimuli evoked significant synaptic responses, identified by their consistent onset latencies and their averaged amplitudes above 3 SD of the baseline level. For spike responses, the number of evoked spikes was counted within a 250 ms window, the onset of which was determined based on the peristimulus spike-timing histogram for all responses. Evoked spike responses were identified by the average firing rate above 3 SD of the baseline level.
To quantify the spatial correlation between the excitatory (ERF) and inhibitory (IRF) RFs of the same cell, synaptic RFs were smoothed by bilinear interpolation, and Pearson's correlation coefficient (Priebe et al., 2004; Mata and Ringach, 2005) was calculated according to the following:
 |
where x and y are the response amplitudes for the same pixel in the two RFs under comparison. To quantify the sharpness of the synaptic tuning profile, the synaptic RF was fitted with two-dimensional Gaussian ellipse (Liu et al., 2010). Fitting was performed on the raw RF with pixels showing significant responses. The sharpness was calculated as the ratio of the half-maximum amplitude over the geometric mean of the half-widths at half-maximum of the tuning curves along the major and minor axes of the ellipse.
Simulation.
To estimate the spike RF based on the recorded excitatory and inhibitory currents, we first derived the corresponding excitatory and inhibitory synaptic conductances according to the following (Wehr and Zador, 2003; Tan et al., 2004; Wu et al., 2008; Liu et al., 2010):
I(t) was the amplitude of current at time t. Gr and Er were the resting leak conductance and resting membrane potential respectively, and were determined from the baseline recording. Ge and Gi were the excitatory and inhibitory synaptic conductances respectively. V was the membrane voltage, and Ee (0 mV) and Ei (−70 mV in our whole-cell recordings) were reversal potentials for excitatory and inhibitory currents, respectively. V(t) was corrected by V(t) = Vh − Rs * I(t), where Rs was the effective series resistance (8–12 MΩ) and Vh was the applied holding voltage. By holding the recorded cell at two different voltages (0 and −70 mV), Ge and Gi were calculated from the equation. Here, Ge and Gi primarily reflect AMPA and GABAA receptor-mediated conductances, respectively. We then fed the derived Ge and Gi into an integrate-and-fire neuron model (Troyer et al., 1998; Wehr and Zador, 2003; Liu et al., 2010):
 |
where Vm(t) was the membrane potential at time t. C was the whole-cell capacitance (1.5–4 pF) and was determined during the experiment. Ee was set at 0 mV. To determine the reversal potential for inhibitory currents (Ei), we performed gramicidin perforated-patch recordings (Ebihara et al., 1995; Akerman and Cline, 2006) from tectal neurons while puffing GABA to examine GABA-evoked currents. Ei was determined as follows: at 4 dpf, −47.6 ± 6.8 mV; at 5 dpf, −50.4 ± 4.5 mV; at 6 dpf, −52.1 ± 6.4 mV; at 7 dpf, −53.6 ± 4.0 mV; at 8–9 dpf, −54.5 ± 4.6 mV (mean ± SD; n = 7, 8, 8, 8, and 8, respectively). The average Ei was then used for cells at the corresponding stage. Spike threshold was determined from the voltage responses to whole-field light stimulation or the responses to step current injections, with the cell patched with the K+-gluconate-based intracellular solution and held under current clamp. Threshold was identified as where the voltage began to rise sharply and assume the shape of a spike. Based on the results shown in Figure 5, C and D, in the simulation, the resting membrane potential Er was set at −58 mV, and the spike threshold was set at −33 mV (25 mV above the resting level). A spike (2 ms) was generated after the Vm crossed the spike threshold. The Vm was then set to a spike-triggered adaptation voltage (10 mV above the resting) and held there for a refractory period of 4 ms. The number of spikes generated was counted for plotting the estimated spike RF. To estimate the spike RF in the absence of inhibitory inputs, Gi was set at constant zero. For simulations, only cells with both complete excitatory and inhibitory RFs mapped were used. The total numbers of cells recorded were 29, 33, 31, 31, 33 at 4, 5, 6, 7, and 8–9 dpf, respectively, and the numbers of cells that did not sustain long enough for the complete mapping of both excitatory and inhibitory RFs were 11, 12, 14, 15, and 17.
Figure 5.

Developmental changes of synaptic RFs can account for the changes of spike RFs. A, Left, Excitatory and inhibitory RFs (top) of an example neuron as well as the simulated spike RFs by using the integrate-and-fire model. With E only, Only excitatory inputs were considered by setting the inhibitory conductance as constant zero. Color scale: 5.6 (E) and 6.1 (I) pC; nine spikes. B, Average size of simulated spike RFs for different stages. Only cells with both excitatory and inhibitory RFs determined were used for this analysis. n = 18, 21, 17, 16, and 16. Error bars indicate SE. C, Resting membrane potential at different stages. n = 8, 8, and 8 cells. Filled symbol indicates mean ± SD. There is no significant difference between groups (p > 0.05, ANOVA). D, Spike threshold. n = 8, 8, and 8. There is no significant difference between groups. Inset, An example voltage trace in response to a step current injection (+20 pA). Dotted line indicates the baseline (−60 mV), and arrows points to the level of spike threshold. Calibration: 15 mV, 100 ms. E, Average number of spikes generated in response to a step current injection (+20 pA, 200 ms, with the resting potential held at −60 mV). n = 8, 8, and 8. There is no significant difference between groups.
To estimate the effect of muscimol on the amplitude of recorded excitatory currents, we used a NEURON model (www.neuron.yale.edu/neuron/). The model neuron consists of a cylinder of 10 μm length and 8 μm diameter as the soma and a cable of 300 μm length and 1 μm diameter as the dendrite. Other physical parameters used in the simulation included the following (Spruston et al., 1993): the specific intracellular resistivity, Ra = 200 Ω·cm; the specific membrane capacitance, Cm = 1 μF/cm2; the specific leakage conductance, gm = 2e-5 S/cm2 under normal condition and 4e-5 S/cm2 with muscimol application (we assume a 100% increase in membrane leakage conductance); the resting potential Er, −60 mV. An α synapse, whose conductance was expressed as g = gmax * (t/τ) * e(1 − t/τ), was placed at different dendritic locations to simulate the synaptic input. τ was set at 20 ms, gmax at 0.8 nS, and Ee at 0 mV. The current was examined at the soma, which was clamped at −70 mV.
Results
Developmental changes of spike RFs of tectal neurons
To map RFs of tectal neurons, visual images were projected to the flattened contralateral retina of the larval fish after removal of the lens (Fig. 1A), as described previously (Tao and Poo, 2005; Smear et al., 2007). Bright squares were flashed individually at various retinal locations in a pseudorandom sequence. We first examined the evoked spike responses of individual tectal neurons with cell-attached recordings (Fig. 1B). RGC axons begin to arborize in the tectum at ∼2.5 dpf (Schmidt et al., 2000). From ∼3.5 dpf, we started to detect visually evoked spike responses in tectal neurons, consistent with the previous report (Niell and Smith, 2005). The spike RF was defined as the retinal area in which visual stimuli elicited significantly higher levels of spiking activity than the baseline (see Materials and Methods). As shown by the example cells in Figure 1C, the RF area appeared to be larger at 6 dpf than at 4 and 8 dpf. As summarized from a total of 82 recordings, the size of tectal cell spike RFs increased from 4 to 6 dpf and then reduced from 6 to 8–9 dpf (Fig. 1D). The RF size at 8–9 dpf was not significantly different from that at 4 dpf, which is consistent with the result of the previous study (Niell and Smith, 2005), whereas the level of evoked spiking activity at 8–9 dpf was significantly higher (Fig. 1E). These data demonstrate that functional RFs of zebrafish tectal neurons undergo a two-stage developmental modulation, with an initial expansion and a later refinement. The previous conclusion on the absence of a developmental refinement of tectal RFs is in fact attributable to an incomplete examination of developmental stages: comparison was made between only two stages, 3.5 and 9 dpf (Niell and Smith, 2005).
Figure 1.

Developmental changes in spike RFs of zebrafish tectal neurons. A, Experimental setup. Visual images were presented by a small liquid crystal display screen (V) through the camera port of the microscope onto the retina stabilized with a piece of coverslip (S). The recording pipette (R) patched onto a cell in the contralateral tectum. B, Top, Total image projection area (black) relative to the retina (blue). D, Dorsal; V, ventral; N, nasal; T, temporal. Scale bar, 34 μm. Intensity map displays the spike RF of a tectal neuron, with brightness indicating the average number of spikes evoked by a corresponding unit stimulus (baseline subtracted). Bottom, Raw traces of evoked spikes in three trials for the stimuli at positions labeled by * and +. Stimulus onset is marked on top. Calibration: 10 pA, 100 ms. C, Spike RFs of three example cells at stages indicated. Top, Raw traces of responses, arranged according to the location of the corresponding stimuli. Only On responses are shown. Calibration: 40 pA, 100 ms. Bottom, RF maps. D, Average size of spike RFs at different stages. From left to right, n = 19, 15, 18, 15, and 15 cells. Error bars indicate SE. Six d postfertilization is significantly higher (p < 0.05, one-way ANOVA with post hoc test). E, Average number of evoked spikes per unit stimulus. Data were from the same cells as in D. Eight to 9 dpf is significantly higher than 4–5 dpf, and 7 dpf is higher than 4 dpf (p < 0.05, ANOVA).
Developmental changes of excitatory and inhibitory synaptic RFs of tectal neurons
To address the question of whether synaptic elimination underlies the functional RF refinement, we examined the spatial patterns of visually evoked synaptic inputs to individual tectal neurons with whole-cell voltage-clamp recordings. Each recorded tectal cell was clamped at −70 and 0 mV to reveal AMPA receptor-mediated excitatory and GABA receptor-mediated inhibitory currents, respectively (Fig. 2A). Synaptic responses were usually observed to both the onset (On response) and offset (Off response) of the visual stimulus. In this study, we focused on On responses because they were stronger than Off responses in most of the neurons (see Material and Methods). The outward inhibitory currents recorded at 0 mV could be completely eliminated by the bath application of bicuculline (Fig. 2A, bottom) or picrotoxin (data not shown), indicating that these currents were mediated by GABAA receptors. By comparing the temporal profiles of average excitatory and inhibitory responses evoked by the same spot stimulus, we found that there was a temporal mismatch between the excitatory and inhibitory responses (Fig. 2B). The inhibitory response was delayed by 9.8 ± 1.7 ms (mean ± SD; n = 12) relative to the excitatory response, when compared at half-maximum level. This result is consistent with previous observations in the Xenopus retinotectal system, supporting the notion that tectal neurons receive disynaptic GABAergic inputs from local interneurons that are directly driven by RGC input (Tao and Poo, 2005; Akerman and Cline, 2006).
Figure 2.

Synaptic RFs of tectal neurons. A, Top, Raw traces of unit stimulus-evoked excitatory and inhibitory currents in a tectal neuron, recorded at −70 and 0 mV, respectively. Lines on top delineate the time course of stimulus presentation (spot). Dotted vertical lines delineate the time window for measuring the integrated charge of the On response. The outward currents recorded at 0 mV were blocked by the bath application of bicuculline methiodide (BMI, 10 μm). Calibration: 10 pA, 150 ms. B, Excitatory (Exc, red) and inhibitory (Inh, blue) responses (averaged from 6 trials) of a tectal cell to the same unit stimulus. The polarity of the excitatory response has been reversed for comparison. Calibration: 8 (red)/7.5 pA (blue), 200 ms. C, Reconstruction of excitatory and inhibitory RFs for an example cell. The intensity of each pixel represents the integrated charge of the On response to the stimulus at the corresponding location. The average map of three individual trials (1, 2, 3) was smoothed by bilinear interpolation. Gray and color scale: 2.8 (E)/3.2 (I) pC for maximum. The raw traces of responses to stimuli at locations labeled by * and + are shown for each trial. Calibration: 5 (E)/8 (I) pA, 100 ms. D, Top, Arrays of average evoked excitatory (E) and inhibitory (I) On responses for three example neurons at 4, 6, and 8 dpf, respectively. Calibration: 25 pA, 100 ms. Color maps depict synaptic RFs. Color scale (from top to bottom, then from left to right): 2.4, 2.5; 4.7, 3.5; 5.4, and 3.9 pC for maximum. Bottom, The normalized peak amplitude of the inhibitory response (to the maximum value within the RF) versus that of the excitatory response to the same stimulus. Only pixels with significant responses (either E or I) are included. Red line displays the best-fit linear regression line.
For RF analysis, we measured the integrated charge of synaptic currents within a defined time window (see Materials and Methods) (Fig. 2A). The synaptic RF was displayed as an intensity or color map, with the intensity or color representing the magnitude of synaptic charge (Fig. 2C). In our experiments, reconstructed synaptic RFs were essentially consistent among different trials (Fig. 2C), indicating the reliability of our experimental method. To demonstrate the developmental changes in synaptic RFs, arrays of average excitatory as well as inhibitory responses to all the unit stimuli are shown for three example cells at 4, 6, and 8 dpf, respectively (Fig. 2D). Surprisingly, the cell at 4 dpf exhibited a much smaller ERF than its IRF. This led to a marked mismatch of spatial profile between the ERF and IRF, as indicated by the extremely weak correlation between the strength of excitatory and inhibitory inputs (Fig. 2D, bottom left). The cell at 6 dpf displayed a larger ERF than the cell at 4 dpf and a similarly large IRF (Fig. 2D, middle). For the cell at 8 dpf, both the ERF and IRF were relatively small, and they were observed at similar retinal locations. As a result, the excitatory and inhibitory responses were strongly correlated in strength (Fig. 2D, right).
More synaptic RFs are shown in Figure 3. At 4 dpf, we found for many cells that the extent of the IRF was larger than the ERF, resulting in a significant mismatch of spatial profile between them (Fig. 3A, top). At 6 dpf, most of the cells exhibited both a large ERF and a large IRF, which usually covered >50% of the total retinal area (Fig. 3A, middle). The RF location and shape roughly matched between the ERF and IRF. Nonetheless, a clear difference in their spatial profiles could be observed in some cells. At 8–9 dpf, the size of both the ERF and IRF markedly reduced. The ERF and IRF covered a similar retinal area, and their RF peaks (where the strongest response was elicited) were essentially colocalized (Fig. 3A, bottom).
Figure 3.

Developmental changes in excitatory and inhibitory RFs of tectal neurons. A, Excitatory (E) and inhibitory (I) RF maps of the same neuron. Five example neurons are shown for each stage. Color scale (from E to I, then from left to right): 4 d, 2.3, 3.3, 3.1, 4.1, 2.7, 1.9, 3.2, 2.8, 3.6, and 3.9 pC; 6 d, 2.9, 2.3, 4.2, 3.2, 3.8, 4.3, 4.8, 3.4, 3.5, and 4.6 pC; 8–9 d, 4.5, 3.4, 6.2, 3.5, 4.9, 2.8, 5.2, 4.7, 4.2, and 3.4 pC for maximum. B, Average size of excitatory and inhibitory RFs of tectal neurons at different stages. From left to right, n = 28, 19, 31, 23, 29, 19, 29, 18, 30, and 19. Error bars indicate SE. For ERFs, 6 dpf is significantly higher than the other stages, and 5 dpf is significantly higher than 7 and 8–9 dpf; for IRFs, 7 dpf is significantly lower than 4–6 dpf, and 8–9 dpf is significantly lower than 7 dpf (p < 0.05, ANOVA). C, Average correlation coefficient calculated between the ERF and IRF of the same cell at different stages. n = 18, 21, 17, 16, and 16. Four d postfertilization is significantly lower than 6–9 dpf, and 5dpf is significantly lower than 7–9 dpf (p < 0.05, ANOVA).
RF size was quantified as the total retinal area in which visual stimuli elicited significant synaptic responses in tectal cells (see Materials and Methods). Consistent with the changes of the spike RF, there was a significant increase in the size of the ERF from 4 to 6 dpf, which then reduced sharply during the next 2–3 d (Fig. 3B, light gray). The IRF was initially larger than the ERF (Fig. 3B, black). It underwent a slight enlargement from 4 to 6 dpf and then became much smaller over the next 2–3 d, similar to the ERF. The developmental shrinkage of both the excitatory and inhibitory RFs suggests a refinement of synaptic connections, although where it occurs within the visual pathway needs to be further identified (see below). The excitatory RF was on average larger than the spike RF at the same developmental stage, consistent with the previous notion that spike RFs are flanked by subthreshold response regions (Priebe and Ferster, 2008; Liu et al., 2010). To quantify the spatial match between the ERF and IRF, we used Pearson's correlation coefficient (r) as an index (see Materials and Methods). There was a monotonic increase in r (Fig. 3C), indicating that the ERF and IRF became increasingly similar over development.
Besides the spatial range of synaptic inputs, we also quantified the sharpness of their tuning profile by fitting the synaptic RF with two-dimensional elliptical Gaussian function (Fig. 4A). The sharpness was expressed as the ratio of the half-maximum amplitude of the tuning curve over the half-bandwidth at half-maximum (see Materials and Methods). The spatial tuning profiles of both excitatory and inhibitory inputs were significantly sharpened over development (Fig. 4B). In the meantime, the peak amplitude of synaptic tuning curves increased during development (Fig. 4C). These data suggest that two forms of synaptic changes contribute to the functional development of tectal RFs: selective elimination of synaptic connections in the periphery of the RF and strengthening of connections in the emerging center of the maturing RF.
Figure 4.

Spatial tuning profile of synaptic inputs to tectal neurons. A, Top, The original excitatory RF map (O) and the map fitted with two-dimensional Gaussian ellipse (F) for two cells at 6 and 8 dpf, respectively. Dotted line indicates the major axis of the ellipse. Color scale: 3.9 (6 d) and 5.2 (8 d) pC for maximum. Bottom, The spatial tuning curve along the major axis. h and w depict the half-maximum amplitude and the half-width at half-maximum, respectively. B, Relative sharpness of synaptic tuning profiles (normalized to the average value for excitatory or inhibitory RFs at 4 dpf, respectively). Only cells with both excitatory (Exc) and inhibitory (Inh) RFs determined were included. n = 18, 21, 17, 16, and 16 cells. Error bars indicate SE. For excitatory inputs, 8–9 dpf is significantly higher than 4–6 dpf; for inhibitory inputs, 7–9 dpf is significantly higher than 4–5 dpf (p < 0.05, ANOVA). C, Relative peak amplitude of the synaptic RFs (normalized to the average value at 4 dpf). Cells are the same as in B. For excitatory inputs, 7–9 dpf is significantly higher than 4 dpf; for inhibitory inputs, 6–9 dpf is significantly higher than 4 dpf (p < 0.05, ANOVA).
Developmental changes of synaptic RFs can account for the changes of spike RFs
Can the observed developmental changes in excitatory and inhibitory RFs sufficiently account for the changes in the spike RF? To address this question, we simulated spike RF by integrating excitatory and inhibitory inputs in an integrate-and-fire neuron model, with neuronal parameters mostly determined in our experiments (see Materials and Methods). The level of spike threshold was determined from the voltage responses to current injections. The reversal potential for inhibitory currents (Ei) was determined by performing gramicidin perforated-patch recordings from tectal neurons while puffing GABA to examine GABA-evoked currents (Ebihara et al., 1995; Akerman and Cline, 2006; Y. Liu et al., 2007). Ei was found as −47.6 ± 6.8, −50.4 ± 4.5, −52.1 ± 6.4, −53.6 ± 4.0, and −54.5 ± 4.6 mV (mean ± SD; n = 7, 8, 8, 8, and 8) at 4, 5, 6, 7, and 8–9 dpf, respectively. As shown in an example cell, the simulated spike RF was smaller than both the excitatory and inhibitory RFs (Fig. 5A), consistent with the experimental results. The spike RF became slightly larger when the inhibitory input was removed (Fig. 5A, bottom right). In the summary of all the cells, the average size of the simulated spike RF (with both excitatory and inhibitory inputs present) first increased from 4 to 6 dpf and then reduced from 6 to 8–9 dpf (Fig. 5B, black). This pattern matches the developmental progression of the recorded spike RF. Interestingly, in the absence of inhibitory inputs, spike RFs generated from excitatory inputs alone exhibited a similar pattern of developmental change in size (Fig. 5B, red). This indicates that inhibitory inputs generally reduce the size of the spike RF without affecting its developmental progression. In addition, within the same testing period, we did not observe significant developmental changes in the excitability of tectal neurons, as evidenced by the relatively stable resting membrane potential (Fig. 5C), level of spike threshold (Fig. 5D), and number of spikes in response to a step current injection (Fig. 5E). This apparent discrepancy from the observations in the Xenopus retinotectal system (Pratt and Aizenman, 2007) may be attributed to different specific developmental windows in the two spices. Together, these results suggest that the developmental changes of excitatory and inhibitory synaptic inputs can account for the initial expansion and later refinement of tectal spike RFs and that the modulation of excitatory inputs primarily drives the maturation of tectal spike RFs.
Developmental changes of spike RFs of RGCs
Tectal cells receive excitatory input from different sources, including the direct retinotectal input and the recurrent intratectal input (Pratt et al., 2008). The developmental changes in the size of tectal excitatory RFs may therefore be attributed to three factors: changes in the size of spike RF of individual RGCs, in the convergence of retinotectal connections, or in the extent and strength of intratectal connections. We first determined the developmental changes in the spike RF of RGCs during the same period. Cell-attached recordings were made from individual RGCs in the whole-mount isolated retina (see Materials and Methods). Because RGCs exhibited much smaller RFs compared with tectal neurons, to achieve a comparable mapping resolution, we used flash squares of approximately half the size of those used for mapping tectal cell RFs (Fig. 6A, left). The recorded RGCs responded to flash stimuli with a train of spikes. Compared with the RF center, stimuli applied to the RF periphery evoked fewer spikes with longer onset delays (Fig. 6A). In contrast to tectal neurons, the spike RF of RGCs did not exhibit significant changes in size between 4 and 8 dpf, despite a slight increase from 6 to 8–9 dpf (Fig. 6B, left). Conversely, the size of the tectal excitatory RF reduced by ∼50% from 6 to 8–9 dpf. The tectal excitatory RF always appeared larger than the spike RF of single RGCs across different testing stages, and the ratio of the average size of tectal excitatory RFs over that of RGC spike RFs was first increased and then reduced during development (Fig. 6B, right). Assuming that excitatory inputs to tectal neurons are predominantly from RGCs, the ratio provides an estimation of the minimum number of RGCs needed to provide excitatory input to a tectal neuron to cover its entire excitatory RF. The strength of evoked spiking activity of RGCs did not significantly change during the testing period (Fig. 6C). Together, the absence of sharpening of RGC spike RFs indicates that the developmental reduction in the size of tectal synaptic RFs can be primarily attributed to changes in the retinotectal or intratectal connections.
Figure 6.

Developmental changes in spike RFs of RGCs. A, Left, Spike RF of an example RGC in relation to the retina. Intensity scale indicates the average number of evoked spikes. Scale bar, 18 μm. Middle, Raw traces of spike On responses. Calibration: 30 pA, 100 ms. Right, Enlarged traces of On responses (3 trials) to stimuli at locations on the RF map labeled by * and +, respectively. Calibration: 15 pA, 50 ms. D, Dorsal; V, ventral; N, nasal; T, temporal. B, Left, Average size of RGC spike RFs at different stages (n = 13, 12, and 12 cells). Error bars indicate SE. There is no significant difference between groups (p > 0.05, ANOVA). Triangle indicates the average size of the tectal excitatory RF at the same stage. Right, Ratio of the average size of the tectal excitatory RF to that of the RGC spike RF. C, Average number of spikes evoked by a unit stimulus in RGCs (n = 13, 12, and 12 cells).
Contribution of intratectal excitatory connections
To further explore how much the intratectal excitatory inputs contribute to the size of the tectal excitatory RF, we eliminated these inputs by iontophoretically applying a mixture of muscimol, a GABAA receptor agonist, and SCH50911, a specific GABAB receptor blocker to silence spiking activity in the tectum (see Materials and Methods) (B. H. Liu et al., 2007). We tested the effective range by varying the distance between the tip of the iontophoresis pipette and the loosely patched cell. For tectal cells just below the exposed periventricular surface, the mixture application effectively blocked their spikes within a radius of ∼200 μm (Fig. 7A). Loose-patch recordings from cells 50–70 μm below the periventricular surface further indicated that neurons in the deep tectal tissue could also be silenced within a radius of at least 150 μm (Fig. 7A, right). Thus, it is reasonable to believe that the majority, if not all, of intratectal excitatory connections could be silenced by the mixture application.
Figure 7.
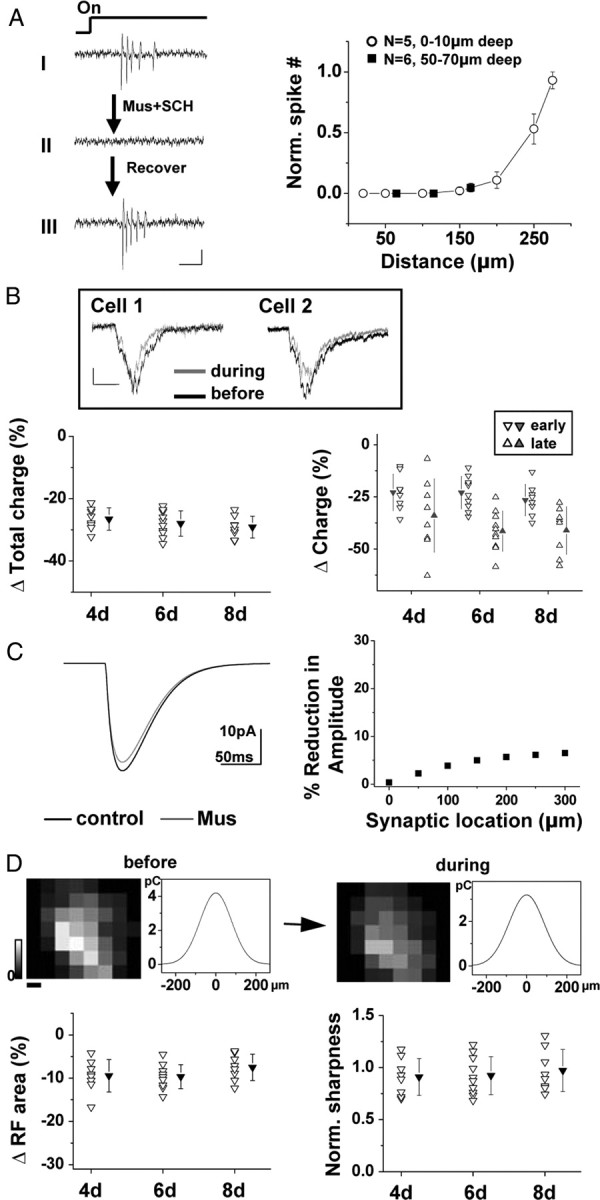
Contribution of intratectal excitatory connections. A, Left, Visually evoked spike responses of a loosely patched tectal cell close to the periventricular surface before (I), during (II), and after (III) the iontophoresis of muscimol (mus) and SCH95011 (SCH). The onset of the stimulus is indicated on top. Calibration: 10 pA, 50 ms. Right, The average number of evoked spikes during iontophoresis (normalized to that during control period before iontophoresis) versus the distance of the iontophoresis pipette. Responses were tested at different depths below the periventricular surface. Error bars indicate SD. B, Top, Averaged excitatory responses (from 6 repeats) of two example tectal neurons evoked by whole-field light stimulation before and during the iontophoresis. Calibration: 10 pA, 100 ms. Bottom left, Percentage change in the integrated charge of light-evoked excitatory currents (within a 250 ms window) after blocking the spiking of tectal cells. n = 8, 10, and 8 for 4, 6, and 8 dpf, respectively. Filled symbols indicate mean ± SD. Bottom right, Percentage change in synaptic charge within the first and last 75 ms bin of the 250 ms window (or the last 75 ms window of the response if it ends earlier than 250 ms). C, Left, Simulated somatic current during activation of an α synapse (0.8 nS peak conductance) located on the dendrite 300 μm away from the soma, before and after application of muscimol, which increases membrane leakage conductance by 100%. Right, Percentage reduction in the amplitude of the somatic current after increasing the leakage conductance by 100% plotted against the distance of the α synapse from the soma. D, Top, Excitatory RF of a tectal neuron (6 dpf) before and during iontophoresis of the muscimol mixture and the corresponding spatial tuning curve. Each map is averaged from three repeats. Color scale, 4.2 pC for maximum. Scale bar, 34 μm. Bottom left, Percentage change in RF size after blocking the spiking of the tectal cells. n = 8, 10, and 8 for 4, 6, and 8 dpf, respectively. Filled symbols indicates mean ± SD. Bottom right, Sharpness of the excitatory tuning profile after tectal silencing normalized to that before silencing. Filled symbols indicate mean ± SD.
Interestingly, after silencing tectal spiking activity, the excitatory currents evoked by whole-field light stimulation were reduced by only ∼30% in terms of total integrated charge (Fig. 7B, bottom left). The percentage reduction in synaptic charge was larger in a late time window than in an early window (Fig. 7B, bottom right), suggesting that intratectal inputs contribute relatively more to the late phase than the early phase of the excitatory response. During the mixture application, membrane leakage conductance increased by ∼59 ± 47% (mean ± SD; n = 12; see discussion in Materials and Methods) as a result of the activation of GABAA receptors. To estimate how much this change in membrane leakage conductance would lead to reduced amplitude of recorded synaptic currents, we simulated excitatory synaptic responses in a neuron model (see Methods and Materials). As shown in Figure 7C, a 100% increase in membrane leakage conductance would at most result in a small reduction in the amplitude of synaptic currents recorded from the soma. Based on this simulation result, we conclude that a large part of the observed amplitude reduction can be attributed to the elimination of intratectal excitatory connections, which contribute even <30% of the total excitatory response. Thus, at these early developmental stages, visually evoked excitatory currents in tectal neurons are dominated by inputs directly from RGCs.
We further mapped excitatory RFs in the same cell before and after silencing tectal spiking. The size of the tectal excitatory RF reduced by <10% for all the stages tested (Fig. 7D, bottom left). In addition, the sharpness of the excitatory tuning profile was not significantly affected by eliminating intratectal excitatory inputs (Fig. 7D, bottom right). These data demonstrate that, for the developmental period examined in this study, the spatial extent of excitatory inputs as well as the sharpness of their tuning profile is mainly determined by feedforward retinotectal inputs, which contribute >70% of the total excitatory response. Therefore, the refinement of the tectal excitatory RF is mainly attributed to a refinement of retinotectal connections.
Discussion
In this study, we examined the functional development of visual RFs of zebrafish tectal neurons during an early period of formation and maturation of the retinotectal circuit. In contrast to a previous Ca2+ imaging study (Niell and Smith, 2005), we observed developmental changes in the size of tectal spike RFs. This discrepancy may be attributable to a more sensitive measurement of spike responses as well as more complete coverage of developmental stages in our study. Our data show that, although there is no significant difference in the size of tectal spike RFs between 4 and 8–9 dpf, the RFs are significantly smaller at 8–9 than at 6 dpf. Thus, early functional RF refinement does occur in the developing retinotectal circuit, which may lead to an increased acuity in visually guided behaviors (Dong et al., 2009).
By examining the spatial patterns of excitatory and inhibitory inputs to tectal cells, we found that the developmental changes in their spike RFs can be well explained by those in their inputs. The spatial extents of both excitatory and inhibitory RFs exhibit an initial increase and then a marked decrease. Together with a gradual strengthening of synaptic inputs at the emerging RF center, the spatial tuning profiles of the synaptic RFs are greatly sharpened at more mature stages. In the meanwhile, the refined excitatory and inhibitory RFs become well matched in their spatial profiles. The refinement and progressive matching of excitatory and inhibitory synaptic RFs are consistent with the previous results in Xenopus tadpoles (Tao and Poo, 2005), suggesting that, at more mature stages, the inhibitory inputs to the tectal cell derive from inhibitory interneurons driven by a similar set of RGC inputs as that driving the cell itself. Importantly, the integration of experimentally recorded excitatory and inhibitory conductances in the neuron model simulates a similar developmental progression of spike RFs as observed. This suggests that the functional RF refinement can be attributed to the refinement of synaptic inputs, especially the excitatory input.
Because RGC spike RFs do not change significantly in size during the same developmental period and intratectal excitatory connections contribute little to the total spatial range of excitatory inputs, the initial expansion and the following shrinkage of tectal excitatory RFs can be mainly attributed to a change in the convergence of feedforward retinotectal inputs. Our results suggest a model of two-stage development of the retinotectal circuit. Shortly after RGC axons begin to make synapses in the tectum, the tectal excitatory RF expands as a result of new functional retinotectal connections being increasingly formed. It is also possible that the retinotectal connections are formed exuberantly from the start and that an apparent expansion of the tectal excitatory RF results from strengthening of weak inputs in the periphery of the RF, which are initially below the detection threshold. At later stages, the sharpening of the tectal excitatory RF is achieved by a selective elimination of retinotectal connections in the periphery of the RF and strengthening of connections in the RF center. Similarly, elimination of retinotectal inputs to inhibitory interneurons may lead to sharpening of inhibitory RFs. Interestingly, during the period when tectal synaptic RFs are expanding, the evoked GABAergic responses are depolarizing (i.e., Ei is more depolarized than the resting membrane potential, although it is more hyperpolarized than the spike threshold). They become less depolarizing and likely more hyperpolarizing over development, similar to that observed in many developing systems (Ben-Ari, 2002; Owens and Kriegstein, 2002). Akerman and Cline (2006) have shown that depolarizing GABAergic conductances augment retinotectal transmission through NMDA receptors, which may be important for the maturation of retinotectal synapses. This raises an interesting question for future studies, that is, whether depolarizing GABAergic conductances facilitate the early expansion of tectal synaptic RFs, whereas more hyperpolarizing GABAergic conductances allow the selective elimination of retinotectal inputs.
In vertebrates, a developmental pruning of axons has long been recognized. In the chick tectum and rodent superior collicullus (mammalian analog of the tectum), retinal axons initially overshoot their appropriate termination zones and branch widely before gradually withdrawing branches from retinotopically incorrect territories (Nakamura and O'Leary, 1989; Simon and O'Leary, 1992; McLaughlin et al., 2003). Such large-scale retraction of axonal branches, however, has not been found in the frog and fish tectum (Sakaguchi and Murphey, 1985; Schmidt et al., 2000; Meyer and Smith, 2006). In zebrafish larvae, retinal axons exhibit monotonic increases in total arbor length and number of branches from 3 to 6 dpf, which are then stabilized after 6 dpf (Meyer and Smith, 2006). The tectal cell dendrites also increase in total arbor length during the same period (Niell et al., 2004). Although the early expansion of tectal synaptic RFs is consistent with the increases in retinal axonal and tectal dendritic arbors, their later refinement cannot be easily predicted because there is no evidence of axonal or dendritic pruning. Our study suggests that functional synaptic elimination can occur in the absence of apparent morphological pruning of axonal or dendritic arbors and that a selective elimination of feedforward excitatory inputs is the major contributing factor for the functional RF refinement during early development of the retinotectal circuit.
Footnotes
This work was supported by the Kirchgessner Foundation and National Institutes of Health Grant EY019049 (H.W.T.).
References
- Akerman CJ, Cline HT. Depolarizing GABAergic conductances regulate the balance of excitation to inhibition in the developing retinotectal circuit in vivo. J Neurosci. 2006;26:5117–5130. doi: 10.1523/JNEUROSCI.0319-06.2006. [DOI] [PMC free article] [PubMed] [Google Scholar]
- Antonini A, Stryker MP. Development of individual geniculocortical arbors in cat striate cortex and effects of binocular impulse blockade. J Neurosci. 1993;13:3549–3573. doi: 10.1523/JNEUROSCI.13-08-03549.1993. [DOI] [PMC free article] [PubMed] [Google Scholar]
- Baier H. Zebrafish on the move: towards a behavior-genetic analysis of vertebrate vision. Curr Opin Neurobiol. 2000;10:451–455. doi: 10.1016/s0959-4388(00)00116-1. [DOI] [PubMed] [Google Scholar]
- Ben-Ari Y. Excitatory actions of GABA during development: the nature of the nurture. Nat Rev Neurosci. 2002;3:728–739. doi: 10.1038/nrn920. [DOI] [PubMed] [Google Scholar]
- Bureau I, Shepherd GM, Svoboda K. Precise development of functional and anatomical columns in the neocortex. Neuron. 2004;42:789–801. doi: 10.1016/j.neuron.2004.05.002. [DOI] [PubMed] [Google Scholar]
- Chen C, Regehr WG. Developmental remodeling of the retinogeniculate synapse. Neuron. 2000;28:955–966. doi: 10.1016/s0896-6273(00)00166-5. [DOI] [PubMed] [Google Scholar]
- Dong W, Lee RH, Xu H, Yang S, Pratt KG, Cao V, Song YK, Nurmikko A, Aizenman CD. Visual avoidance in Xenopus tadpoles is correlated with the maturation of visual responses in the optic tectum. J Neurophysiol. 2009;101:803–815. doi: 10.1152/jn.90848.2008. [DOI] [PMC free article] [PubMed] [Google Scholar]
- Ebihara S, Shirato K, Harata N, Akaike N. Gramicidin-perforated patch recording: GABA response in mammalian neurones with intact intracellular chloride. J Physiol. 1995;484:77–86. doi: 10.1113/jphysiol.1995.sp020649. [DOI] [PMC free article] [PubMed] [Google Scholar]
- Engert F, Tao HW, Zhang LI, Poo MM. Moving visual stimuli rapidly induce direction sensitivity of developing tectal neurons. Nature. 2002;419:470–475. doi: 10.1038/nature00988. [DOI] [PubMed] [Google Scholar]
- Fagiolini M, Pizzorusso T, Berardi N, Domenici L, Maffei L. Functional postnatal development of the rat primary visual cortex and the role of visual experience: dark rearing and monocular deprivation. Vision Res. 1994;34:709–720. doi: 10.1016/0042-6989(94)90210-0. [DOI] [PubMed] [Google Scholar]
- Hooks BM, Chen C. Distinct roles for spontaneous and visual activity in remodeling of the retinogeniculate synapse. Neuron. 2006;52:281–291. doi: 10.1016/j.neuron.2006.07.007. [DOI] [PubMed] [Google Scholar]
- Huang L, Pallas SL. NMDA antagonists in the superior colliculus prevent developmental plasticity but not visual transmission or map compression. J Neurophysiol. 2001;86:1179–1194. doi: 10.1152/jn.2001.86.3.1179. [DOI] [PMC free article] [PubMed] [Google Scholar]
- Katz LC, Shatz CJ. Synaptic activity and the construction of cortical circuits. Science. 1996;274:1133–1138. doi: 10.1126/science.274.5290.1133. [DOI] [PubMed] [Google Scholar]
- Liu BH, Wu GK, Arbuckle R, Tao HW, Zhang LI. Defining cortical frequency tuning with recurrent excitatory circuitry. Nat Neurosci. 2007;10:1594–1600. doi: 10.1038/nn2012. [DOI] [PMC free article] [PubMed] [Google Scholar]
- Liu BH, Li P, Sun YJ, Li YT, Zhang LI, Tao HW. Intervening inhibition underlies simple-cell receptive field structure in visual cortex. Nat Neurosci. 2010;13:89–96. doi: 10.1038/nn.2443. [DOI] [PMC free article] [PubMed] [Google Scholar]
- Liu Y, Zhang LI, Tao HW. Heterosynaptic scaling of developing GABAergic synapses: dependence on glutamatergic input and developmental stage. J Neurosci. 2007;27:5301–5312. doi: 10.1523/JNEUROSCI.0376-07.2007. [DOI] [PMC free article] [PubMed] [Google Scholar]
- Mata ML, Ringach DL. Spatial overlap of ON and OFF subregions and its relation to response modulation ratio in macaque primary visual cortex. J Neurophysiol. 2005;93:919–928. doi: 10.1152/jn.00668.2004. [DOI] [PubMed] [Google Scholar]
- McLaughlin T, Torborg CL, Feller MB, O'Leary DD. Retinotopic map refinement requires spontaneous retinal waves during a brief critical period of development. Neuron. 2003;40:1147–1160. doi: 10.1016/s0896-6273(03)00790-6. [DOI] [PubMed] [Google Scholar]
- Meyer MP, Smith SJ. Evidence from in vivo imaging that synaptogenesis guides the growth and branching of axonal arbors by two distinct mechanisms. J Neurosci. 2006;26:3604–3614. doi: 10.1523/JNEUROSCI.0223-06.2006. [DOI] [PMC free article] [PubMed] [Google Scholar]
- Nakamura H, O'Leary DD. Inaccuracies in initial growth and arborization of chick retinotectal axons followed by course corrections and axon remodeling to develop topographic order. J Neurosci. 1989;9:3776–3795. doi: 10.1523/JNEUROSCI.09-11-03776.1989. [DOI] [PMC free article] [PubMed] [Google Scholar]
- Niell CM, Smith SJ. Functional imaging reveals rapid development of visual response properties in the zebrafish tectum. Neuron. 2005;45:941–951. doi: 10.1016/j.neuron.2005.01.047. [DOI] [PubMed] [Google Scholar]
- Niell CM, Meyer MP, Smith SJ. In vivo imaging of synapse formation on a growing dendritic arbor. Nat Neurosci. 2004;7:254–260. doi: 10.1038/nn1191. [DOI] [PubMed] [Google Scholar]
- Owens DF, Kriegstein AR. Is there more to GABA than synaptic inhibition? Nat Rev Neurosci. 2002;3:715–727. doi: 10.1038/nrn919. [DOI] [PubMed] [Google Scholar]
- Pratt KG, Aizenman CD. Homeostatic regulation of intrinsic excitability and synaptic transmission in a developing visual circuit. J Neurosci. 2007;27:8268–8277. doi: 10.1523/JNEUROSCI.1738-07.2007. [DOI] [PMC free article] [PubMed] [Google Scholar]
- Pratt KG, Dong W, Aizenman CD. Development and spike timing-dependent plasticity of recurrent excitation in the Xenopus optic tectum. Nat Neurosci. 2008;11:467–475. doi: 10.1038/nn2076. [DOI] [PubMed] [Google Scholar]
- Priebe NJ, Ferster D. Inhibition, spike threshold, and stimulus selectivity in primary visual cortex. Neuron. 2008;57:482–497. doi: 10.1016/j.neuron.2008.02.005. [DOI] [PubMed] [Google Scholar]
- Priebe NJ, Mechler F, Carandini M, Ferster D. The contribution of spike threshold to the dichotomy of cortical simple and complex cells. Nat Neurosci. 2004;7:1113–1122. doi: 10.1038/nn1310. [DOI] [PMC free article] [PubMed] [Google Scholar]
- Ramdya P, Engert F. Emergence of binocular functional properties in a monocular neural circuit. Nat Neurosci. 2008;11:1083–1090. doi: 10.1038/nn.2166. [DOI] [PMC free article] [PubMed] [Google Scholar]
- Ruthazer ES, Cline HT. Insights into activity-dependent map formation from the retinotectal system: a middle-of-the-brain perspective. J Neurobiol. 2004;59:134–146. doi: 10.1002/neu.10344. [DOI] [PubMed] [Google Scholar]
- Sakaguchi DS, Murphey RK. Map formation in the developing Xenopus retinotectal system: an examination of ganglion cell terminal arborizations. J Neurosci. 1985;5:3228–3245. doi: 10.1523/JNEUROSCI.05-12-03228.1985. [DOI] [PMC free article] [PubMed] [Google Scholar]
- Sanes DH, Constantine-Paton M. The sharpening of frequency tuning curves requires patterned activity during development in the mouse, Mus musculus. J Neurosci. 1985;5:1152–1166. doi: 10.1523/JNEUROSCI.05-05-01152.1985. [DOI] [PMC free article] [PubMed] [Google Scholar]
- Schmidt JT, Buzzard M, Borress R, Dhillon S. MK801 increases retinotectal arbor size in developing zebrafish without affecting kinetics of branch elimination and addition. J Neurobiol. 2000;42:303–314. [PubMed] [Google Scholar]
- Simon DK, O'Leary DD. Development of topographic order in the mammalian retinocollicular projection. J Neurosci. 1992;12:1212–1232. doi: 10.1523/JNEUROSCI.12-04-01212.1992. [DOI] [PMC free article] [PubMed] [Google Scholar]
- Smear MC, Tao HW, Staub W, Orger MB, Gosse NJ, Liu Y, Takahashi K, Poo MM, Baier H. Vesicular glutamate transport at a central synapse limits the acuity of visual perception in zebrafish. Neuron. 2007;53:65–77. doi: 10.1016/j.neuron.2006.12.013. [DOI] [PMC free article] [PubMed] [Google Scholar]
- Spruston N, Jaffe DB, Williams SH, Johnston D. Voltage- and space-clamp errors associated with the measurement of electrotonically remote synaptic events. J Neurophysiol. 1993;70:781–802. doi: 10.1152/jn.1993.70.2.781. [DOI] [PubMed] [Google Scholar]
- Sun YJ, Wu GK, Liu BH, Li P, Zhou M, Xiao Z, Tao HW, Zhang LI. Fine-tuning of pre-balanced excitation and inhibition during auditory cortical development. Nature. 2010;465:927–931. doi: 10.1038/nature09079. [DOI] [PMC free article] [PubMed] [Google Scholar]
- Tan AY, Zhang LI, Merzenich MM, Schreiner CE. Tone-evoked excitatory and inhibitory synaptic conductances of primary auditory cortex neurons. J Neurophysiol. 2004;92:630–643. doi: 10.1152/jn.01020.2003. [DOI] [PubMed] [Google Scholar]
- Tao HW, Poo MM. Activity-dependent matching of excitatory and inhibitory inputs during refinement of visual receptive fields. Neuron. 2005;45:829–836. doi: 10.1016/j.neuron.2005.01.046. [DOI] [PubMed] [Google Scholar]
- Tavazoie SF, Reid RC. Diverse receptive fields in the lateral geniculate nucleus during thalamocortical development. Nat Neurosci. 2000;3:608–616. doi: 10.1038/75786. [DOI] [PubMed] [Google Scholar]
- Troyer TW, Krukowski AE, Priebe NJ, Miller KD. Contrast-invariant orientation tuning in cat visual cortex: thalamocortical input tuning and correlation-based intracortical connectivity. J Neurosci. 1998;18:5908–5927. doi: 10.1523/JNEUROSCI.18-15-05908.1998. [DOI] [PMC free article] [PubMed] [Google Scholar]
- Wehr M, Zador AM. Balanced inhibition underlies tuning and sharpens spike timing in auditory cortex. Nature. 2003;426:442–446. doi: 10.1038/nature02116. [DOI] [PubMed] [Google Scholar]
- Westerfield M. Eugene, OR: Institute of Neuroscience, University of Oregon; 1993. The zebrafish book. [Google Scholar]
- Wu GK, Arbuckle R, Liu BH, Tao HW, Zhang LI. Lateral sharpening of cortical frequency tuning by approximately balanced inhibition. Neuron. 2008;58:132–143. doi: 10.1016/j.neuron.2008.01.035. [DOI] [PMC free article] [PubMed] [Google Scholar]
- Xiao T, Roeser T, Staub W, Baier H. A GFP-based genetic screen reveals mutations that disrupt the architecture of the zebrafish retinotectal projection. Development. 2005;132:2955–2967. doi: 10.1242/dev.01861. [DOI] [PubMed] [Google Scholar]
- Zhang LI, Poo MM. Electrical activity and development of neural circuits. Nat Neurosci. 2001;4:1207–1214. doi: 10.1038/nn753. [DOI] [PubMed] [Google Scholar]
- Zhang LI, Bao S, Merzenich MM. Persistent and specific influences of early acoustic environments on primary auditory cortex. Nat Neurosci. 2001;4:1123–1130. doi: 10.1038/nn745. [DOI] [PubMed] [Google Scholar]