

I. SUMMARY
In humans and in animal models of stroke, collateral blood flow between territories of the major pial arteries has a profound impact on cortical infarct size. However, there is a gap in our understanding of the genetic determinants of collateral formation and flow, as well as the signaling pathways and neurovascular interactions regulating this flow. Previous studies have demonstrated that collateral flow between branches of the anterior cerebral artery (ACA) and the middle cerebral artery (MCA) can protect mouse cortex from infarction after middle cerebral artery occlusion. Because the number and diameter of collaterals varies among mouse strains and after transgenic manipulations, a combination of methods is required to control for these variations. Here, we report an inexpensive approach to characterizing the cerebrovascular anatomy, and in vivo monitoring of cerebral blood flow as well. Further, we introduce a new, minimally invasive method for the occlusion of distal MCA branches. These methods will permit a new generation of studies on the mechanisms regulating collateral remodeling and cortical blood flow after stroke.
II. KEYWORDS: Photothrombosis, anastomoses, collateral blood flow, quantum dots, vessel painting, laser speckle imaging
III. INTRODUCTION
Tissue plasminogen activator (tPA) and mechanical interventions (e.g., the Merci retriever) are front-line treatments for acute stroke in the clinic. However, many patients cannot receive tPA owing to risk for hemorrhagic stroke and other factors, and mechanical interventions cannot access all clots. Thus, additional approaches to the treatment of stroke are urgently needed. Collateral flow enhancement represents a major therapeutic target [1], yet little is known about the factors that regulate collateral flow under physiological or pathophysiological conditions.
Using vascular casting, previous studies have demonstrated vascular remodeling and collateral flow after stroke [2]. In terms of basic cerebral vascular anatomy, Majid et al were among the first to recognize the variability of ischemic injury after focal ischemia among common mouse strains [3]. Keum and Marchuk demonstrated wide variation among mouse strains in cortical infarct volume after distal middle cerebral artery (MCA) occlusion using electrocautery and transection of the distal MCA trunk [4]. Based on these initial findings, a series of careful and comprehensive publications from Faber’s group have demonstrated a direct relationship between collateral vessel number and diameter on cortical infarct volume after distal MCA occlusion [5–9]. The stage has thus been set for direct manipulations of the collateral system via preconditioning and/or transgenic strategies (e.g. [7]), as well as post-stroke pharmacological approaches. This protocol paper describes the tools necessary to move the field forward with a relatively simple and inexpensive approach combining a rapid, cost-effective assay for cerebrovascular (i.e., pial vessel) structure, procedures for laser speckle contrast imaging of cerebral blood flow, and a minimally invasive stroke model compatible with adult and aged mice.
IV. MATERIALS
Addresses for companies are provided at the first instance.
Vessel painting (necessary additional details are provided in [10])
DiI [1,1′-dioctadecyl-3,3,3′,3′-tetramethylindocarbocyanine perchlorate] (product D-282, Invitrogen; Carlsbad, California).
Two 50 mL centrifuge tubes (VWR, West Chester, Pennsylvania)
PE-50 tubing (Intramedic, Becton Dickinson Company, Sparks, Maryland)
Pressure gauge from blood pressure cuff (available at local drug store)
Pressurized air tank (a 1-2L empty plastic bottle with air tight cap will suffice)
27 gauge Luer stub (beveled at 45° for cardiac insertion)
Syringe pump (Harvard Apparatus, Holliston, Massachusetts).
Please refer to the primary reference for details regarding the preparation of the DiI sucrose solution and other materials [10].
Standard fluorescence microscope with 4–5× objective compatible with fluorescence, a tetramethylrhodamine excitation/emission filter set, a digital camera for imaging, and image acquisition software.
Dual femoral artery and vein catheters
MicroRenathane® tubing (MRE-025, Braintree Scientific, Braintree, Massachusetts)
1 cc syringes (Becton Dickinson Company)
Luer stub tubing adapter (27 gauge, Becton Dickinson Company)
100 uL Hamilton Syringe, model 710LT, 80601 (Hamilton Company, Reno, Nevada).
Surgical tools: 2 #7 curved forceps (Roboz INOX), iridectomy scissors (part 15000–03, Fine Science Tools, Foster City, California), tool sterilizer (“Bactizapper”, VWR)
0.9% sodium chloride for injection (Hospira, Lake Forest, Illinois)
Heparin, sodium injection, 1000 USP units/ml (APP Pharmaceuticals, Schaumburg, Illinois)
Note: To make heparinized saline: combine sodium chloride for injection with heparin, 1 USP unit/ml.
1% lidocaine HCl (Hospira, Lake Forest, Illinois)
Betadine topical disinfectant (VWR)
7-0 black braided silk suture, non-absorbable (code 103-S, Deknatel, Research Triangle Park, North Carolina).
Microvessel clip: S&T vascular clamp, 3.5mm × 1mm jaw, 7mm long (part number 00396-01, Fine Science Tools).
Animal handling equipment and supplies
Mouse temperature control and warming pad (part numbers: 21060-90 8×11cm heating pad; 21052-00 Temperature controller; 21051-00 Power supply; 21060-01 rectal probe, all from Fine Science Tools).
Brain temperature controller: thermoregulatory lamp system (custom system similar to model TCAT-2AC, Braintree Scientific) with needle temperature probe in ipsilateral temporalis muscle and ceramic heat element (Repticare 100W ceramic emitter, Zoo Med, San Luis Obispo, California).
Anesthesia system: Ohio isoflurane vaporizer (OHIO-100, Parkland Scientific, Coral Springs, Florida); vacuum recapture system (Fluovac and Fluosorber, Harvard Apparatus); stereotaxic frame with integrated tooth bar and anesthesia delivery; surgical microscope with 40× magnification and 20× eye pieces (Carl Zeiss Microimaging, Thornwood, New York). Anesthesia induction box (AB-1, Braintree Scientific). Oxygen and nitrous oxide gas tanks (Airgas) and manifold (Parkland Scientific).
Arterial blood pressure monitoring: transducer (BP-100, iWorx, Dover, New Hampshire), amplifier (Bridge Bio amplifier, ETH-255, CB Sciences, Dover, New Hampshire), digitizer (MiniDigi, Molecular Devices, Sunnyvale, California) and acquisition software (Axoscope, Molecular Devices).
Small animal shaver (model 32375, Braintree Scientific)
Microdrill (MD-1200, Braintree Scientific)
AKWA Tears, lubricant opthalamic ointment (Akorn, Buffalo Grove, Illinois).
Mineral oil (sterilized with a 0.4 μm pore size polycarbonate membrane filter)
Cotton-tipped applicators (VWR)
Bioadhesive (Vetbond, 3M, St. Paul, Minnesota)
Local anesthetic (Xylocaine, APP Pharmaceuticals)
Buprenorphine (0.05 mg/kg BID, controlled substance available from the institutional Division of Veterinary Resources)
Laser occlusion system
Qtracker 655 non-targeted quantum dots, 2 μM solution (Q21021MP, Invitrogen, Carlsbad, California). These quantum dots have a polyethylene glycol (PEG) surface coating to render them relatively inert in the blood stream. In perfusion-fixed tissue 24 hours after injection, we found no evidence of sequestration or accumulation within the blood vessels or other tissues of the brain. A volume in μl equal to the mass of the animal in g is diluted in saline for a final volume of 100 μL for i.v. injection at 2 fmoles/g.
A750 mm optical rail is mounted on the stereotaxic frame at a 13° angle from vertical to ensure that the beam of the laser(mounted at the distal end of the rail) is approximately perpendicular to the skull surface overlying the cortical region of interest. The following items are listed in order of their mounting on the optical rail (farthest from the animal first):
Continuous wave (CW) diode-pumped Nd:YAG solid-state laser (DPSS) with 100 mW output power emitted at the frequency-doubled wavelength of 532 nm, with analog and digital modulation, 2mm output beam diameter (model LS-532-00100-CWM-SD-05-OEM-0, OEM Laser Systems, East Lansing, Michigan). The laser power is controlled via analog modulation circuitry. Use the laser power meter to determine the analog voltages to obtain 200μW, 5 mW, and 40 mW.
Uniblitz Shutter (model LS-6, Vincent Associates, Rochester, New York) and shutter controller SD-10 (current model: VMM-T1, Vincent Associates).
10× laser beam expander (model 50-25-10×-532, Special Optics, Wharton, New Jersey)
Cylindrical lenses, 250 mm focal length(2× part number LJ1267RM-A, Thorlabs, Newton, New Jersey), rotational mounts (2× CRM1 mounted on four rods on the PRM1 rotation mount, Thorlabs) and mounting components for optical rail(Thorlabs).
Beam positioner: In-line positioner (part number 12-4015-20-532, Special Optics; a Risley prism pair is also commercially available, model 12-2002-532, Special Optics).
750 mm optical rail for mounting laser (CVI-Melles Griot, Albuquerque, NM), optical mounting components (Thorlabs).
A handheld laser power meter is crucial for these experiments (LaserCheck, Coherent, Santa Clara, California).
580 nm long pass filter for visualizing quantum dot emission (BLP01-561R-25, Semrock, Rochester, New York).
Laser speckle contrast imaging system
QICAM-IR Fast 1394 firewire infrared-sensitive camera (QImaging, Surrey, British Columbia, Canada). The Rolera-XR is the current replacement; however, an inexpensive analog camera with IR sensitivity can also produce effective laser speckle images using a video frame grabber). Mounting rod and adjustable clamp (Thorlabs). We use Image Pro Plus (v5.1, Media Cybernetics, Bethesda, Maryland) for image acquisition via the computer’s firewire port. Acquisition computer: Dell 530s with 4Gb RAM, 500Gb hard disk, Intel E8400 (3.0GHz) processor, firewire card.
Zoom lens assembly: 6.5× Zoom (model 1-6265), 1.0× Standard Adapter (1-6015), 0.5× Lens Attachment (1-60110) and C-mount Coupler (1-6010). All components based on the Zoom 6000 system (Navitar, Rochester, NY). A band pass filter at 785 nm is used to reject room light and other artifacts (part number 785/62, Semrock).
Diode laser at 785 nm, Sanyo model DL7140-201S (Thorlabs) and a laser diode controller (e.g. LDC201CU, Thorlabs; however, a simple laser diode controller can be assembled for under $200. A wiring diagram and parts list are available from the corresponding author); focusing lens from fiber optic light source; mounting rod and adjustable clamp
All devices are mounted on rods attached to the main plate of the stereotaxic device. Depending on the magnitude of floor vibrations, it may be necessary to use vibration isolation pads (e.g. part #0205050, Sorbothane, Kent, Ohio).
ImageJ routine: ImageJ is a free image acquisition and analysis software package available from the NIH (http://rsbweb.nih.gov/ij/). The following routine should be copied and pasted into a text file and saved in the “macros” folder of the ImageJ folder system. Open the file using the Plugins/Macros/Edit menu selection.
The macro “Transform” converts raw images into laser speckle contrast images. We use the inverse of the squared contrast (p=μ2/σ2, where p is the new pixel value, μ is the local mean intensity and σ is the local standard deviation of the intensity, each using a 2 pixel × 2 pixel filter). This produces an image whose intensity reflects the degree of flow: high flow regions appear as bright (high values) and low flow regions appear as dark pixels (low values). The goal of this type of analysis is to rapidly process a stack of 300 images to produce a laser speckle contrast image. Depending on the processor speed and memory, this can be accomplished in under a minute.
Macro “Transform” {
path=File.openDialog(“Select raw image sequence”);
title=File.getName(path);
open(title);
title=File.nameWithoutExtension;
s_mLSC = title+”_i.tif”
s_LSC = title+”_m.tif”
run(“32-bit”);
rename(“raw.tif”);
selectWindow(“raw.tif”);
run(“Duplicate...”, “title=var.tif duplicate range=1-”+nSlices);
run(“Duplicate...”, “title=mean.tif duplicate range=1-”+nSlices);
selectWindow(“raw.tif”);
close();
selectWindow(“var.tif”);
run(“Variance...”, “radius=2 stack”); // variance is the square of the SD
selectWindow(“mean.tif”);
run(“Mean...”, “radius=2 stack”);
run(“Square”,”stack”); // squaring the mean stack
imageCalculator(“Divide create 32-bit stack”, “mean.tif”,”var.tif”); // this yields (mean^2)/var
rename(s_LSC);
run(“Brightness/Contrast...”);
setMinAndMax(0, 600);
selectWindow(s_LSC);
run(“Z Project...”, “start=1 stop=“+nSlices+” projection=[Average Intensity]”);
rename(s_mLSC);
run(“Brightness/Contrast...”);
setMinAndMax(0, 600);
selectWindow(“var.tif”);
close();
selectWindow(“mean.tif”);
close();
selectWindow(s_mLSC);
saveAs(“tiff”);
}
The macro “percent_difference” can be used to calculate the percent change relative to a baseline image. The utility of this macro requires that the images be precisely registered. Misalignment renders the images unusable. We use this routine to visualize acute changes in blood flow (baseline and the acute phase after occlusion, ~1 hour). It is very difficult to realign images for comparison at 24 hours.
macro “percent_difference” {
requires(“1.34m”);
title = “percent_difference”;
//Open relevant files
base=File.openDialog(“Selectbaseline”);
post=File.openDialog(“Selectpost-lesionfile”);
base=File.getName(base);
post=File.getName(post);
open(base);
open(post);
//calculate the difference
imageCalculator(“Subtract create 32-bit”, post, base);
rename(“difference.tif”);
//divide difference by the baseline image
imageCalculator(“Divide create 32-bit”, “difference.tif”, base);
//emphasize relative decreases
setMinAndMax(−1,0);
//use color lut “fire” to display
run(“Fire”);
//close unnecessary windows
selectWindow(base);
close();
selectWindow(post);
close();
selectWindow(“difference.tif”);
close();
//save image
rename(“pdiff -” + base + “ -” + post + “.tif”);
saveAs(“tiff”);
}
V. METHODS
All procedures with animals must be approved by the local Animal Care and Use Committee (ACUC). These procedures were approved by the University of Miami IACUC. Your local ACUC may require modifications to these procedures.
Vessel painting
The vessel painting protocol enables rapid visualization of the architecture of pial arteries. This allows the characterization of the impact of transgenic or pharmacological pretreatments on the structural components underlying collateral flow. Our approach is modified from Li et al [10] to optimize cerebral blood vessel labeling. For unknown reasons, veins and venules of the cerebral cortex are not strongly labeled compared to the arterial vasculature. This is advantageous for our goals because it simplifies the analysis (i.e., researchers do not need to be trained to differentiate arteries and arterioles from veins and venules).
As shown in Figure 1, the perfusion device is assembled with two three-way stopcocks, one one-way stopcock, two 50-ml pressurized tubes, one 10-ml syringe and a beveled 27-gauge tube (cut from a 27 gauge Luer stub adapter). First, connect all stopcocks in series and then the beveled 27-gauge tube to the outflow port of the stopcocks. Load tubes with 50 ml of PBS, 50 ml of fixative (4% paraformaldehydein PBS), respectively, and the syringe with DiI solution (5 ml for a mouse, 10 ml for a rat). Connect the tube with fixative to the first inflow port, DiI syringe to the second, and PBS tube to the last inflow port. Connect pressure tank to tubes, and pressurize system to 100 mmHg. Inject liquids starting from fixative, then DiI, then PBS until there is no air in the line. Keep assembly under room lighting.
Figure 1.

Apparatus for reliable vessel painting of cerebral arteries and arterioles. (A) General arrangement of components. (B) The stopcock arrangement is shown. The DiI syringe pump line connects to the middle stopcock. (C) Schematic of the apparatus.
It is essential to make sure that no air is trapped in the system or the syringe before proceeding to perfusion. Once in the circulatory system of the mouse, air bubbles will block blood vessels, resulting in poor perfusion.
Mice are sacrificed using an overdose of isofluorane. When breathing stops, the chest cavity is opened and a bolus injection of heparin (2000 units/Kg) and sodium nitroprusside (SNP, 0.75 mg/Kg) is given through the left atrium. Heparin inhibits clotting during the perfusion and SNP serves as a vasodilator to improve cortical vessel labeling. The animal is then cardiac-perfused using the pressurized system described above. Insert the beveled 27-gauge tube into the left atrium and secure with a vessel clamp. First the phosphate buffer solution (PBS) is perfused at 100mmHg to flush blood from the cerebrovascular system, then the DiI-sucrose-PBS mixture is perfused to label the vasculature (at up to 2 mL/minute with the syringe pump) and finally 4% cis-paraformaldehyde in PBS (PB-F) is perfused at 100 mmHg to fix the tissue. After perfusion, the brain is carefully removed from the skull and placed in PB-F for at least overnight.
Fixed brains are imaged at multiple image planes at 5× magnification on an inverted fluorescence microscope (IX-50, Olympus America, Miami, Florida), using a Spot Jr. camera and software (Diagnostic Instruments, Inc., Sterling Heights, Michigan). Images are subsequently stitched together to create a montage using ImageJ software (NIH) and PowerPoint (Microsoft). In the Notes section, we present our results using the vessel painting technique.
Troubleshooting: Incomplete vessel painting: If the DiI solution is not fully dissolved, vessel painting will be incomplete. Follow the published procedures for preparing this solution [10]. It is also possible that leakage around the cardiac puncture could limit perfusion. A tight seal is necessary. Additional troubleshooting tips are available in the original protocol. We found that our modifications to this published protocol are required for reliable painting of the cerebral vasculature.
Please note that a flow chart of the following laser occlusion procedure is shown in Figure 4.
Figure 4.

Flow chart of procedures. Note that the diamond indicates a decision point. If there is no occlusion, repeat the laser occlusion procedure to improve targeting. Alternatively, it may be necessary to thin the skull more.
Femoral artery and vein catheter placement (Modified from [11])
For adult and aged mice, we found femoral catheters to be the most reliable approach for drug delivery (venous line), and convenient for the monitoring of blood pressure and sampling blood gases (arterial line). A major drawback to femoral catheter placement is disruption of blood flow to the limb distal to the catheter and nerve damage. However, consistent with Mattson’s report [11], this approach appears to limit both of these factors. In a separate series of experiments with one week survival using six month old C57BL/6Jmice, no behavioral deficits were detected using the grid walk/foot placement test (Morales and DeFazio, unpublished). In the current study with 24-hour survival, we detected no evidence of hind limb ischemia in either the C57BL/6Jor BALB/c strains of mice. Nevertheless, we performed this surgery on the ipsilateral limb to minimize possible interference with behavioral testing (not described in this protocol).
Catheters are assembled from 150 mm lengths of MRE-025 tubing. Under sterile conditions, the tubing is carefully pulled to an approximately 200 μm thickness using the heat from the tip of a hot soldering iron. With a fresh razor blade, this end is cut at 45° for easier insertion into the vessel. A sterile Luer stub adapter is inserted into the other end for attaching drug delivery syringes or the blood pressure monitor. The tubing fits securely on the adapter and does not require adhesive. Two catheters are filled with heparinized saline prior to the start of surgery. It is absolutely essential to ensure that there are no bubbles in the line.
The animal is weighed prior to anesthesia because the mouse body temperature drops very rapidly. The mouse is anesthetized using an induction box (2% isoflurane), then placed on the warming pad of the FST temperature controller with the nose in the anesthesia cone within the isoflurane vacuum recapture tube. Lubricating eye drops (AKWA) are applied at this stage. The rectal probe is lubricated with sterile mineral oil, inserted, and secured with adhesive tape to the tail. Depending on the ambient temperature, we often place the ceramic heat lamp over the animal to prevent a drop in body temperature while the heating pad stabilizes. Care should be taken to minimize the level of isoflurane, but to also maintain full anesthesia as tested by response to paw pinch.
To avoid stressing the animal we secure only the limb targeted for surgery (as opposed to taping down all four limbs). We use a small animal shaver to clear the hair from the knee to the inner thigh. Betadine is applied to sterilize the area. An incision is made from the knee to the fat pad, thus exposing the nerve (white ribbon), the femoral artery (bright red, thick-walled) and the vein (darker red, thin-walled) from right to left on the animal’s right leg. Under high magnification the connective tissue is carefully removed between the vessels. This preserves the connective tissue around the nerve, allowing it to be manipulated without damage. The nerve is carefully separated from the artery by means of fine forceps along the entire length. Next, the artery is carefully separated from the vein. Finally, the femoral vein is gently separated from the muscle so that three 25 mm long sutures can be placed between the vein and the rest of the limb. The first suture should be placed distally, the next about midway between the knee and the fat pad, and the last about two millimeters proximal to the second suture. A microvessel clamp is placed, clamping the vein adjacent to the fat pad, and the most distal suture is gently tied off, eliminating most blood flow to the vessel. Major venules may still flow into the vessel after this procedure and sometimes it may be necessary to separate these from the vein using a fine forceps to limit excessive leakage of blood, which can interfere with catheter placement. This can be accomplished by firmly pinching a venule with two pairs of fine forceps near the entry point with the main vein and gently pulling them apart. Firmly pinching the venule with a fine forceps usually results in their permanent occlusion.
An incision is made in the vein with fine iridectomy scissors at a maximally acute angle of incidence (10–20° from parallel), while taking great care to not completely sever the vein (50–75% is usually sufficient). This creates the largest possible opening for catheter placement. At this stage, we found that a drop of lidocaine can dilate the vein if it has constricted from damage during the procedure. The catheter is inserted while holding the top flap of the cut vein. The catheter is gently inserted up to the microvessel clip and the middle suture gently tied. The clip is removed and the catheter inserted past the region that was clipped and at least 1 mm under the fat pad, and then the third suture is tied. The catheter is secured by tying the first (most distal) suture around it and by a tiny drop of cyanoacrylic adhesive at the knee. All sutures are loosened and retied with the minimum tension required to secure the catheter. This maximizes flow through the catheter. Blood should be easy to draw back and forth using the syringe. A small amount of heparinized saline (~50 μL) is injected into the vessel to minimize clot formation.
Without disturbing the venous line, the femoral artery is carefully freed from the connective tissue. Repeat the venous catheter procedure for placing the arterial line catheter. As before, a drop of lidocaine may be helpful for dilating the vessel after vasoconstriction from damage caused by its separation from the connective tissue. The arterial line should show pulsatility at the interface between blood and heparinized saline. If not, the sutures should be loosened and then retied more gently.
After verifying that there are no bubbles in either line, and that both lines flow freely, both catheters are secured to the lower limb with adhesive tape. With great care regarding the catheters, the mouse can now be transitioned to the stereotaxic device. Next, the arterial line is connected to the blood pressure monitor and electrocardiogram leads can now be attached.
Troubleshooting: Poor blood pressure recordings, catheter clogging and/or resistance: any stray air bubbles in the system can lead to failed catheter placement, collapse of the vessel, and/or death of the animal. When placing the catheter in the vessel, be sure to put positive pressure on the syringe to force out any air in the tip of the catheter. If a bubble inadvertently enters the vessel, it is sometimes possible to pull it back out very slowly with minimal suction without collapsing the vessel. Catheters may be replaced in the opposite leg if behavioral analyses are not planned.
Skull preparation
After mounting on the stereotaxic device, ensure that both catheters are flowing freely, that there are no air bubbles in the line, that the blood pressure is normal (mean arterial blood pressure: 90 ± 10 mmHg), and the body temperature is 37°C. Verify anesthesia levels with a toe pinch. Place the animal’s head between the ear bars and gently secure the head. During this stabilization period, shave the scalp between the ears down to near the tip of the nose. Sterilize the scalp with betadine and make an incision along the midline from between the ears to near the tip of the nose. Carefully separate the scalp and associated connective tissue from the skull. Insert the needle temperature probe into the ipsilateral temporalis muscle and move the ceramic heating element (connected to the temperature regulating the needle probe) close to the animal’s head (~150 mm). Carefully monitor brain temperature during the stabilization period to avoid both hypothermia and hyperthermia. Owing to the small size of the animal, when the scalp is open the brain temperature can plummet to <32°C within a few minutes--even with excellent control of rectal temperature at 37°C. Confirm that the animal’s eyes are moist. Reapply eye ointment if necessary.
As soon as the scalp is open, place a small amount of sterilized mineral oil on the skull to prevent it from drying out, and also to present a smoother optical surface to the laser beam. The wet skull is fairly transparent (pial arteries can be seen) even in one year old mice; however, the dry skull is completely opaque and very difficult to re-moisturize. Thin layers of connective tissue exist over the skull and each of these must be carefully removed with fine forceps; however, avoid scratching the skull as this can lead to bleeding that is difficult to stop. It may be necessary to gently “massage” the oil on the skull with a cotton applicator to moisturize opaque regions.
Troubleshooting: Persistent opaque regions may require removal of extraneous connective tissue. Gently scrape the surface with a fine forceps to see if additional layers are present. A minimal amount of mineral oil should be used, but complete coverage is necessary for long-duration recordings.
Thinning the skull
We use the approach of [12], with the exception that we only thin the region over the distal MCA branch of interest (approximately 1mm × 2 mm). Yang’s approach is critical because it ensures optimal thinning of the skull. Briefly, a microdrill and 1mm carbide ball bit are used to gently thin the skull over the region of interest. Be careful to cool the skull with mineral oil during this procedure. Once the outer layer of the skull is removed, the spongy bone layer can be removed with gently scraping using a dull forceps. The remaining layer can be thinned more with the carbide bit, with great care taken not to break through. The pial arteries should appear very clear through the remaining bone. Be sure to clean the bone fragments from the skull as these will interfere with laser speckle imaging.
Troubleshooting: Many useful tips are provided in reference [12]. Be very careful when thinning the last layer as small tears in the skull can compromise recordings of cerebral blood flow. We prefer the thin skull approach; however, it should be noted that many groups use a craniotomy, especially when using rats. The main drawbacks to large craniotomies include the loss of intracranial pressure and difficulties associated with long-term repeated imaging sessions.
Baseline laser speckle imaging
At this stage, verify the absence of bubbles in the catheters, body and brain temperature, heart rate and blood pressure, and depth of anesthesia. Position the laser speckle camera (QICAM-IR Fast 1394) so that the field of view consists of the hemisphere of interest plus a few millimeters of the contralateral cortex. The same magnification should be used for all experiments because the speckle contrast depends on the pixel size. Once the field of view is established, confirm that the 785 nm laser intensity is neither too weak (no signal detected by camera) nor too strong (the camera is saturated). If necessary, adjust the position of the 785 nm laser to vary the power and uniformity of illumination. The infrared camera is necessary for this step, as the human eye is not very sensitive to 785 nm. Use the image acquisition software to collect 300 images, 7 msec exposure time, minimum interval between frames. Using the provided ImageJ routines, run the “transform” macro to process the 300 frames. This macro has the following steps: make the image stack 32 bits, duplicate the raw data, apply a 2×2 mean filter to the raw data and square the result, apply a 2×2 variance filter on the copy of the raw data, divide the square of the mean-filtered images by the variance-filtered images, and average all the frames (to obtain, for example, Figure 6A). If the resulting image is blurry, confirm that the mouse skull is stable and free from macroscopic movements associated with breathing. It may be necessary to tighten the stereotaxic device ear bars and/or adjust the distance of the camera from the specimen to refocus.
Figure 6.

Laser speckle imaging of cerebral blood flow in the BALB/c mouse. We use the inverse of the squared image contrast(p=μ2/σ2, where p is the new pixel value, μ is the local mean intensity and σ is the local standard deviation of the intensity, each using a 2 pixel × 2 pixel filter) to display cerebral blood flow. Using this scheme, high flow areas appear bright (arteries and veins) and low flow regions are dark. (A) In this baseline image, the artery of interest is indicated by the white arrow. (B) Immediately after successful laser occlusion, no flow is detected distal to the clot. (C and D) No flow was detected at one hour or 24 hours after occlusion, thus demonstrating the stability of the clot and the absence of collateral flow. The image calibration is unit-less (μ2/σ2).
When images of adequate quality (i.e. focus and clarity) are acquired, verify the absence of bubbles in the catheters, body and brain temperature, heart rate and blood pressure, and depth of anesthesia. Take three sets of 300 images to establish a baseline. Withdraw 55 μL of blood for blood gas analysis (values for this study are reported in Table 1).
Table 1. Physiological parameters.
Blood gas measurements obtained prior to arterial occlusion. 55–100 μL of blood was withdrawn from the arterial line and tested with a blood gas analyzer (ABL800, Radiometer, Copenhagen). Prior to initiating an experimental series, it may be necessary to adjust anesthesia, nitrous oxide, and oxygen levels to optimize blood gas levels in a separate set of animals with repeated measures of blood gases. This is generally not possible during an experiment due to the small blood volume of the mouse.
| Mouse strain: | BALB/c | C57BL/6J |
|---|---|---|
| Mass (g) | 30.08 ± 0.87 | 29.07 ± 0.89 |
| MABP (mmHg) | 90.8 ± 2.7 | 87.9 ± 3.2 |
| pH | 7.315 ± 0.018 | 7.337 ± 0.018 |
| pCO2 | 45.8 ± 3.9 | 42.6 ± 2.8 |
| pO2 | 147 ± 14 | 143 ± 23 |
| N = | 8 | 7 |
Troubleshooting:
Blurry laser speckle images: Be sure to secure the camera relative to the stereotaxic device. Vibrations are a major source of blurriness. Focusing the camera can also be problematic and may require iterative laser speckle contrast imaging and refocusing to obtain the best focal plane. It may also be necessary to rotate either the mouse or the camera to obtain the best imaging plane.
Patchy laser speckle images: It is necessary the skull be completely smooth and free from debris. These will appear as dark or bright blotches in the laser speckle contrast images. Many of these can be removed with gentle scraping or very light milling with the microdrill.
Abnormal or variable laser speckle images: Unstable anesthesia or other signs of animal distress may result in variable laser speckle contrast images. Be sure to monitor heart rate and blood pressure to ensure these are stable during recordings.
Quantum dot-facilitated laser occlusion
Please see the Notes section below where we discuss the role of quantum dots in photothrombosis.
To initiate quantum dot-facilitated occlusion of the targeted distal MCA branch: Remove the top cylindrical lens, set the laser power to about 200 μW. With a single cylindrical lens, the Gaussian beam from the laser is transformed into a line. Focus the line on the surface of the skull. Use the beam positioner to place the beam over the artery of interest. Figure 5A shows a low magnification image of vessel painting and a distal MCA branch. Align the beam along the vessel as in Figure 5B (higher magnification) and refocus. Reposition the second cylindrical lens and rotate until a short line appears. Adjust the height of the second cylindrical lens to set the length (100–150 μm) of the irradiating beam (similar to Figure 5B). Inject half the dose of the quantum dots. Increase the 532nm laser power to ~5 mW and view the brilliant red fluorescence emission of the quantum dots through the eyepiece and a 580nm long pass filter. Fluorescence emission from the quantum dots allows one to precisely focus the beam within the vessel and is crucial for the success of the method. The emission should appear as a sharp red line; if not, repeat the fine tuning of the focal point, orientation and length of the beam. Do not proceed beyond this point without the laser beam sharply focused within the vessel lumen as evidenced by the red emission of the quantum dots between the arterial borders.
Figure 5.

Targeting the distal MCA branch. (A) Low power and (B) high power images of the vessel of interest indicating the site to be targeted with the laser line beam (red line in (B)).
Ensure that there is no bleeding on the skull and that thinning the skull has removed all calvarium vessels that can interfere with the pial artery irradiation. Minor bleeding from the skull usually desists after a few minutes; we have rarely encountered persistent bleeding beyond 5 minutes. After quantum dot injection, calvarium vessels will appear as very bright, but fine, vessels within the skull. Repeat the thinning process if these vessels appear. With the shutter closed, set the laser power to 40 mW. Set the shutter controller for repeated 600 msec exposures at 1 sec intervals. Use the image acquisition software to continuously acquire 300 frames at 200 msec intervals. Activate the shutter to begin the laser irradiation. Inject the remainder of the quantum dot dose and flush the catheter with 100 μL saline. Deliver 20 pulses at 40 mW after the full quantum dot dosage. This provides a peak (average) intensity of 800 (160) W/cm2. Process the image files using the ImageJ macros to determine if occlusion occurred. If not, turn the laser power down to 5 mW and repeat the alignment procedure, paying particular attention to the distance of the first (closest to the animal) cylindrical lens. This lens sets the focal plane of the system. If all these parameters have been optimized, it may be necessary to thin the skull further.
After occlusion, irradiation with white light under high magnification is used to directly visualize the clot, and most importantly the lack of red blood cells. Successful clots are pale, presumably consisting of platelets, with few to no red blood cells present in the area of occlusion. At either end of the clot, red blood cells will cap the pale portion of the clot forwards (in the distal direction) to the next branch of the artery and backwards (proximal direction) to the previous branch.
We routinely monitor cerebral blood flow for 45–90 minutes after laser occlusion.
Troubleshooting: Failure of laser occlusion: In our experience, the two most common failures are poor targeting of the vessel and an inadequately thinned skull. It is absolutely crucial to the success of this procedure that the laser line be focused on the interior of the vessel in three dimensions (i.e. depth as well as the x-y plane). This is refined under low laser power after the quantum dot injection. A sharp line of bright red fluorescence should appear within the vessel. Optimal thinning of the skull requires much practice and patience. It is possible to repeat the thinning process and laser occlusion 2–3 times without seriously confounding the experiment, provided that the laser is always confined to the interior of the vessel. At maximum power (40 mW) the laser line can rapidly occlude microvessels and induce micro-infarctions beyond the targeted distal MCA branch. It is essential to refine the position of the beam with great care prior to increasing laser power.
Awakening the animal
We allow the animals to survive for 1–7 days after injury. It is necessary to carefully close the scalp with minimal amounts of bioadhesive and to carefully remove the catheters, tie off the vein and artery, and close the leg wound (also with bioadhesive). We provide buprenorphine (0.05 mg/kg BID) to minimize the pain and discomfort of the mice. Keep the animal warm for 24 hours. We accomplish this using incubator set to 30°C.
For repeated monitoring over the long term, anesthetize the animal for each session as described above and mount in the stereotaxic device. Reopen the scalp and clean the skull with sterile mineral oil and a cotton-tipped applicator. We have used laser speckle imaging at 4 hours, 24 hours, and 3 days in a subset of animals. After imaging, close the scalp with a minimum amount of bioadhesive (being careful not to get any on the skull) and a drop of xylocaine. We provide buprenorphine (0.05 mg/kg BID) after every imaging session. Laser speckle images during baseline, one minute post-occlusion, one hour post-occlusion and one day after injury are shown in Figures 6-9.
Figure 9.

Side-by-side comparison of laser speckle contrast image from BALB/c and C57BL/6J (respectively, left and right panels). The white arrows indicate the target of the occlusion. Note the modest restoration of blood flow within the targeted artery in the C57BL/6J mouse, apparent in (C) and (D).
VI. NOTES
To validate the vessel painting approach, we painted the cerebral vessels of mice from two strains, BALB/c and C57BL/6J, known to have major differences in collateral number [6]. Our results are very similar to the more expensive and technically challenging approach of vascular casting. The images in Figure 2 are a montage of 6–10 images obtained at 5× magnification. ACA and MCA pial arteries are traced in PowerPoint to produce the green and black lines in Figure 2C-F. The red lines indicate communicating vessels (anastomoses) between the ACA and MCA arteries. It is apparent from these images that a striking difference in ACA-MCA anastomoses persists at 6 months of age as previously described in 3 month-old mice [6]. In Figure 3, the ACA-MCA territory is shown at higher magnification and individual anastomoses are indicated with black arrows. We counted the total number of anastomoses on the visible pial surface in one hemisphere, including: ACA-MCA, ACA-ACA, MCA-MCA, posterior cerebral artery (PCA)-MCA, PCA-ACA, and PCA-PCA anastomoses. Quantification of results from five BALB/c and six C57BL/6Jmice are shown in Figure 3C. Although much lower in number than the C57BL/6J, we detected at least 2 ACA-MCA anastomoses in every BALB/c mouse at six months of age. This is greater than the number previously reported for three month old BALB/c mice (average <1, [6]). This suggests that collateral development continues into adulthood in these mice.
Figure 2.

Vessel painting reveals strain-specific variation in pial vessel architecture at six months of age. (A) Ventral view of a BALB/c mouse brain after vessel painting. (B) Dorsal view of the cortical pial vessels. (C & D) Tracing the major ACA (green) and MCA (black) vessels and their connections (red) in the BALB/c mouse. (E & F) Increased collateral density in C57BL/6J mice.
Figure 3.

ACA-MCA anastomoses in C57BL/6J and BALB/c mice at six months of age. (A) C57BL/6J mice show robust interconnections (anastomoses) between the MCA and ACA vessels (indicated by black arrows). (B) BALB/c mice show consistently fewer collaterals. (C) Quantification of the number of collaterals. Both the number of ACA-MCA anastomoses and the total number of anastomoses were significantly decreased in BALB/c mice (* p<0.01 two-tailed heteroscedastic t-test, n=6 C57BL/6J and 5 BALB/c mice).
Figures 6 and 8 show representative laser speckle images from BALB/c and C57BL/6Jmice. Quantification of the laser speckle contrast images is shown in Figure 7. This is obtained with the “percent_difference” macro provided above. This degree of quantification can be difficult owing to alignment issues if the mouse skull moves during the experiment or after repositioning the mouse 24 hours after the initial imaging session. In this case, consistent regions of interest can be defined either within the vessel or in the parenchyma in both images to enable quantification of long-term changes in perfusion.
Figure 8.
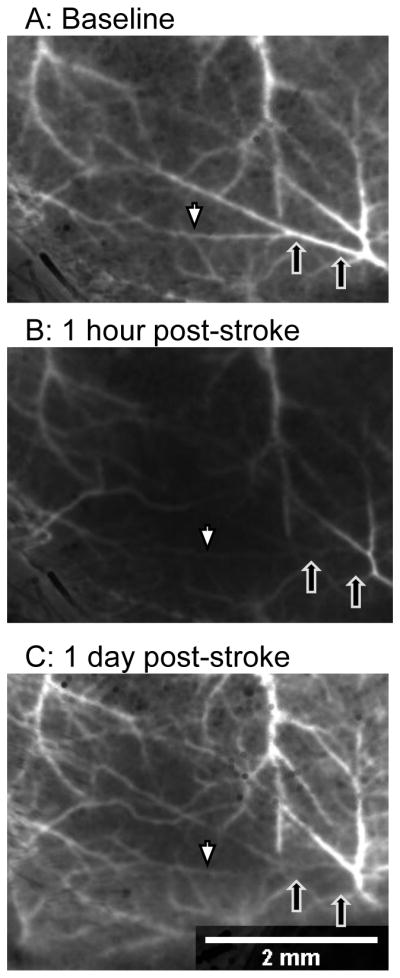
Retrograde flow after laser occlusion in a C57BL/6J mouse. (A) Baseline image before occlusion; black arrows indicate the extent of the clot after laser occlusion. (B) Shortly after occlusion, the laser speckle signal decreases within the targeted artery distal to the site of occlusion (white arrow is distal, black arrows indicate site of occlusion). (C) At 24 hours, retrograde perfusion of the distal artery branches has increased (white arrow); however, the clot persisted as a dark signal in the laser speckle image and by direct visualization (black arrows).
Figure 7.

Quantification of laser speckle imaging using the percent_difference macro (same mouse as Figure 6). This routine subtracts the baseline laser speckle contrast image from the image of interest then divides by the baseline to produce an image based on the percent difference. The image is scaled from 0 to −100% change and is coded with the “fire” lookup table in ImageJ. Not all images can be analyzed in this way owing to movement artifacts resulting in misalignment of the images.
In both strains, clots were persistent for 24 hours. Laser speckle images revealed that BALB/c mice showed little or no flow in the occluded territory (Figures 6 and 8). However, as shown in Figure 8, retrograde perfusion was detected with laser speckle imaging (indicated by the white arrow). We use the term retrograde because the clot is readily apparent under direct visualization and laser speckle shows no signal in the area of the clot (black arrows). A side-by-side comparison of the pseudo-colored laser speckle contrast images is shown in Figure 9. Pseudo-color can bring out subtle differences and renders the comparison of retrograde flow more dramatic (i.e. Figure 9D).
We next examined the neuropathological impact of occlusion of a distal branch of the MCA in these two mouse strains. After laser occlusion, persistent clots were formed in both strains as verified by laser speckle imaging at 24 hours and direct visualization. To characterize infarction, animals were perfusion fixed with formalin:acetic acid:methanol (FAM), the brains removed and paraffin-embedded using standard procedures (e.g., [13]). We used hematoxylin and eosin staining of 10 μm sections taken every 100 μm between lambda and bregma. We quantified infarct volume by measuring the area of infarction on each section and multiplying by the distance between sections. Very minimal infarction was observed in the C57BL/6Jmice and only superficially at the site of irradiation. In contrast, >2 mm3 infarction was observed in 4 of 5 BALB/c mice tested (Figure 10Cand D). Thus, collateral flow determines infarct volume even at the level of distal branches of the middle cerebral artery. This suggests that a single collateral may be sufficient to rescue the territory of a distal MCA branch (see schematic in Figure 10A). This is supported by the observation that one of the BALB/c had an infarction volume indistinguishable from the C57BL/6Jgroup, suggesting that the occluded MCA artery was also fed by an ACA anastomosis.
Figure 10.

Schematic illustrating the differences between C57Bl/6J and BALB/c collaterals and their impact on post-occlusion blood flow in the distal MCA branch. (C) Hematoxylin and eosin staining from the BALB/c mouse. Minimal infarction was observed in the C57BL/6J and was constrained to the site of irradiation. (D) Quantification of infarct volume (* p<0.02 two-tailed heteroscedastic t-test, N=6 C57BL/6J and 4 BALB/c mice). One BALB/c mouse showed minimal infarction and was excluded. Inclusion of this mouse decreased significance to p<0.04.
Future studies will combine these approaches with in vivo two-photon microscopy and in vivo vessel painting techniques currently under development.
The non-traditional role of quantum dots in photothrombosis
The purpose of photothrombosis is to induce endothelial damage by means of the most effective photoproduct known, singlet molecular oxygen. This results in rapid adherence and degranulation of the blood’s first responders to injury - platelets. Aggregation of new platelets then occurs in a self-sensitized fashion as a nonlinear function of beam intensity [14]. One very curious aspect of our observations is that the standard photothrombosis dyes erythrosin B and rose bengal were unable to induce stable occlusion in distal MCA branches of the mouse (DeFazio and Watson, unpublished observations). Given the published low quantum yield for singlet oxygen generation by quantum dots and their inversely corresponding brightness as fluorescent indicators [15], we can only offer that quantum dots are operationally much more effective. One drawback of rose bengal and erythrosin B is that they will bind to any membrane, and thus can photooxidize platelets, which will not then respond to normal stimuli [16]. If, however, quantum dots do not photooxidize platelets during irradiation in the relatively low-flowing pial arteries, then the effective density of reactive platelets will be increased.
The lack of membrane binding offers a potential explanation for the efficacy of Qtracker 655 non-targeted quantum dots in mediating laser occlusion of distal MCA arteries. We remark that quantum dots have not been used before to induce photothrombosis; in fact, our original intention was to use them to simply leverage the excellent fluorescence properties of these agents to delineate accurately the desired pial artery under the skull (5 mW setting as above), but we noticed while testing various laser powers that thrombosis was occurring, with stable occlusion observed at 40 mW. To summarize, we believe the advantage of Qtracker 655 non-targeted quantum dots to be twofold in this context: (1) their fluorescence properties allow precise positioning of the excitation beam, and (2) the lack of membrane binding may limit damage to platelets during photothrombosis.
Acknowledgments
Supported by the University of Miami Scientific Awards Committee (RAD) and NIH grants NS034773 and NS045676 (MAP).
VII. REFERENCES
- 1.Bang OY, Saver JL, Buck BH, Alger JR, Starkman S, Ovbiagele B, et al. Impact of collateral flow on tissue fate in acute ischaemic stroke. J Neurol Neurosurg Psychiatry. 2008 Jun;79(6):625–9. doi: 10.1136/jnnp.2007.132100. [DOI] [PMC free article] [PubMed] [Google Scholar]
- 2.Wei L, Erinjeri JP, Rovainen CM, Woolsey TA. Collateral growth and angiogenesis around cortical stroke. Stroke. 2001 Sep;32(9):2179–84. doi: 10.1161/hs0901.094282. [DOI] [PubMed] [Google Scholar]
- 3.Majid A, He YY, Gidday JM, Kaplan SS, Gonzales ER, Park TS, et al. Differences in vulnerability to permanent focal cerebral ischemia among 3 common mouse strains. Stroke. 2000 Nov;31(11):2707–14. doi: 10.1161/01.str.31.11.2707. [DOI] [PubMed] [Google Scholar]
- 4.Keum S, Marchuk DA. A locus mapping to mouse chromosome 7 determines infarct volume in a mouse model of ischemic stroke. Circ Cardiovasc Genet. 2009 Dec;2(6):591–8. doi: 10.1161/CIRCGENETICS.109.883231. [DOI] [PMC free article] [PubMed] [Google Scholar]
- 5.Chalothorn D, Faber JE. Formation and maturation of the native cerebral collateral circulation. J Mol Cell Cardiol. 2010 Mar 25; doi: 10.1016/j.yjmcc.2010.03.014. [DOI] [PMC free article] [PubMed] [Google Scholar]
- 6.Zhang H, Prabhakar P, Sealock R, Faber JE. Wide genetic variation in the native pial collateral circulation is a major determinant of variation in severity of stroke. J Cereb Blood Flow Metab. 2010 May;30(5):923–34. doi: 10.1038/jcbfm.2010.10. [DOI] [PMC free article] [PubMed] [Google Scholar]
- 7.Chalothorn D, Zhang H, Smith JE, Edwards JC, Faber JE. Chloride intracellular channel-4 is a determinant of native collateral formation in skeletal muscle and brain. Circ Res. 2009 Jul 2;105(1):89–98. doi: 10.1161/CIRCRESAHA.109.197145. [DOI] [PMC free article] [PubMed] [Google Scholar]
- 8.Clayton JA, Chalothorn D, Faber JE. Vascular endothelial growth factor-A specifies formation of native collaterals and regulates collateral growth in ischemia. Circ Res. 2008 Oct 24;103(9):1027–36. doi: 10.1161/CIRCRESAHA.108.181115. [DOI] [PMC free article] [PubMed] [Google Scholar]
- 9.Chalothorn D, Clayton JA, Zhang H, Pomp D, Faber JE. Collateral density, remodeling, and VEGF-A expression differ widely between mouse strains. Physiol Genomics. 2007 Jul 18;30(2):179–91. doi: 10.1152/physiolgenomics.00047.2007. [DOI] [PubMed] [Google Scholar]
- 10.Li Y, Song Y, Zhao L, Gaidosh G, Laties AM, Wen R. Direct labeling and visualization of blood vessels with lipophilic carbocyanine dye DiI. Nat Protoc. 2008;3(11):1703–8. doi: 10.1038/nprot.2008.172. [DOI] [PMC free article] [PubMed] [Google Scholar]
- 11.Mattson DL. Long-term measurement of arterial blood pressure in conscious mice. Am J Physiol. 1998 Feb;274(2 Pt 2):R564–70. doi: 10.1152/ajpregu.1998.274.2.R564. [DOI] [PubMed] [Google Scholar]
- 12.Yang G, Pan F, Parkhurst CN, Grutzendler J, Gan WB. Thinned-skull cranial window technique for long-term imaging of the cortex in live mice. Nat Protoc. 2010;5(2):201–8. doi: 10.1038/nprot.2009.222. [DOI] [PMC free article] [PubMed] [Google Scholar]
- 13.Dave KR, DeFazio RA, Raval AP, Dashkin O, Saul I, Iceman KE, et al. Protein kinase C epsilon activation delays neuronal depolarization during cardiac arrest in the euthermic arctic ground squirrel. J Neurochem. 2009 Aug;110(4):1170–9. doi: 10.1111/j.1471-4159.2009.06196.x. [DOI] [PMC free article] [PubMed] [Google Scholar]
- 14.Watson BD, Dietrich WD, Prado R, Ginsberg MD. Argon laser-induced arterial photothrombosis. Characterization and possible application to therapy of arteriovenous malformations. J Neurosurg. 1987 May;66(5):748–54. doi: 10.3171/jns.1987.66.5.0748. [DOI] [PubMed] [Google Scholar]
- 15.Samia AC, Chen X, Burda C. Semiconductor quantum dots for photodynamic therapy. J Am Chem Soc. 2003 Dec 24;125(51):15736–7. doi: 10.1021/ja0386905. [DOI] [PubMed] [Google Scholar]
- 16.Zieve PD, Solomon HM, Krevans JR. The effect of hematoporphyrin and light on human platelets. I. Morphologic, functional, and biochemical changes. J Cell Physiol. 1966 Apr;67(2):271–9. doi: 10.1002/jcp.1040670207. [DOI] [PubMed] [Google Scholar]