

Abstract
Retrograde axonal transport of cellular signals driven by dynein is vital for neuronal survival. Mouse models with defects in the retrograde transport machinery, including the Loa mouse (point mutation in dynein) and the Tgdynamitin mouse (overexpression of dynamitin), exhibit mild neurodegenerative disease. Transport defects have also been observed in more rapidly progressive neurodegeneration, such as that observed in the SOD1G93A transgenic mouse model for familial amyotrophic lateral sclerosis (ALS). Here, we test the hypothesis that alterations in retrograde signaling lead to neurodegeneration. In vivo, in vitro, and live-cell imaging motility assays show misregulation of transport and inhibition of retrograde signaling in the SOD1G93A model. However, similar inhibition is also seen in the Loa and Tgdynamitin mouse models. Thus, slowing of retrograde signaling leads only to mild degeneration and cannot explain ALS etiology. To further pursue this question, we used a proteomics approach to investigate dynein-associated retrograde signaling. These data indicate a significant decrease in retrograde survival factors, including P-Trk (phospho-Trk) and P-Erk1/2, and an increase in retrograde stress factor signaling, including P-JNK (phosphorylated c-Jun N-terminal kinase), caspase-8, and p75NTR cleavage fragment in the SOD1G93A model; similar changes are not seen in the Loa mouse. Cocultures of motor neurons and glia expressing mutant SOD1 (mSOD1) in compartmentalized chambers indicate that inhibition of retrograde stress signaling is sufficient to block activation of cellular stress pathways and to rescue motor neurons from mSOD1-induced toxicity. Hence, a shift from survival-promoting to death-promoting retrograde signaling may be key to the rapid onset of neurodegeneration seen in ALS.
Introduction
Neurons are highly polarized cells, with extended processes that depend on active intracellular transport. The molecular motor kinesin drives anterograde transport from the cell body outward along the axon. The dynein/dynactin complex drives retrograde axonal transport, moving signaling molecules like neurotrophins from cell periphery to cell body.
Neurotrophins released by postsynaptic targets promote neuronal survival by activating Trk receptors (Chao, 2003). Activated Trk receptors, together with effector molecules like Erk1/2 and Erk5, are retrogradely transported along the axon to the cell body to evoke changes in gene expression required for cell survival (Yano et al., 2001; Delcroix et al., 2003; Ye et al., 2003; Heerssen et al., 2004). Neurotrophins can also bind to the p75 neurotrophin receptor (p75NTR) to mediate retrograde signaling. The activation of p75NTR may promote survival or trigger death, depending on differential interactions with ligands and coreceptors (Lee et al., 2001; Chao, 2003; Barker, 2004; Lu et al., 2005); cleavage of p75NTR may also cause cell death (Lee et al., 2001; Kenchappa et al., 2006). Both the Trk and p75NTR signaling pathways from cell periphery to cell body depend on the active transport of signaling endosomes by dynein (Delcroix et al., 2003; Heerssen et al., 2004; Deinhardt et al., 2006).
Defects in dynein function have been linked to neurodegeneration (Chevalier-Larsen and Holzbaur, 2006). Mice with either targeted disruption (LaMonte et al., 2002) or a specific mutation affecting dynein function (Hafezparast et al., 2003; Chen et al., 2007) display degeneration of motor and/or sensory neurons. In humans, an autosomal dominant mutation in the dynein activator dynactin results in slowly progressive motor neuron (MN) degeneration (Puls et al., 2003, 2005).
Axonal transport defects have also been suggested to contribute to the pathogenesis of more rapidly progressive neurodegenerative disease such as amyotrophic lateral sclerosis (ALS). Delays in slow axonal transport occur just before onset of clinical symptoms in a mouse model of familial ALS expressing mutant SOD1 (mSOD1) (Zhang et al., 1997; Williamson and Cleveland, 1999). However, defects in retrograde transport occur much earlier in disease pathogenesis (Kieran et al., 2005; Ligon et al., 2005). Accumulating data from other disease models also suggest that inhibition of axonal transport leads to neurodegeneration (Chevalier-Larsen and Holzbaur, 2006), presumably through inhibition of neurotrophic signaling.
Here, we investigate the relative contributions of the slowing of axonal transport and changes in retrograde signaling along the axon to the pathogenesis of neuronal degeneration. We find that impairment in the efficiency of retrograde neurotrophic factor transport is not sufficient to induce the pronounced neuronal loss seen in severe neurodegenerative diseases such as ALS. However, pronounced changes in dynein-associated cargo from survival-promoting to death-promoting signaling pathways are observed as an early event in neurodegeneration. Further, we demonstrate that inhibition of retrograde stress signaling is sufficient to inhibit activation of stress transcription factor and to rescue motor neurons from mSOD1-induced toxicity. Thus, a change in the nature of retrograde signaling may be key in the rapid onset of neurodegeneration seen in ALS.
Materials and Methods
Animals, models, and cell cultures.
SOD1G93A (B6SJL-TgN[SOD1G93A]1Gur) mice (Gurney et al., 1994) from Jackson Laboratories were maintained as hemizygotes in a B6SJL F1 background. wtSOD1 (B6SJL-TgN[SOD1]2Gur) mice were a kind gift from Dr. Piera Pasinelli. Loa/+ heterozygote mice (Hafezparast et al., 2003) were generously provided by Dr. Elizabeth Fisher (Institute of Neurology, University College London, UK) and maintained at the University of Pennsylvania. Dynamitin transgenic (M21) mice (Tgdynamitin) were described previously (LaMonte et al., 2002). For vesicle assays, GFP (green fluorescent protein)-dynamitin (M30) transgenic mice (Ross et al., 2006) were crossed with SOD1G93A mice. For all studies, littermates negative for transgene insertion or point mutation were used as age-matched controls. The Institutional Animal Care and Use Committee at the University of Pennsylvania approved all animal protocols.
Dorsal root ganglion (DRG) cultures from adult mice were dissociated with 100 U of papain followed by 1 mg/ml collagenase-II and 1.2 mg/ml dispase. The ganglia were then triturated in HBSS (10 mm glucose, and 5 mm HEPES; pH 7.35). Neurons were purified through 20% Percoll, plated on laminin, and grown in F12 medium.
Motor neurons were purified from Sprague Dawley rat embryos at embryonic day 14–15 (E14–15) by immunopanning (Henderson et al., 1993; Fryer et al., 1999). After 2 d in culture, coverslips with neurons were moved into dishes with glial cells and infected with herpes simplex virus (HSV) encoding either LacZ, wtSOD1, or the G85R mutant form of SOD1 (Neve et al., 1997). The cells were fixed 2 d later and immunostained. Analysis of the cultures by immunofluorescence indicated that >97% of infected neurons expressed SOD1 both in the soma and throughout the neuronal processes. For the compartmental cultures, dishes consisted of a Teflon divider (CAMP10, Tyler Research Instruments) seated with silicone grease (Dow Corning) into poly-l-lysine- and laminin-coated 35 mm Nunc tissue culture dishes. MNs were plated at 4 × 10⁴ cells in a 1.5-mm-wide center compartment. Axons and dendrites elongate across 1-mm-wide partitions to side compartments as described previously (Campenot, 1992). Motor neurons in the center chamber were maintained in neurobasal medium with 2% horse serum, 5% B27 (Invitrogen), 0.5 mm Glutamax (Invitrogen), 2-mercaptoethanol (50 μm, Invitrogen), 1% penicillin–streptomycin, 1 ng/ml CT-1 (cardiotrophin-1), GDNF (glial cell line-derived neurotrophic factor), CNTF (ciliary neurotrophic factor), BDNF (brain-derived neurotrophic factor), and 5 μm 5-fluoro-5′-deoxyuridine (Sigma). Medium in the side compartments was supplemented with 50 ng/ml BDNF to promote neurite outgrowth. After 2 weeks in culture, BDNF was reduced to 1 ng/ml throughout the experiments. Motor neurons were labeled by addition of chloromethyl Dill (CM-Dill; 1 μm, Invitrogen) to the side chamber overnight at 37°C. In some experiments, 200 × 103 glial cells isolated from neonatal rat brain were plated in the side chamber with neurites. An inhibitory mixture of 100 nm SP600125 to inhibit JNK (c-Jun N-terminal kinase), 2 μm Z-IETD-FMK to inhibit caspase-8, 1:100 antibody against the extracellular domain of p75NTR (AB8874, Abcam), and HSV-p50 was added to the distal chamber as noted.
Live-cell imaging.
Adult DRG cultures were observed 2–3 d after plating in glass-bottom microwell dishes (FluoroDish; World Precision Instruments) containing Hibernate-A low-fluorescence medium (Brain Bits) supplemented with 2% (v/v) B27 supplement (Invitrogen), 2 mm glutaMAX (Gibco), 0.4% d-glucose. The imaging chamber and objective were maintained at 37°C; cells remained viable for several hours. All imaging was performed using a Leica DM IRBE microscope with a 63 plan-apo objective. Digital images were taken with a Hamamatsu MTI RC300 charge-coupled device camera using OpenLab acquisition and analysis software. For time-lapse, images were acquired every 1–3 s. ImageJ was used to analyze vesicle velocity and to make kymographs.
Imaging with quantum dots conjugated to nerve growth factor (NGF-Qdot imaging) was performed with biotinylated NGF (kind gift from Alomone Labs), which was incubated on ice for 30 min with streptavidin Qdot655 (Invitrogen) at a 10:1 molar ratio. NGF-Qdots (2 nm) were added to the DRG cultures for 30 min; cells were washed three times before imaging. To ascertain that the coupling of NGF to Qdots did not reduce or inhibit biological function of the growth factor, we tested for activity using PC12 cells. There was no difference in PC12 cell differentiation or P-Trk (phospho-Trk) activation in response to incubation with NGF-Qdots compared with NGF treatment alone (100 ng/ml) (supplemental Fig. S4, available at www.jneurosci.org as supplemental material). Most of the internalized NGF-Qdots showed forward and backward movements with no net directionality over the time course of the experiment. Only vesicles that showed clear net transport toward the cell body for retrograde and from the cell body for anterograde, moving at least 10 μm at >0.2 μm/s average velocity, and that could be unambiguously tracked over the time course were analyzed for live-cell imaging experiments.
Ligation assays.
Ligation experiments were conducted with 85-d-old SOD1G93A (presymptomatic), 6 month Loa/+, and 12-month Tgdynamitin mice and their age-matched controls. Mice were anesthetized with ketamine and xylazine, and sciatic nerves were double ligated with 4-0 braided silk for 3 h. Segments immediately distal and proximal to the ligation site were subjected to Western blot analysis. Distal or proximal ligation segments were pooled from six sciatic nerves from three mice; the experiment was replicated at least three times for each line. Axoplasm was obtained from ligation segments by gentle squeezing into PBS containing protease inhibitors (Roche) and the following phosphatase inhibitors: 30 mm sodium fluoride, 40 mm β-glycerophosphate, 20 mm sodium pyrophosphate, 1 mm sodium orthovanadate. Multiple SDS-PAGE gels (10 μg/lane) were run from each ligation pool and probed with the indicated antibodies. Western blots were quantified and normalized to glyceraldehyde 3-phosphate dehydrogenase (GAPDH) using ImageJ. Because Erk and JNK pathways are activated minutes after sciatic nerve injury such as ligation, we focused on changes in total levels of these proteins rather than assessing relative levels of phosphorylated forms of these signaling molecules.
Dynein intermediate chain pull-down experiments.
His-tagged full-length recombinant dynein intermediate chain (DIC) was expressed in Escherichia coli and purified by Ni2+ affinity chromatography and then coupled to activated CH-Sepharose 4B beads (Karki and Holzbaur, 1995). Axoplasm (10 mg pooled from spinal cord and sciatic nerve for the Kinex antibody microarray or 1 mg from sciatic nerve for verification pull-downs) was obtained from dissected nerves after gentle compression in PBS containing protease inhibitors (Roche) and the following phosphatase inhibitors: 30 mm sodium fluoride, 40 mm β-glycerophosphate, 20 mm sodium pyrophosphate, 1 mm sodium orthovanadate. The axoplasm was precleared for 1 h with control activated CH-Sepharose 4B beads, followed by overnight incubation with DIC beads. The beads then were washed extensively and eluted with 0.1% trifluoroacetic acid followed by neutralization, dialysis (Slide-A-Lyzer, Pierce), and centricon (Millipore) concentration (for the microarray) or by boiling in SDS-PAGE sample buffer before loading on gels for Western blot analyses (for verification pull-downs).
The Kinexus microarray chip has 600 signaling antibodies in duplicate. The screen was repeated twice and the four sets of data were normalized and analyzed. We focused on signals showing at least a 30% difference consistently in both screens. As a secondary analysis, we compared the ratio of signal from mSOD1 to n.Tg for each protein on the two chips. Finally, we created a consensus list of proteins that showed >30% difference in both methods of analysis.
Vesicle purification.
Vesicles from spinal cord and sciatic nerve were purified as described previously (Caviston et al., 2007). Briefly, 100,000 × g spinal cord and sciatic nerve axoplasm pellet was fractionated by flotation through a sucrose step gradient with steps of 0.6, 1.5, and 2.0 m sucrose. The vesicles were isolated from the 0.6 m-to-1.5 m interface. The experiment was repeated twice for Loa and mSOD mice and littermate controls and one time with wtSOD1 mice.
Antibodies, Western blots, and immunofluorescence.
The following antibodies were from Chemicon International: DIC (MAB1618), β-galactosidase (MAB3468), kinesin heavy chain (KHC) (MAB1614), microtubule-associated protein 2 (AB5622), NGF (AB1526), BDNF (AB1779). The following antibodies were from Cell Signaling: Bim (4582), cleaved caspase-8 (9496), caspase-8 (9746), Erk5 (extracellular signal-regulated kinase 5; 3372), P-Erk5 (3371), Erk1/2 (9102), P-Erk1/2 (9101), JNK (9258), P-JNK (9251), p38 (9212), P-p38 (9211), P-TRK (9141), P-c-Jun (9261). The following antibodies were from BD Transduction Laboratories: GM130 (610823), p150 (610474), p50 (611003). The following antibodies were from Abcam: GAPDH (ab9484), p75NTR extracellular domain (ab8874), Rab5 (ab18211), Rab7 (ab50533). Intracellular domain antibody for p75NTR was from Upstate Cell Signaling Solutions (07-476). The SOD1 antibodies were from Santa Cruz (s.c.-11407) and Sigma (S-2147). Antibodies to active caspase-3 were from Biovision (3015-100), to NFH N52 from Sigma (N0142), and to neurofilaments from Sternberger (SMI31 and SMI32). Synaptotagmin antibody (SYA-130) was from StressGen.
Western blots and immunostainings were performed according to standard protocols. For immunofluorescence, DRG neurons were fixed with cold 3% paraformaldehyde containing phosphatase inhibitors for 20 min, whereas motor neurons were fixed in 4% paraformaldehyde for 10 min. Hoechst staining was used on fixed cells at a 0.025 μg/ml final concentration. Fluorescence intensity quantification was performed using ImageJ. A line was drawn along the axons and the total intensity and peaks along the line profile were measured per micrometer. To measured caspase-3 activation, the percentages of cells positive for activated caspase-3 from >100 cells from three independent experiments were analyzed.
In vitro motility assay.
Cytoplasmic dynein associated with dynactin was purified from mouse brain by microtubule affinity ATP extraction and sucrose gradient centrifugation as described previously (Ross et al., 2006). Gliding assays comparing purified dynein from 125-d-old mSOD1 and wild-type (WT) mice were done as described previously (Ross et al., 2006). For in vitro vesicle assays, polarity-marked microtubules were generated from 5 mg/ml tubulin polymerized at a ratio of 1 rhodamine-labeled tubulin dimer per 5 unlabeled dimers and then sheared with a syringe and further incubated at 37°C with 1.7 mg/ml tubulin with 1 rhodamine-labeled tubulin dimer per 50 tubulin dimers. Polarity-marked microtubules were stabilized with 20 μm taxol. A flow chamber was made from two coverslips and double-sided tape. Microtubules were allowed to bind to the coverslip for 5 min. Unbound microtubules were washed out with wash buffer (5 mg/ml casein, 10 mm DTT, and 20 μm taxol in motility assay buffer). Next, vesicle solution [50% vesicles (v:v), 100 μm ATP, glucose oxidase, glucose, and catalase in wash buffer] was flowed into the chamber. Vesicles were imaged with total internal reflection fluorescence microscopy. Image sequences were recorded at ∼2–8 frames per second.
To obtain green vesicles, we crossed mSOD1 mice to a line of transgenic mice (M30) that express low levels of a GFP-tagged dynamitin transgene (Ross et al., 2006). The labeled dynamitin is stoichiometrically incorporated into dynactin and stably associates with vesicles purified from mouse brain or spinal cord, allowing the visualization of dynein-based vesicular movement along microtubules with high temporal and spatial resolution using total internal reflection fluorescence microscopy (Caviston et al., 2007). These vesicles bound to and translocated along polarity-marked microtubules in vitro, and they released from microtubules at high ATP concentration, indicating that microtubule-based motor proteins associated with the vesicles dictated their attachment to the microtubule.
Results
Axonal transport is significantly inhibited in a mouse model of familial ALS
To examine the contribution of axonal transport defects and inhibition of neurotrophic factor signaling to neuronal degeneration, we quantitatively compared transport in the SOD1G93A mouse model of neurodegeneration (Gurney et al., 1994) to both nontransgenic (n.Tg) littermate controls and transgenic mice expressing wild-type human SOD1 (wtSOD1). Double ligation assays were performed, comparing the accumulation of motor subunits both proximal to and distal to the ligation site in sciatic nerves. We noted a significant inhibition of retrograde transport (∼30%; p < 0.01), as measured by accumulation of DIC and dynactin subunits (p50 and p150) distal to the block, in mSOD1 mice compared with n.Tg and wtSOD1 control lines (Fig. 1A). Inhibition of anterograde transport, as measured by accumulation of KHC proximal to the block, was less marked but also significant (p < 0.05) in the mSOD1 mouse model compared with controls (Fig. 1A). There was no significant difference in the total levels of the tested motor subunits in sciatic nerve axoplasm (data not shown). Thus, there is a significant impairment of the motors driving the fast axonal transport in vivo in the mSOD1 model. This impairment in retrograde transport is similar in magnitude to that observed in models with specific disruption in dynein function, including the Loa mouse [point mutation in dynein (Hafezparast et al., 2003)] and the Tgdynamitin mouse [overexpression of dynamitin leading to disruption of the dynein/dynactin complex (LaMonte et al., 2002)] (supplemental Fig. S1, available at www.jneurosci.org as supplemental material).
Figure 1.

Axonal transport is significantly inhibited in a mouse model of familial ALS. A, Double ligation assays were performed on sciatic nerves of 85-d-old SOD1G93A (mSOD) and age-matched nontransgenic littermate (n.Tg) mice, and transgenic mice overexpressing wild-type SOD1 (wtSOD). Segments immediately proximal (P) and distal (D) to the ligation site were subjected to Western blot analysis for accumulation of KHC, p150Glued subunit of dynactin, and p50-dynamitin subunit of dynactin; GAPDH served as a control. We observed significant differences in both retrograde (DIC, p150, p50) (p < 0.01) and anterograde (KHC) (*p < 0.05) transport compared with n.Tg and wtSOD1 controls. The average of distal and proximal intensity relative to GAPDH from three different experiments is plotted along with SEM. B, D, Live-cell imaging demonstrates slowing of axonal transport in neurons expressing mSOD1. Live imaging using phase optics was used to monitor vesicle transport. The average velocity of retrograde transport in primary motor neurons expressing mSOD1 (B) (n > 40) compared with neurons expressing wtSOD1 or noninfected (n.Inf) neurons and in DRG cultures (D) from 85-d-old mSOD1 mice compared with neurons cultured from littermate controls (n.Tg) or from mice expressing wtSOD1 (n > 30) shows a significant (p < 0.01) reduction. The average velocity of anterograde transport was also significantly reduced (p < 0.05) in MNs expressing mSOD1 (n > 39) and DRGs (n > 17) compared with controls. C, Comparisons of the distribution profiles for instantaneous velocities (n > 2000) show that expression of mSOD1 does not affect the maximum velocity of organelle motility but does induce an overall shift toward lower velocities.
To characterize axonal transport defects at the cellular level, we established live-cell imaging methods that allowed us to monitor both general vesicular transport and transport of a specific signaling molecule. First, we performed live-cell imaging of embryonic rat MN (motor neuron) cultures and assessed general vesicular transport by monitoring the motility of ∼500 nm axonal vesicles as seen in phase-contrast images. We compared vesicular motility in embryonic rat MN cultures that were infected with either SOD1G85R mSOD1 or wtSOD1 (supplemental Movies S1 and S2, available at www.jneurosci.org as supplemental material). In motor neurons expressing mSOD1, the average velocity of retrograde transport (0.41 ± 0.02 μm/s; n = 43) was significantly lower (p < 0.01) than that observed in neurons expressing wtSOD1 (0.76 ± 0.03 μm/s; n = 85) or in uninfected control cells (0.77 ± 0.02 μm/s; n = 81) (Fig. 1B). A similar slowing of transport in neurons expressing mSOD1 was also seen in studies using an exogenous tracer (Kieran et al., 2005) or EGFP (enhanced GFP)-tagged marker (De Vos et al., 2007), consistent with a generalized inhibition of retrograde vesicular transport in this model. We also analyzed the distribution profiles of instantaneous velocities (n > 2000) for vesicles moving in either the retrograde or the anterograde direction (Fig. 1C). We observed no difference in the maximum velocities of vesicular transport in these primary cultures but did see a clear shift toward lower velocities in neurons expressing mSOD1 compared with either neurons expressing wtSOD1 or uninfected controls. Further analysis of vesicle movement shows that vesicles from MNs expressing mSOD1 paused more frequently and moved significantly less (p < 0.001) than vesicles in MNs expressing wtSOD1 or in uninfected controls (73%, 88%, and 91% time moving, respectively). Anterograde transport was also inhibited in neurons expressing mSOD1 compared with neurons expressing wtSOD1, although the effect on anterograde transport was not as pronounced (Fig. 1B).
Because neurodegenerative diseases are age related and it is problematical to culture adult MNs, we also used DRG neurons cultured from adult mice expressing mutant or wild-type SOD1 as a model for late-onset neurodegeneration, using an 85 d time point, which corresponds to the presymptomatic phase of disease. The mSOD1 cultures are viable but grow shorter neurites (the average neurite length after 2 d in culture was 994 ± 96 μm for neurons from mSOD1 mice and 1214 ± 66 μm for n.Tg neurons; n > 100; p < 0.05). DRG neurons expressing mSOD1 also display significant Golgi fragmentation, a marker for dynein dysfunction that is also seen both in vivo and in vitro in MNs expressing mSOD1 (Gonatas et al., 2006) (supplemental Fig. S2, available at www.jneurosci.org as supplemental material). Similar to our observations from embryonic MN cultures, vesicles in DRG neurons cultured from 85 d mSOD1 mice displayed significantly (p < 0.01) lower retrograde and anterograde velocities (Fig. 1D) relative to DRG neurons from n.Tg and wtSOD1 controls. Thus, changes in retrograde transport are not specific to MNs in the mSOD1 model, as sensory neurons are also affected.
In vitro analysis of motor function
The inhibition of retrograde transport that we observed both in vivo (ligation assays) and in live-cell imaging assays may be due either to defects in motor function or to misregulation of motor activity. In particular, an association between mSOD1 but not wtSOD1 and dynein has been reported (Ligon et al., 2005; Zhang et al., 2007), although this interaction is relatively low affinity and may be indirect (supplemental Fig. S3A,B, available at www.jneurosci.org as supplemental material). The interaction between dynein and mSOD1 is disrupted by mild detergent or further purification of dynein through a sucrose gradient.
We purified dynein from mSOD1 and littermate n.Tg control mice and compared in vitro motor activity using microtubule gliding assays (Fig. 2A,B). There was no significant difference in the average instantaneous velocity of microtubule gliding for dynein purified from mSOD1 mice (0.27 μm/s; n = 3338), compared with dynein purified from age-matched n.Tg controls (0.26 μm/s; n = 3293). This observation suggests that expression of mSOD1 does not affect dynein function directly. Instead, expression of mSOD1 may lead to differential regulation of the motor, leading to an overall decrease in the efficiency of transport.
Figure 2.

In vitro analysis of dynein motor function. A, B, Microtubule gliding assays are shown schematically (A) and in a time series (B) using dynein purified from n.Tg (top) or mSOD1 (bottom) mice. No difference in average velocity was observed (n > 3000). Scale bar, 3 μm. C, D, In vitro vesicular motility assays are shown schematically (C) and in a time series (D) from mSOD1/M30 (mSOD1) and M30 (n.Tg) control mice visualized using total internal reflection fluorescence microscopy. A significant difference in the number of vesicles (green; arrowheads) undergoing processive movement (arrows) along the microtubules (red) was observed for vesicles purified from mSOD1 compared with n.Tg mice (*p < 0.05). The graph represents average ± SEM of three independent experiments. Scale bar, 5 μm.
To further test our hypothesis that mSOD1 affects dynein-mediated vesicular transport, we conducted in vitro vesicular motility assays using GFP–dynactin-labeled vesicles purified from mice expressing mSOD1 (M30/mSOD1) and from littermate control mice (M30) that express the GFP–dynactin protein but not mSOD1 (see Materials and Methods). We noted significant differences in the net directional movement of vesicles purified from mSOD1 or M30 mice in in vitro transport assays. Vesicles purified from M30/mSOD1 mice showed less processive motion (motion in the same direction of >300 nm) than vesicles purified from M30 control mice (Fig. 2C,D). The presence of mSOD1 on vesicles (supplemental Fig. S3C, available at www.jneurosci.org as supplemental material) did not decrease the instantaneous velocity of movement (340.59 ± 284.13 and 386.68 ± 191.11 μm/s; p = 0.4872). However, the average time that vesicles spent moving toward the minus end or plus end of the microtubule was always shorter for mSOD1-associated vesicles than for vesicles isolated from M30 control mice. Both the length of time spent moving and the distance moved in a single direction were decreased in mSOD1-purified vesicles, resulting in an overall decrease in directional determination (supplemental Fig. S3D, available at www.jneurosci.org as supplemental material). These in vitro observations suggest that the expression of mutant SOD1 alters the overall regulation of motor function during vesicle transport along the axon. The regulation may be at the level of cargo binding or may affect the coordination of multiple motors attached to a single transport vesicle (Gross, 2004).
Differential transport of signaling molecules in neurodegenerative disease models
To determine how retrograde axonal transport defects can lead to neurodegeneration, we tested specifically whether there is inhibition in neurotrophic factor signaling. We compared the axonal transport of specific survival signaling molecules in the rapidly progressive mSOD1 model compared with n.Tg and wtSOD1 controls. We performed double ligation assays on sciatic nerve and compared protein accumulation in segments immediately proximal and distal to the site of ligation (Fig. 3). We saw that the net retrograde transport of survival molecules like P-Trk, Erk1/2, Erk5, and the neurotrophic factors NGF and BDNF are significantly inhibited in vivo by the expression of mSOD1 (an ∼2-fold decrease compared with controls) (p < 0.01) (Fig. 3A–E). The total levels of those factors did not change in total axoplasm extracts (data not shown).
Figure 3.
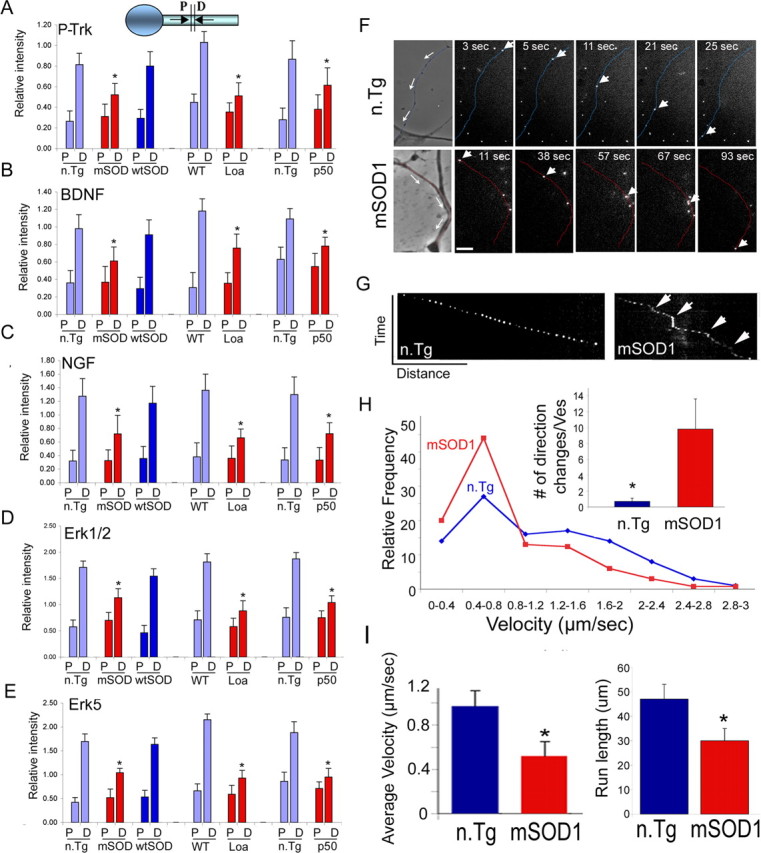
Inhibition in the retrograde transport of trophic factors. A–E, Double ligation assays of sciatic nerves of 85-d-old SOD1G93A (mSOD), 6-month Loa, and 1-year Tgdynamitin overexpressing mice (p50) and age-matched control mice were performed, and segments immediately proximal (P) and distal (D) to the ligation site were subjected to Western blot analysis. Significant inhibition of the retrograde transport of survival factors such as P-Trk (A), BDNF (B), NGF (C), Erk1/2 (D), and Erk5 (E) was observed in all three models. *p < 0.01. F, NGF-Qdot transport was imaged in DRG neurons cultured from 85-d-old mSOD1 and n.Tg control mice. The arrows in the phase image show the direction of movement, the arrowheads track representative Q-dots, and the neurites have been pseudocolored in blue (n.Tg) or red (mSOD). Scale bar, 5 μm. G, A representative kymograph shows more pauses (arrows) in the transport of NGF-Qdots in neurons expressing mSOD1. H, The relative frequency distribution for instantaneous velocities (n > 120) shows a significant shift to lower velocities. The Qdot-NGF changes direction of movement many more times in neurons expressing mSOD1 compared with control (*p < 0.01). I, The average retrograde velocity of NGF-Qdots and the total run length were significantly decreased (n ≥ 5; *p < 0.01) (average velocity ± SEM).
To examine this inhibition of transport at higher resolution, we monitored the movement of a specific survival cargo, NGF-Qdots, in primary DRG cultures from 85-d-old mSOD1 and n.Tg control mice. NGF linked to Qdots retains its biological function (supplemental Fig. S4, available at www.jneurosci.org as supplemental material). We noted a significant inhibition of retrograde transport relative to control (p < 0.01) (Fig. 3F–I; also supplemental Movies S3, S4, and S5, available at www.jneurosci.org as supplemental material). Retrogradely moving NGF-Qdots in neurons expressing mSOD1 often exhibited brief directional reversals and more frequent pauses, while moving in a net retrograde direction, compared with the smoothly processive motility observed for NGF-Qdots in wild-type neurons (Fig. 3G). The average velocity of NGF-Qdots in mSOD1 neurons (0.52 ± 0.13 μm/s; n = 5) was approximately one-half of that observed in n.Tg neurons (0.97 ± 0.14 μm/s; n = 7) (Fig. 3I). Although there was no significant difference in the maximum velocities (2.36 ± 0.13 μm/s in mSOD1 neurons and 2.05 ± 0.27 μm/s in n.Tg), the distribution profiles for instantaneous velocities (n.Tg n = 127; mSOD1 n = 233) indicated a clear shift to lower velocities in neurons cultured from mSOD1 mice (Fig. 3H).
To determine whether inhibition of retrograde trophic factor signaling can explain the severe neurodegeneration seen in the mSOD1 model, we also examined neurotrophic signaling along the axon in mouse models with impaired dynein function: Loa and Tgdynamitin. These mouse models show a decrease in the retrograde transport of trophic factors that is similar to that seen in the mSOD1 model (Fig. 3A–E), but they develop only mild neurodegeneration. Thus, retrograde transport impairment leading to neurotrophic factor deprivation is not sufficient to induce the pronounced neuronal loss seen in severe neurodegenerative diseases such as ALS.
Alterations in dynein cargo during rapidly progressing neuronal degeneration
The changes in motor regulation we observed in the mSOD1 mouse model suggest that there may be alterations in intracellular signaling pathways, and in particular in the dynein-associated cargo, the signaling endosome. To test this possibility, we used a proteomics approach with protein microarrays to identify and compare changes in signaling endosomes being retrogradely transported by dynein in mSOD1 and littermate n.Tg control mice.
We isolated the dynein-associated compartment from 85-d-old mSOD1 (presymptomatic stage) and age-matched n.Tg mice (Fig. 4) by conducting DIC pull-down assays from an axoplasm-enriched fraction. The DIC pull-down approach allows us to isolate the cargos that interact with dynein directly, such as dynactin (Karki and Holzbaur, 1995), but also enriches for proteins that interact indirectly with dynein, because they are in the same vesicular compartment (Fig. 4B). After verifying the specificity of the enrichment of signaling endosomes components in our dynein pull-downs (Fig. 4B, data not shown), the extracts were subjected to protein microarray analysis (Kinexus Bioinformatics).
Figure 4.
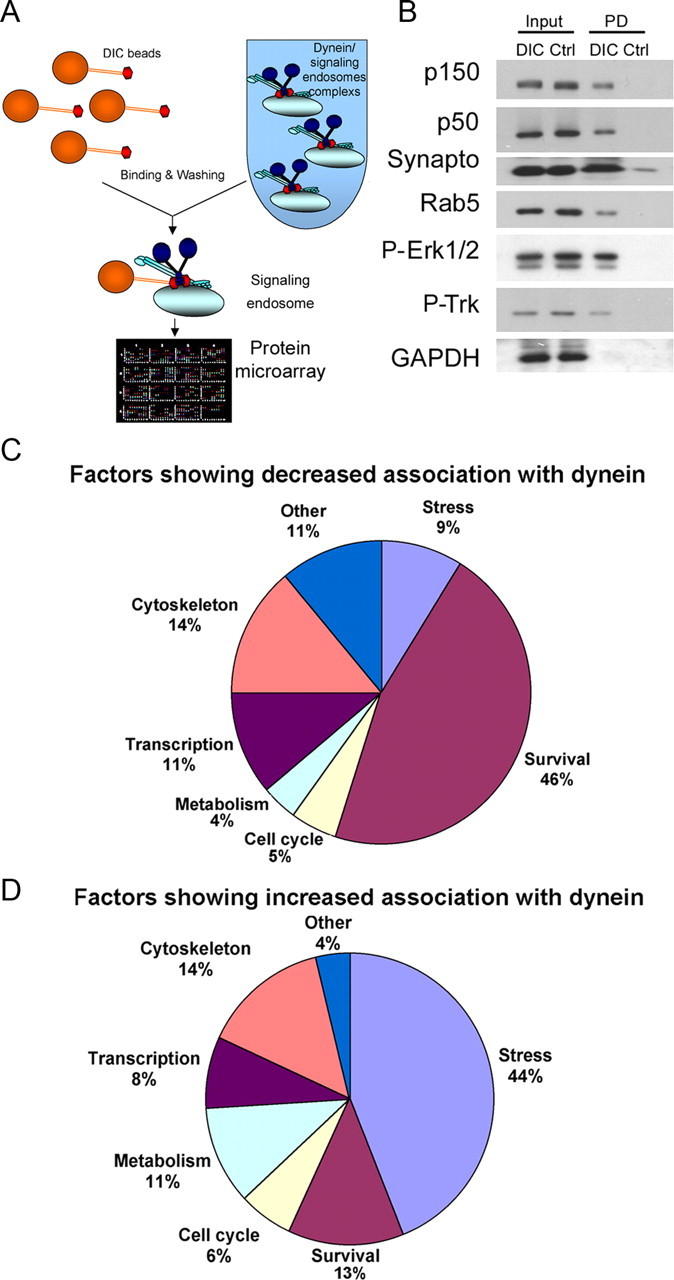
Proteomic analysis of dynein-associated proteins demonstrates a change in the balance of survival and stress signaling in mSOD1 mice. A, Schematic for dynein pull-down assays followed by protein microarray analysis. B, Dynein pull-downs isolate proteins interacting with dynein either directly, such as dynactin (p150 and p50), or indirectly, such as signaling endosome components synaptotagmin, Rab5, P-Erk1/2, and P-Trk. In contrast, the cytosolic protein GAPDH was not enriched in DIC pull-downs. Input, Load fraction; PD, pull-down fraction from DIC or control (Ctrl) beads; Synapto, synaptotagmin. C, D, Summary of the proteomics analysis of dynein pull-downs. Fewer survival factors (C) and more stress/death signals (D) were found to bind to dynein from mSOD1 axoplasmic extracts compared with control.
Overall, we found that ∼74% of the dynein-associated proteins identified in the screen did not show a significant change (<30% level of difference) in the extent of their association with dynein in extracts purified from either mSOD1 or n.Tg mice. However, ∼9% (52 proteins) showed an increased association, and ∼17% (102 proteins) showed a decreased association with dynein in axoplasmic extracts from mSOD1 mice compared with n.Tg controls (supplemental Table 1, available at www.jneurosci.org as supplemental material). Many of the proteins that showed a decreased association with dynein in the mSOD1 model were proteins from survival pathways (47 proteins, 46% of the total) (Fig. 4C), as defined by the Swiss-Prot database. In contrast, many of the proteins that showed an increased association with dynein in axoplasm from mSOD1 mice were proteins related to stress/death pathways (23 proteins, 44% of the total) (Fig. 4D). Therefore, these results suggest that dynein-associated cargos in mSOD1 mice are changing, and that the balance between survival and death factors is altered.
Of the signaling molecules that were identified in our screen, we focused on several key pathways that we thought might play a role in ALS pathogenesis for further characterization. First we verified the association of these proteins with dynein by performing specific DIC pull-down experiments using sciatic nerve extracts from mSOD1 or n.Tg mice (Fig. 5). The signaling molecules P-Trk, P-Erk1/2, and P-Erk5 are previously identified components of the signaling endosome that is actively transported in the retrograde direction along the axon (Delcroix et al., 2003). Interestingly, we found that these factors showed decreased association (∼60%; p < 0.05) with dynein in sciatic nerve extracts from mSOD1 mice (Fig. 5D,F). Furthermore, we found that the interaction of dynein with the proapoptotic protein Bim was also decreased (∼70%; p < 0.01), potentially releasing Bim to act to promote cell death in response to stress (Puthalakath et al., 1999).
Figure 5.

Differential interaction of signaling proteins with dynein observed in SOD1G93A but not in Loa mice compared with controls. A–C, Sciatic nerve extracts from 85-d-old SOD1G93A (S), 12-month Loa (L), and age-matched n.Tg and wild-type (W) mice were used in DIC pull-down assays followed by Western blot analysis for different signaling proteins. Positive controls (Post. CTRL) for the pull-down assay were the p150Glued and p50 (dynamitin) subunits of dynactin; GAPDH was used as a negative control (Neg. CTRL). D–F, P-Trk, P-Erk1/2, P-Erk5, and Bim all showed a decreased association with dynein in SOD1G93A but not in Loa mice. G–I, Increased association with dynein was observed for activated caspase-8, P-JNK, and p75 cleavage fragment in SOD1G93A mice, but no significant changes in these dynein cargos were observed in Loa mice. PD, DIC pull-down; CTRL, control beads; CLV, cleavage; FL, full length; CTF, C-terminal fragment; ICD, intracellular domain; Casp8, caspase-8. J, K, Differential association of vesicular signaling proteins observed in SOD1G93A but not in Loa mice compared with wild-type controls (J). Vesicle extracts from mSOD1, Loa, and wild-type mice were subjected to Western blot analysis for differences between pTrk and p75. Synaptotagmin was used as loading control. Whereas there was a decrease in P-Trk levels (>75%; p < 0.01) and an increase in p75 cleavage fragments in the mSOD1 mice vesicles compared with control, the levels of P-Trk and p75 were the same in Loa mice compared with WT control. Blots are from representative experiments (J) and the graphs are averages of relative changes (1 = no relative change) of dynein association with specific cargo from ≥3 independent experiments ± SEM, compared with control mice (K). S, Soup; P, pellet; 0.6, 0.6 m sucrose; V, vesicle extracts; 1.5, 1.5 m sucrose; Syn, synaptotagmin.
There were also factors that did not show any change in association with dynein in pull-downs from mSOD1 compared with WT mice (supplemental Fig. S5B, available at www.jneurosci.org as supplemental material). We did not see any interaction of Fas receptor with dynein in either mSOD1 or n.Tg mice. Since Fas was shown to play a role in motor neuron death in a pathway which includes p38 and caspase-8 (Raoul et al., 2002), we also looked at p38 and caspase-8 specifically. We saw that P-p38 was significantly upregulated in mSOD1 extracts; however, the association of P-p38 with dynein was not altered (p > 0.5) (supplemental Fig. S5B, available at www.jneurosci.org as supplemental material).
We observed increased caspase-8 activation (18 kDa cleavage product) in sciatic nerve axoplasm from mSOD1 mice compared with n.Tg control. In addition, activated caspase-8 showed a significant increase in its association with dynein (p < 0.001), suggesting that this protein may function as a retrograde death signal (Fig. 5G,I). A significant increase in association with dynein was also seen for the stress-activated protein kinase P-JNK (70%; p < 0.01) (Fig. 5G,I). Finally, we found that p75NTR receptor is cleaved in the mSOD1 mouse, and its cleavage fragments (∼25 kDa) are significantly enriched in dynein pull-downs (p < 0.001) (Fig. 5G,I). Caspase-8 was shown to retrogradely transfer a death signal in a p75NTR-dependent pathway (Carson et al., 2005). Thus, there are significant changes in dynein-associated cargos in 85-d-old, presymptomatic mSOD1 mice, indicating that these alterations in signaling pathways are occurring relatively early in the disease process. As changes in retrograde transport may become significant as early as 50 d after birth in the SOD1G93A line (Ligon et al., 2005), we also performed dynein pull-downs at an earlier stage. In 50-d-old mice as well, we noted decreased association of both P-Trk and P-Erk with dynein and increased association of P-JNK and p75 cleavage fragment with dynein (supplemental Fig. S5A, available at www.jneurosci.org as supplemental material). Thus, the dynein-associated changes we have observed occur early in pathogenesis and therefore may contribute to the development of frank degeneration of the axon observed later in the disease.
For comparison, we also performed dynein pull-down assays on sciatic nerve extracts from Loa mice [point mutation in dynein (Hafezparast et al., 2003)] and age-matched littermate n.Tg controls to see whether the nature of the signaling compartment is also changing in a mild model of neurodegeneration. There was no significant change in the extent of association of positive signals associated with neurotrophic signaling pathways, such as P-Trk, P-Erk1/2, and P-Erk5, with dynein in pull-downs from 12-month-old Loa+/− mice compared with wild-type littermate controls (Fig. 5E,F). Nor did we see an increased association of stress signaling molecules with dynein in Loa heterozygotes, in contrast to the observations in the mSOD1 model (Fig. 5H,I). Thus, the changes observed in the nature of the dynein-associated cellular fraction are seen only in mSOD1 mice, which exhibit more rapidly progressive neurodegeneration.
Spatial regulation may control the fidelity of specific retrograde signals
We also looked at whether the change in association with dynein is because of a change in the overall levels of expression in the axoplasm or to a more specific alteration in association with a cellular compartment transported by dynein along the axon. When comparing the input fractions of sciatic nerve extracts isolated from either mSOD1 or n.Tg control mice (Fig. 5; also supplemental Fig. S5B, available at www.jneurosci.org as supplemental material), we do not see appreciable differences in the overall levels of proteins, such as P-JNK and P-Erk, although we do see significant changes in the association of these factors with dynein (p < 0.01). In contrast, we do see significant changes in the p75NTR cleavage fragment and activated caspase-8 (Fig. 5G) (p < 0.01), which are significantly upregulated in axoplasm and also show an enhanced association with dynein. Thus, changes in the total levels of the different factors in axoplasm cannot explain the differential association with dynein observed in these assays.
To further verify changes in the signaling endosomes, we isolated axonal transport vesicles (Caviston et al., 2007) from mSOD1, Loa, and littermate control mice. Reduced P-Trk and increased p75NTR cleavage fragment were shown to associate with vesicles isolated from mSOD1 mice; these changes are not seen in vesicles purified from heterozygous Loa mice (Fig. 5J,K). Thus, the changes we see in dynein-associated signaling molecules in the mSOD1 mouse are because of alterations in the composition of the vesicular cargo that is transported by dynein along the axon and may be a mechanism to control the fidelity of specific retrograde signals.
Alterations in survival/stress signaling in neurons expressing mSOD1
The dynein pull-down experiments described above showed significant changes in the interaction of the signaling molecules with the retrograde transport machinery. To test whether those signaling endosomes also move differentially in the nerve, we performed ligation assays on sciatic nerve (Fig. 6A–C). Our results show that the net retrograde transport of stress factors such as p75NTR cleavage fragments, JNK, and activated caspase-8 were seen only in the mSOD1 model (∼3-fold increase compared with n.Tg and wtSOD1 controls; p < 0.02) (Fig. 6A–C). Transport of p38, Fas, and PI3K (phosphoinositide 3-kinase) were not appreciably changed between the neurodegeneration models (p > 0.5) (supplemental Fig. S5B,C, available at www.jneurosci.org as supplemental material).
Figure 6.

Alterations in the retrograde transport and localization of signaling molecules in neurons expressing mSOD1. A–C, Double ligation assays of sciatic nerves of 85-d-old SOD1G93A (mSOD), 6-month Loa, and 1-year Tgdynamitin overexpression mice (p50) and age-matched control mice were performed, and segments immediately proximal and distal to the ligation site were subjected to Western blot analysis. Stress/death factors like p75 cleavage fragments (A), JNK (B), and activated caspase-8 (actv-casp8) (C) showed alterations in retrograde axonal transport only in the mSOD1 mice. P, Proximal segment; D, distal segment. The bars represent the average intensity ± SEM relative to GAPDH from three different experiments. D–G, Rat E14 embryonic motor neurons were infected with either HSV-wtSOD or HSV-SOD1G85R and stained with antibodies to P-Trk (D) or the intracellular domain of p75 (E). Motor neuron cultures expressing mSOD1 displayed less P-Trk and more p75 localization to processes compared with neurons expressing wtSOD1 (boxed regions are shown at higher magnifications in the insets). Scale bar: (in D) D, E, 5 μm. G, Quantification of staining indicates significantly higher levels of p75 and lower levels of pTrk (n > 30; *p < 0.01) in mSOD1 neurites than in processes from neurons expressing wtSOD1. The number of immunoreactive puncta per unit length was also quantitated. There were fewer P-Trk-positive and more p75-positive puncta along the neurites of mSOD1-expressing cells (n > 30; *p < 0.01). The graphs shown represent average ± SEM. Line scan analyses along neurites in the indicated regions are also shown (F). H, I, In vivo mouse immunostaining of p75 and P-Trk motor neurons from the sternomastoid muscles additionally shows less P-Trk expression and more p75 in mSOD1 axons. Scale bars: H, 50 μm; I, 5 μm. J, Localization along the axon. Representative line scans along axons from mSOD1 and wtSOD1 mice confirm the altered patterns of P-Trk and p75. The experiment was repeated twice with similar results.
To further analyze the change in the balance of survival and death receptors in degenerating neurons, we examined the localization of signaling molecules in primary neuronal cultures expressing either wild-type or mutant SOD1. Embryonic rat MNs grown on glial cells were infected with HSV encoding either SOD1G85R mSOD1 or wtSOD1 and then stained with antibodies directed against the phosphorylated form of the Trk receptor or the intracellular domain of p75NTR (Fig. 6D,E). We quantified our observations by measuring the fluorescence intensity along the neurite per unit distance and by quantifying the peaks of intensity along the neurite per millimeter (Fig. 6G). We observed significantly higher levels of p75NTR receptor and lower levels of P-Trk receptor in neurites of motor neurons expressing mSOD1 compared with neurites from wtSOD1 control neurons (>2-fold difference compared with controls, p < 0.01). There were also fewer P-Trk puncta (>7-fold difference) and more p75NTR (>3-fold difference) puncta along the neurite (Fig. 6E) in mSOD1-expressing neurons (p < 0.01). These puncta may represent signaling endosomes that mediate signal transport from the periphery to the cell body; line scan analysis is also shown (Fig. 6F). To correlate these cellular observations with in vivo changes, we looked at motor neurons innervating sternomastoid muscles in mice expressing either wild-type or mutant SOD1. As shown in Figure 6H–J, changes induced by mSOD1 expression in vivo were very similar to results obtained from primary rat MN cultures. Motor neurons from SODG93A mSOD1 mice showed a striking loss of punctate P-Trk reactivity along the axon and a clear enhancement of p75NTR immunostaining.
Although overall levels of these proteins in sciatic nerve extract are not altered, their specific association with a vesicular fraction moving along the axon appears to be changed significantly, consistent with the results from the biochemical characterization of the vesicles. Interestingly, rat neurons expressing mSOD1 grown without the presence of glial cells (Fig. 7) or on glia expressing wtSOD1 (data not shown) display no significant changes in P-Trk (Fig. 7A,C–D) and in p75 (Fig. 7B,E–F) levels, and puncta along the neurite compare with what is seen for wtSOD1. Furthermore, cocultured neurons and glia expressing mSOD1 (Fig. 7G,H) show a pronounced activation of caspase-3. This activation was not seen in neurons cultured in the absence of glia. Thus, the changes in survival/stress receptors like P-Trk and p75NTR are likely to be non-cell autonomous and may activate neuronal cell death.
Figure 7.

Non-cell-autonomous changes in retrograde signaling lead to cell death. E14 embryonic rat motor neurons were grown in the presence or absence of glial cells and infected with either HSV-wtSOD or HSV-SOD1G85R. A–F, Staining by P-Trk decreased (A, C, D) and p75 reactivity along neuronal processes expressing mSOD1 increased (B, E, F) in neurons cocultured with glia. Line scans compare relative signal intensities along processes of neurons expressing mutant or wild-type SOD1 in the absence (green) or presence (orange) of glia. NF, neurofilament. Scale bar, 5 μm. G, H, Expression of mSOD1 led to enhanced reactivity with antibodies to caspase-3 compared with neurons expressing wtSOD1. The bar graph represents average ± SEM of percentage cells containing activated caspase-3 from ∼100 cells from three independent experiments. Activation of caspase-3 was more pronounced in neurons cocultured with glia also expressing mSOD1 (*p < 0.01). W, wtSOD1; S, mSOD1; Casp3, caspase-3. Scale bar, 8 μm.
Inhibition of the retrograde stress signaling is sufficient to rescue motor neurons from mSOD1-induced toxicity
To provide additional mechanistic insight into the role of the observed shift from survival-promoting to death-promoting retrograde signaling in the mSOD1 mouse model, we have developed a cellular assay with motor neurons grown in compartmentalized chambers, with cell bodies in the center chamber and glial cells in the distal chamber (Fig. 8A). These compartmentalized cultures allow us to more explicitly test our hypothesis of the role of retrograde transport in non-cell-autonomous signaling. Both cell types were infected with mSOD1 or wtSOD1. CM-Dill tracer was added to the distal compartment to label MN cell bodies that extend axons into the distal chamber. CM-Dill-positive cells that appeared vital and healthy were counted after 2 and 6 d. The percentage of MN survival was scored after 6 d. CM-Dill-positive mSOD1-expressing MNs show significant (p < 0.01) cell death (∼50%) compared with cells expressing wtSOD1 or to uninfected controls (Fig. 8B, data not shown). Addition of specific inhibitors to JNK, caspase-8, and p75NTR to the distal chambers in the presence of dynamitin overexpression to inhibit retrograde stress signaling led to a significant increase in cell survival (86%; p < 0.01; more then 1000 cells were scored in seven different chambers for each condition). To assess the cellular response to retrograde stress signaling, we looked at the downstream target of JNK activation, the proapoptotic transcription factor phospho-c-Jun. P-c-Jun is upregulated in vivo in spinal cords of the mSOD1 mouse model compared with n.Tg control (Fig. 8E) (Jaarsma et al., 1996). Immunostaining against P-c-Jun shows activation in mSOD1-expressing MNs (Fig. 8D).
Figure 8.
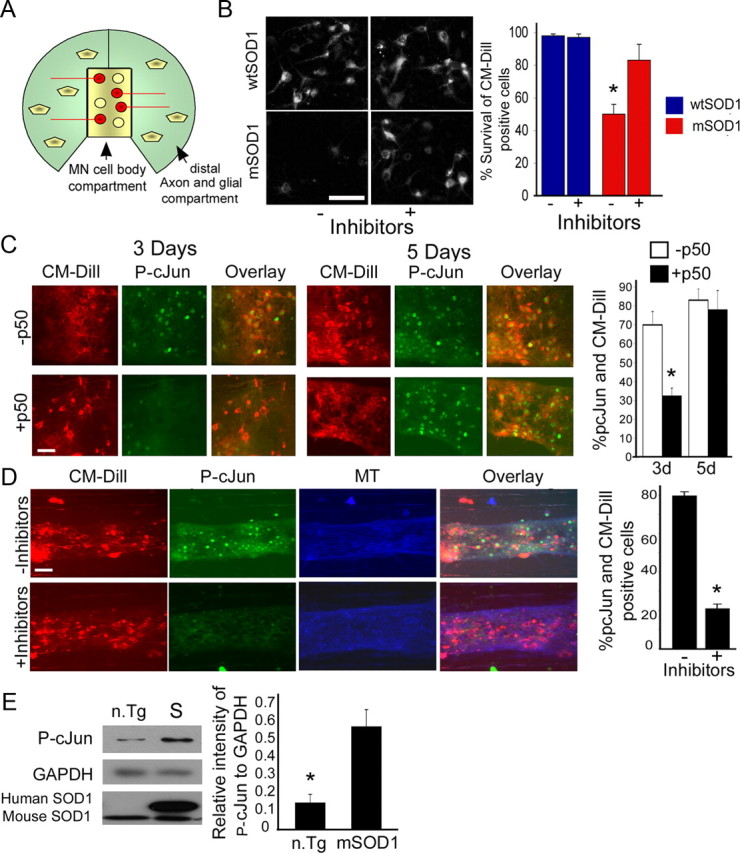
Inhibition of retrograde stress signaling in motor neurons is sufficient to block activation of P-c-Jun and to rescue motor neurons from mSOD1-induced toxicity. A, E14 embryonic rat motor neurons were grown for 3 weeks in compartmentalized Campenot chambers. CM-Dill tracer was added to the distal chambers to label the cell bodies of neurons that extend axons into the distal compartment. Glial cells were added to the distal compartments; both MN and glia cells were infected with HSV-mSOD1 or HSV-wtSOD1. Viable CM-Dill-positive MN cell bodies were counted after 2 (for basal number) and 6 d and percentages of survival after 6 d were scored. B, In coculture, expression of mSOD1 leads to significant cell death (∼50%) after 6 d. The addition of specific inhibitors to JNK, caspase-8, and p75 to the distal chambers in the presence of dynamitin overexpression to inhibit retrograde stress signaling led to a significant increase in cell survival (*p < 0.01). C, D, Immunostaining of MN cell bodies against the downstream target of JNK activation, the transcription factor P-c-Jun, shows activation in mSOD1-expressing cells in vitro. Partial inhibition of dynein transport by overexpression of the dynamitin (p50) subunit of dynactin prevents the upregulation of P-c-Jun (*p < 0.001) after 3 d but not after 5 d (C). However, adding a mixture of inhibitors (to JNK, p75, and caspase-8) prevents the upregulation of P-c-Jun (*p < 0.001) after 6 d (D). The experiments were repeated twice each time with four chambers. A total of more than 1000 cells for each condition was scored. MT, Microtubule. Scale bar, 20 μm. E, Western blot analysis of 85 d spinal cord extracts shows upregulation of P-c-Jun in mSOD1 mice (S) compared with n.Tg control (n.Tg). The Western blot analysis was repeated three times with similar results and quantified using ImageJ.
We then used this model to compare the effects of a slowing of retrograde transport via dynamitin overexpression (Fig. 8C) to an inhibition of retrograde signaling from the distal compartment, using a mixture of inhibitors to JNK, caspase-8, and p75NTR (Fig. 8D). We found that overexpression of dynamitin (p50), which leads to a slowing but not a complete block in retrograde transport (LaMonte et al., 2002), led to a delay in stress signaling to the nucleus, as measured by the activation of c-Jun, which was significantly lower after 3 d in motor neurons expressing mSOD1 and dynamitin (32%) compared with control cells that express only mSOD1 (69%; p < 0.001). However, by 5 d in culture there was no significant difference (Fig. 8C), as with time, stress signals arrive at the cell body and activate c-Jun. In contrast, addition of the mixture of inhibitors to the distal chamber is sufficient to prevent the upregulation of P-c-Jun after 5 d (Fig. 8B,D) (p < 0.001), in parallel with the rescue of MN cell death.
These observations as well as the results described above support our hypothesis that inhibition of retrograde neurotrophic factor signaling leads to mild neurodegeneration. However, in the mSOD1 mouse model there are also changes in the nature of dynein cargo from survival to stress signaling, likely mediated by glia, that lead to rapid, severe neurodegeneration (Fig. 9).
Figure 9.

Model correlating changes in axonal transport balance with disease severity and time course: slowing of retrograde transport is an early step that leads to slowly progressive motor neuron degeneration, because of decreased trophic factor signaling, as seen in the Loa and Tgdynamitin models, whereas changes in the nature of the signals undergoing retrograde transport by 50 d (presymptomatic) lead to more severe and more rapidly progressive degeneration by 120 d (severe symptoms and late stage of disease), as seen in the SOD1G93A model. Disease stages were classified based on symptoms like weight loss, walking difficulty, and muscle atrophy. Time scale for the SOD1G93A is shown. Sym, Symptomatic.
Discussion
Defects in axonal transport are implicated in a range of neurodegenerative diseases, including ALS, Huntington's disease, and Alzheimer's disease. Here, we describe for the first time a complete mechanism for how axonal transport defects may lead to severe neurodegeneration. This mechanism shows how extracellular signaling from mSOD1-expressing glia acts via neuronal receptors to activate intracellular stress signals, causing downstream activation of stress responses in the neuronal nucleus.
We used in vivo, in vitro, and live-cell imaging assays to fully characterize the axonal transport defects in the SOD1G93A model of familial ALS. We also found that mouse models with impaired dynein function, Loa and Tgdynamitin, show similarly decreased efficiencies of retrograde transport but, unlike the mSOD1 model, develop only mild neurodegeneration. Therefore, the slowing of neurotrophic factor signaling is not sufficient to induce pronounced neuronal loss. Instead, in the mSOD1 model in the early presymptomatic stage, there are profound changes in the nature of the cargo being transported by dynein along the axon; there is an overall shift from survival signaling to stress/death factor signaling. Inhibition of retrograde stress signaling is sufficient to delay activation of cellular stress pathways, as assessed by activation of c-Jun, and to rescue motor neurons from mSOD1-induced toxicity. These results support the model that inhibition of retrograde transport efficiency, including the slowed transport of neurotrophic factors, leads to only slowly progressive and mild neurodegeneration, whereas alterations in the nature of the signals being retrogradely transported from survival to stress may lead to severe neuronal dysfunction and cell death, as seen in ALS (Fig. 9). Still, it is not clear whether axonal transport alterations are the cause for the diseases or are secondary symptomatic effects of it. This causality question is not easy to answer. Because axonal transport alterations are an early event, it is reasonable to speculate that these changes play a causative role. However, we cannot exclude the possibility that protein aggregation mitochondrial dysfunction or other factors may play contributing roles in disease pathology. Further studies should lead to more comprehensive understanding of the machinery involved in the regulation of retrograde signaling along the axon.
Here, we examined the mechanisms of inhibition of retrograde transport observed in mSOD1 mice. In vitro microtubule gliding assays indicate that the dynein motor itself is not impaired. Instead, in vitro assays for vesicular motility indicate the effects of mutant SOD1 expression may be either direct or indirect, altering the regulatory balance of vesicle-associated motor proteins. For example, expression of mSOD1 on the vesicle may interfere with motor–cargo binding and this may disrupt motor regulation (Friedman and Vale, 1999). Furthermore, mSOD1 may also activate or repress one or more signaling pathways that regulate activity of motors in vivo through coordination of motor activity. We have shown by live-cell imaging and in vitro vesicle assays that there is an increase in bidirectional movement and a reduction in unidirectional, processive movement, which may be interpreted as unregulated motor function. These observations are consistent with the suggested role of signaling molecules such as P-JNK in regulating motor activity (Morfini et al., 2006; Horiuchi et al., 2007). JNK interacts with kinesin and the dynein/dynactin complex via JIP and sunday driver (syd) scaffolding proteins (Bowman et al., 2000; Verhey et al., 2001; Yano and Chao, 2004; Cavalli et al., 2005). JNK is downstream of p75NTR effectors and may have a role as a stress/death signal that leads to apoptosis. JNK may also be involved in the regulation of p75NTR cleavage, suggesting the possibility that there is a feedforward loop involved in the local regulation of JNK activation in the axon, leading to slowed transport and thus to a further enhancement of localized signaling.
Inhibition of retrograde axonal transport means that vital factors associated with the signaling endosome (Delcroix et al., 2003), including neurotrophic factors and signaling molecules such as P-Trk, Erk1/2, and Erk5, are not effectively reaching the cell body. Impaired communication between target tissues and the neuron cell body may lead with time to the activation of programmed cell death and slow neurodegeneration. However, here, we show that neurotrophin inhibition is not sufficient to activate severe and rapidly progressive degeneration such as that seen in the mSOD1 model, and that activation of retrograde death/stress pathways is likely to be key.
Recent progress has suggested that the motor neuron cell death observed in the mSOD1 model results from a non-cell-autonomous process (Lino et al., 2002; Clement et al., 2003; Boillée et al., 2006; Di Giorgio et al., 2007; Nagai et al., 2007). In contrast, if expression of mSOD1 is limited to motor neurons, only slow axonal degeneration is observed (Jaarsma et al., 2008). Expression of mSOD1 may either activate or repress signaling pathways controlling cell fate. Glia cells expressing mSOD1 may release factors that will differentially trigger neuronal receptors, leading to alterations in dynein-associated cargo and neurodegeneration. Indeed, a critical initiating event for the mechanism outlined above may be the differential activation of receptors like P-Trk and p75NTR caused by the expression of mSOD1 in the surrounding glial cells. We also found activation of caspase-8 in mSOD1 neurons, as well as an increased association of caspase-8 with dynein. Interestingly, axoplasmic caspase-8 was shown to be transported back to the cell body by the dynein/dynactin complex in a p75NTR-dependent manner, causing cell death after target removal (bulbectomy) or synaptic instability (Carson et al., 2005). Furthermore, the Fas/p38 signaling pathway was shown to activate caspase-8, leading to cell death in ALS motor neurons (Raoul et al., 2002). Thus, the cellular environment contributes significantly to cell death, leading to a change in the balance between survival and death receptors that enhances the progress of neurodegenerative disease, as seen in the mSOD1 model.
We used a proteomics approach to examine changes in dynein cargo more broadly, focusing on changes in cellular signaling pathways. Our results suggest that there is a set of signaling factors that are altered, rather than a single pathway that is affected. These observations may explain the limited effects observed when crossing mSOD1 mice with knock-outs in pathways that are thought to be important to disease pathology at the cellular level, such as p75 (Küst et al., 2003), FasL−/− (Petri et al., 2006), or Bax−/− (Gould et al., 2006) null mice. In contrast, crossing Loa mice with mSOD1 mice showed some rescue effects both in axonal transport defects and in the life span of the mice (Kieran et al., 2005). It is possible that in this cross, the mutation in dynein resulted in a delayed arrival of stress/death signals at the cell body, resulting in an extension of life span.
Partitioning of signals into the endosomal compartment may represent a key mechanism contributing to the specificity of a signal transduction pathway (Schenck et al., 2008). The retrograde transport of the signaling endosomes may also ensure spatial and temporal regulation that controls the fidelity of specific signals. Therefore, the specific balance between positive and negative signaling in time and place may mediate the regulation of cell survival, and a change in this balance toward stress/death signaling may lead to aggressive neuronal degeneration and cell death.
Footnotes
This work was supported by ALS Association (ALSA) and Muscular Dystrophy Association postdoctoral fellowships to E.P. and grants from ALSA and the National Institutes of Health (R01 NS060698) to E.L.F.H. We are grateful to Elizabeth Fisher for the generous gift of the Loa mice and to Piera Pasinelli for the wtSOD1 mice. We thank Mariko Tokito for invaluable assistance and Phyllis Dan (Alomone Labs) for the kind gift of biotin-NGF, Yale Goldman for assistance with total internal reflection fluorescence microscopy, Rachael Neve for packaging the recombinant HSV, Subhojit Roy for advice on live-cell imaging, and the Mobley laboratory for advice regarding NGF-Qdot tracking.
References
- Barker PA. p75NTR is positively promiscuous: novel partners and new insights. Neuron. 2004;42:529–533. doi: 10.1016/j.neuron.2004.04.001. [DOI] [PubMed] [Google Scholar]
- Boillée S, Yamanaka K, Lobsiger CS, Copeland NG, Jenkins NA, Kassiotis G, Kollias G, Cleveland DW. Onset and progression in inherited ALS determined by motor neurons and microglia. Science. 2006;312:1389–1392. doi: 10.1126/science.1123511. [DOI] [PubMed] [Google Scholar]
- Bowman AB, Kamal A, Ritchings BW, Philp AV, McGrail M, Gindhart JG, Goldstein LS. Kinesin-dependent axonal transport is mediated by the sunday driver (SYD) protein. Cell. 2000;103:583–594. doi: 10.1016/s0092-8674(00)00162-8. [DOI] [PubMed] [Google Scholar]
- Campenot RB. Compartmented culture analysis of nerve growth. In: Stevenson B., Paul D., Gallin W., editors. Cell-cell interactions: a practical approach. New York: Oxford UP; 1992. pp. 275–298. [Google Scholar]
- Carson C, Saleh M, Fung FW, Nicholson DW, Roskams AJ. Axonal dynactin p150Glued transports caspase-8 to drive retrograde olfactory receptor neuron apoptosis. J Neurosci. 2005;25:6092–6104. doi: 10.1523/JNEUROSCI.0707-05.2005. [DOI] [PMC free article] [PubMed] [Google Scholar]
- Cavalli V, Kujala P, Klumperman J, Goldstein LS. Sunday Driver links axonal transport to damage signaling. J Cell Biol. 2005;168:775–787. doi: 10.1083/jcb.200410136. [DOI] [PMC free article] [PubMed] [Google Scholar]
- Caviston J, Ross J, Antony S, Tokito M, Holzbaur E. Huntingtin facilitates dynein/dynactin-mediated vesicle transport. Proc Natl Acad Sci U S A. 2007;104:10045–10050. doi: 10.1073/pnas.0610628104. [DOI] [PMC free article] [PubMed] [Google Scholar]
- Chao MV. Neurotrophins and their receptors: a convergence point for many signalling pathways. Nat Rev Neurosci. 2003;4:299–309. doi: 10.1038/nrn1078. [DOI] [PubMed] [Google Scholar]
- Chen XJ, Levedakou EN, Millen KJ, Wollmann RL, Soliven B, Popko B. Proprioceptive sensory neuropathy in mice with a mutation in the cytoplasmic dynein heavy chain 1 gene. J Neurosci. 2007;27:14515–14524. doi: 10.1523/JNEUROSCI.4338-07.2007. [DOI] [PMC free article] [PubMed] [Google Scholar]
- Chevalier-Larsen E, Holzbaur EL. Axonal transport and neurodegenerative disease. Biochim Biophys Acta. 2006;1762:1094–1108. doi: 10.1016/j.bbadis.2006.04.002. [DOI] [PubMed] [Google Scholar]
- Clement AM, Nguyen MD, Roberts EA, Garcia ML, Boillée S, Rule M, McMahon AP, Doucette W, Siwek D, Ferrante RJ, Brown RH, Jr, Julien JP, Goldstein LS, Cleveland DW. Wild-type nonneuronal cells extend survival of SOD1 mutant motor neurons in ALS mice. Science. 2003;302:113–117. doi: 10.1126/science.1086071. Erratum (2003) 302:568. [DOI] [PubMed] [Google Scholar]
- Deinhardt K, Salinas S, Verastegui C, Watson R, Worth D, Hanrahan S, Bucci C, Schiavo G. Rab5 and Rab7 control endocytic sorting along the axonal retrograde transport pathway. Neuron. 2006;52:293–305. doi: 10.1016/j.neuron.2006.08.018. [DOI] [PubMed] [Google Scholar]
- Delcroix JD, Valletta JS, Wu C, Hunt SJ, Kowal AS, Mobley WC. NGF signaling in sensory neurons: evidence that early endosomes carry NGF retrograde signals. Neuron. 2003;39:69–84. doi: 10.1016/s0896-6273(03)00397-0. [DOI] [PubMed] [Google Scholar]
- De Vos KJ, Chapman AL, Tennant ME, Manser C, Tudor EL, Lau KF, Brownlees J, Ackerley S, Shaw PJ, McLoughlin DM, Shaw CE, Leigh PN, Miller CC, Grierson AJ. Familial amyotrophic lateral sclerosis-linked SOD1 mutants perturb fast axonal transport to reduce axonal mitochondria content. Hum Mol Genet. 2007;16:2720–2728. doi: 10.1093/hmg/ddm226. [DOI] [PMC free article] [PubMed] [Google Scholar]
- Di Giorgio FP, Carrasco MA, Siao MC, Maniatis T, Eggan K. Non-cell autonomous effect of glia on motor neurons in an embryonic stem cell-based ALS model. Nat Neurosci. 2007;10:608–614. doi: 10.1038/nn1885. [DOI] [PMC free article] [PubMed] [Google Scholar]
- Friedman DS, Vale RD. Single-molecule analysis of kinesin motility reveals regulation by the cargo-binding tail domain. Nat Cell Biol. 1999;1:293–297. doi: 10.1038/13008. [DOI] [PubMed] [Google Scholar]
- Fryer HJ, Knox RJ, Strittmatter SM, Kalb RG. Excitotoxic death of a subset of embryonic rat motor neurons in vitro. J Neurochem. 1999;72:500–513. doi: 10.1046/j.1471-4159.1999.0720500.x. [DOI] [PubMed] [Google Scholar]
- Gonatas NK, Stieber A, Gonatas JO. Fragmentation of the Golgi apparatus in neurodegenerative diseases and cell death. J Neurol Sci. 2006;246:21–30. doi: 10.1016/j.jns.2006.01.019. [DOI] [PubMed] [Google Scholar]
- Gould TW, Buss RR, Vinsant S, Prevette D, Sun W, Knudson CM, Milligan CE, Oppenheim RW. Complete dissociation of motor neuron death from motor dysfunction by Bax deletion in a mouse model of ALS. J Neurosci. 2006;26:8774–8786. doi: 10.1523/JNEUROSCI.2315-06.2006. [DOI] [PMC free article] [PubMed] [Google Scholar]
- Gross SP. Hither and yon: a review of bi-directional microtubule-based transport. Phys Biol. 2004;1:R1–R11. doi: 10.1088/1478-3967/1/2/R01. [DOI] [PubMed] [Google Scholar]
- Gurney ME, Pu H, Chiu AY, Dal Canto MC, Polchow CY, Alexander DD, Caliendo J, Hentati A, Kwon YW, Deng HX. Motor neuron degeneration in mice that express a human Cu,Zn superoxide dismutase mutation. Science. 1994;264:1772–1775. doi: 10.1126/science.8209258. Erratum (1995) 269:149. [DOI] [PubMed] [Google Scholar]
- Hafezparast M, Klocke R, Ruhrberg C, Marquardt A, Ahmad-Annuar A, Bowen S, Lalli G, Witherden AS, Hummerich H, Nicholson S, Morgan PJ, Oozageer R, Priestley JV, Averill S, King VR, Ball S, Peters J, Toda T, Yamamoto A, Hiraoka Y, et al. Mutations in dynein link motor neuron degeneration to defects in retrograde transport. Science. 2003;300:808–812. doi: 10.1126/science.1083129. [DOI] [PubMed] [Google Scholar]
- Heerssen HM, Pazyra MF, Segal RA. Dynein motors transport activated Trks to promote survival of target-dependent neurons. Nat Neurosci. 2004;7:596–604. doi: 10.1038/nn1242. [DOI] [PubMed] [Google Scholar]
- Henderson CE, Camu W, Mettling C, Gouin A, Poulsen K, Karihaloo M, Rullamas J, Evans T, McMahon SB, Armanini MP. Neurotrophins promote motor neuron survival and are present in embryonic limb bud. Nature. 1993;363:266–270. doi: 10.1038/363266a0. [DOI] [PubMed] [Google Scholar]
- Horiuchi D, Collins CA, Bhat P, Barkus RV, Diantonio A, Saxton WM. Control of a kinesin-cargo linkage mechanism by JNK pathway kinases. Curr Biol. 2007;17:1313–1317. doi: 10.1016/j.cub.2007.06.062. [DOI] [PMC free article] [PubMed] [Google Scholar]
- Jaarsma D, Holstege JC, Troost D, Davis M, Kennis J, Haasdijk ED, de Jong VJ. Induction of c-Jun immunoreactivity in spinal cord and brainstem neurons in a transgenic mouse model for amyotrophic lateral sclerosis. Neurosci Lett. 1996;219:179–182. doi: 10.1016/s0304-3940(96)13202-x. [DOI] [PubMed] [Google Scholar]
- Jaarsma D, Teuling E, Haasdijk ED, De Zeeuw CI, Hoogenraad CC. Neuron-specific expression of mutant superoxide dismutase is sufficient to induce amyotrophic lateral sclerosis in transgenic mice. J Neurosci. 2008;28:2075–2088. doi: 10.1523/JNEUROSCI.5258-07.2008. [DOI] [PMC free article] [PubMed] [Google Scholar]
- Karki S, Holzbaur EL. Affinity chromatography demonstrates a direct binding between cytoplasmic dynein and the dynactin complex. J Biol Chem. 1995;270:28806–28811. doi: 10.1074/jbc.270.48.28806. [DOI] [PubMed] [Google Scholar]
- Kenchappa RS, Zampieri N, Chao MV, Barker PA, Teng HK, Hempstead BL, Carter BD. Ligand-dependent cleavage of the P75 neurotrophin receptor is necessary for NRIF nuclear translocation and apoptosis in sympathetic neurons. Neuron. 2006;50:219–232. doi: 10.1016/j.neuron.2006.03.011. [DOI] [PubMed] [Google Scholar]
- Kieran D, Hafezparast M, Bohnert S, Dick JR, Martin J, Schiavo G, Fisher EM, Greensmith L. A mutation in dynein rescues axonal transport defects and extends the life span of ALS mice. J Cell Biol. 2005;169:561–567. doi: 10.1083/jcb.200501085. [DOI] [PMC free article] [PubMed] [Google Scholar]
- Küst BM, Brouwer N, Mantingh IJ, Boddeke HW, Copray JC. Reduced p75NTR expression delays disease onset only in female mice of a transgenic model of familial amyotrophic lateral sclerosis. Amyotroph Lateral Scler Other Motor Neuron Disord. 2003;4:100–105. [PubMed] [Google Scholar]
- LaMonte BH, Wallace KE, Holloway BA, Shelly SS, Ascaño J, Tokito M, Van Winkle T, Howland DS, Holzbaur EL. Disruption of dynein /dynactin inhibits axonal transport in motor neurons causing late-onset progressive degeneration. Neuron. 2002;34:715–727. doi: 10.1016/s0896-6273(02)00696-7. [DOI] [PubMed] [Google Scholar]
- Lee R, Kermani P, Teng KK, Hempstead BL. Regulation of cell survival by secreted proneurotrophins. Science. 2001;294:1945–1948. doi: 10.1126/science.1065057. [DOI] [PubMed] [Google Scholar]
- Ligon LA, LaMonte BH, Wallace KE, Weber N, Kalb RG, Holzbaur EL. Mutant superoxide dismutase disrupts cytoplasmic dynein in motor neurons. Neuroreport. 2005;16:533–536. doi: 10.1097/00001756-200504250-00002. [DOI] [PubMed] [Google Scholar]
- Lino MM, Schneider C, Caroni P. Accumulation of SOD1 mutants in postnatal motoneurons does not cause motoneuron pathology or motoneuron disease. J Neurosci. 2002;22:4825–4832. doi: 10.1523/JNEUROSCI.22-12-04825.2002. [DOI] [PMC free article] [PubMed] [Google Scholar]
- Lu B, Pang PT, Woo NH. The yin and yang of neurotrophin action. Nat Rev Neurosci. 2005;6:603–614. doi: 10.1038/nrn1726. [DOI] [PubMed] [Google Scholar]
- Morfini G, Pigino G, Szebenyi G, You Y, Pollema S, Brady ST. JNK mediates pathogenic effects of polyglutamine-expanded androgen receptor on fast axonal transport. Nat Neurosci. 2006;9:907–916. doi: 10.1038/nn1717. [DOI] [PubMed] [Google Scholar]
- Nagai M, Re DB, Nagata T, Chalazonitis A, Jessell TM, Wichterle H, Przedborski S. Astrocytes expressing ALS-linked mutated SOD1 release factors selectively toxic to motor neurons. Nat Neurosci. 2007;10:615–622. doi: 10.1038/nn1876. [DOI] [PMC free article] [PubMed] [Google Scholar]
- Neve RL, Howe HR, Hong S, Kalb RG. Introduction of the glutamate receptor subunit 1 into motor neurons in vitro and in vivo using a recombinant herpes simplex virus. Neuroscience. 1997;79:435–447. doi: 10.1016/s0306-4522(96)00645-8. [DOI] [PubMed] [Google Scholar]
- Petri S, Kiaei M, Wille E, Calingasan NY, Flint Beal M. Loss of Fas ligand-function improves survival in G93A-transgenic ALS mice. J Neurol Sci. 2006;251:44–49. doi: 10.1016/j.jns.2006.08.013. [DOI] [PubMed] [Google Scholar]
- Puls I, Jonnakuty C, LaMonte BH, Holzbaur EL, Tokito M, Mann E, Floeter MK, Bidus K, Drayna D, Oh SJ, Brown RH, Jr, Ludlow CL, Fischbeck KH. Mutant dynactin in motor neuron disease. Nat Genet. 2003;33:455–456. doi: 10.1038/ng1123. [DOI] [PubMed] [Google Scholar]
- Puls I, Oh SJ, Sumner CJ, Wallace KE, Floeter MK, Mann EA, Kennedy WR, Wendelschafer-Crabb G, Vortmeyer A, Powers R, Finnegan K, Holzbaur EL, Fischbeck KH, Ludlow CL. Distal spinal and bulbar muscular atrophy caused by dynactin mutation. Ann Neurol. 2005;57:687–694. doi: 10.1002/ana.20468. [DOI] [PMC free article] [PubMed] [Google Scholar]
- Puthalakath H, Huang DC, O'Reilly LA, King SM, Strasser A. The proapoptotic activity of the Bcl-2 family member Bim is regulated by interaction with the dynein motor complex. Mol Cell. 1999;3:287–296. doi: 10.1016/s1097-2765(00)80456-6. [DOI] [PubMed] [Google Scholar]
- Raoul C, Estévez AG, Nishimune H, Cleveland DW, deLapeyrière O, Henderson CE, Haase G, Pettmann B. Motoneuron death triggered by a specific pathway downstream of Fas. Potentiation by ALS-linked SOD1 mutations. Neuron. 2002;35:1067–1083. doi: 10.1016/s0896-6273(02)00905-4. [DOI] [PubMed] [Google Scholar]
- Ross JL, Wallace K, Shuman H, Goldman YE, Holzbaur EL. Processive bidirectional motion of dynein-dynactin complexes in vitro. Nat Cell Biol. 2006;8:562–570. doi: 10.1038/ncb1421. [DOI] [PubMed] [Google Scholar]
- Schenck A, Goto-Silva L, Collinet C, Rhinn M, Giner A, Habermann B, Brand M, Zerial M. The endosomal protein Appl1 mediates Akt substrate specificity and cell survival in vertebrate development. Cell. 2008;133:468–497. doi: 10.1016/j.cell.2008.02.044. [DOI] [PubMed] [Google Scholar]
- Verhey KJ, Meyer D, Deehan R, Blenis J, Schnapp BJ, Rapoport TA, Margolis B. Cargo of kinesin identified as JIP scaffolding proteins and associated signaling molecules. J Cell Biol. 2001;152:959–970. doi: 10.1083/jcb.152.5.959. [DOI] [PMC free article] [PubMed] [Google Scholar]
- Williamson TL, Cleveland DW. Slowing of axonal transport is a very early event in the toxicity of ALS-linked SOD1 mutants to motor neurons. Nat Neurosci. 1999;2:50–56. doi: 10.1038/4553. [DOI] [PubMed] [Google Scholar]
- Yano H, Chao MV. Mechanisms of neurotrophin receptor vesicular transport. J Neurobiol. 2004;58:244–257. doi: 10.1002/neu.10321. [DOI] [PubMed] [Google Scholar]
- Yano H, Lee FS, Kong H, Chuang J, Arevalo J, Perez P, Sung C, Chao MV. Association of Trk neurotrophin receptors with components of the cytoplasmic dynein motor. J Neurosci. 2001;21:RC125. doi: 10.1523/JNEUROSCI.21-03-j0003.2001. [DOI] [PMC free article] [PubMed] [Google Scholar]
- Ye H, Kuruvilla R, Zweifel LS, Ginty DD. Evidence in support of signaling endosome-based retrograde survival of sympathetic neurons. Neuron. 2003;39:57–68. doi: 10.1016/s0896-6273(03)00266-6. [DOI] [PubMed] [Google Scholar]
- Zhang B, Tu P, Abtahian F, Trojanowski JQ, Lee VM. Neurofilaments and orthograde transport are reduced in ventral root axons of transgenic mice that express human SOD1 with a G93A mutation. J Cell Biol. 1997;139:1307–1315. doi: 10.1083/jcb.139.5.1307. [DOI] [PMC free article] [PubMed] [Google Scholar]
- Zhang F, Ström AL, Fukada K, Lee S, Hayward LJ, Zhu H A. Interaction between familial amyotrophic lateral sclerosis (ALS)-linked SOD1 mutants and the dynein complex. J Biol Chem. 2007;282:16691–16699. doi: 10.1074/jbc.M609743200. [DOI] [PubMed] [Google Scholar]