

Abstract
Purpose
Children with speech sound disorder (SSD) and reading disability (RD) have poor phonological awareness, a problem believed to arise largely from deficits in processing the sensory information in speech, specifically individual acoustic cues. However, such cues are details of acoustic structure. Recent theories suggest that listeners also need to be able to integrate those details to perceive linguistically relevant form. This study examined abilities of children with SSD, RD, and SSD+RD not only to process acoustic cues but also to recover linguistically relevant form from the speech signal.
Method
Ten- to 11-year-olds with SSD (n = 17), RD (n = 16), SSD+RD (n = 17), and Controls (n = 16) were tested to examine their sensitivity to (1) voice onset times (VOT); (2) spectral structure in fricative-vowel syllables; and (3) vocoded sentences.
Results
Children in all groups performed similarly with VOT stimuli, but children with disorders showed delays on other tasks, although the specifics of their performance varied.
Conclusion
Children with poor phonemic awareness not only lack sensitivity to acoustic details, but are also less able to recover linguistically relevant forms. This is contrary to one of the main current theories of the relation between spoken and written language development.
Keywords: speech sound disorder, reading disability, speech perception
1. Introduction
The overall goal of this study was to test the similarity of deficits in phonological representations in three groups of 10- to 11-year-old children who have different clinical outcomes (Speech Sound Disorder1, Reading Disability, and Speech Sound Disorder +Reading Disability: SSD, RD, and SSD+RD), despite sharing a current or past underlying deficit in phonemic awareness (PA). The choice of these three contrasting groups allowed us to address several theoretically important questions: (1) How similar are the deficits in phonological representations that disrupt speech production in SSD to those that disrupt the decoding of printed words and nonwords in RD? (2) Do these deficits in SSD persist after the speech production problem has resolved? (3) If these deficits in phonological representations in SSD and RD are similar, how do we explain differences in clinical presentation, especially SSD without later RD and RD without earlier SSD? And (4) Are the deficits in these three groups exclusively at the “segmental” level, as is widely believed?
Questions (1), (3), and (4) bear on the widely accepted phonological theory of RD (Fowler, 1991; Snowling, 2000; Stanovich & Siegel, 1994). If, as the phonological theory of RD holds, a deficit in phonemic awareness (PA) is sufficient to cause RD, there should not be children with an early PA deficit who develop normal reading. But some children with SSD who have demonstrable PA deficits go on to learn to read normally (Peterson, Pennington, Shriberg & Boada, 2009; Stothard, Snowling, Bishop, Chipchase, & Kaplan, 1998). This finding seriously threatens the phonological theory of RD, unless the underlying problem in phonological development in children with SSD without later RD is different from that found in children with early PA deficits who later become RD (RD only). Finally, if children with RD or SSD+RD have deficits in phonological representations beyond the segmental level, the phonological theory of RD is also threatened because this theory assumes that the problem in phonological representations is restricted to phonemic representations (e.g. Fowler, 1991).
The current study builds on our earlier work with a large longitudinal study of children with speech sound disorder (SSD), followed from age 5 until age 8 in order to study their reading development. In that study, we have found that deficits on measures of PA and other phonological tasks were pervasive among the children with SSD before formal literacy instruction commenced (Raitano, Pennington, Tunick, Boada, & Shriberg, 2004), but that only a minority (less than 25%) of the children developed later RD (Peterson, Pennington, Shriberg, & Boada, 2009). Specifically, in Raitano et al. (2004) we found that all four subgroups of SSD children (defined by crossing two dichotomies: language impaired (LI) vs. not LI and persisting vs. resolved speech production problems) had PA deficits relative to controls, and that even the least affected subgroup (without LI or a current problem in speech production) had a moderate PA deficit relative to controls without LI or SSD (Cohen’s d = .78). However, this same group did not differ significantly from controls on letter knowledge, which was significantly impacted in the overall SSD group by the presence of comorbid LI, but not by the persistence of speech problems. So, a disassociation between PA (and speech) deficits and intact literacy development was already apparent at age 5, with literacy development more related to language skill than to the presence of speech or PA problems. These dissociations were maintained at follow-up at age 8 (Peterson, et al. 2009), when reading data were collected. We found that reading at time 2 was predicted by time 1 language but not by time 1 speech, but that both factors predicted time 2 PA. So, at time 2, there were SSD children with persisting PA deficits who did not develop RD, contrary to the phonological hypothesis. In a separate paper (Treiman, Pennington, Shriberg, and Boada, 2008), we probed this dissociation between PA and early literacy further and found that even SSD children with chance performance on PA tasks were using letter names to learn letter sounds just as typical readers do. Taken together, these results indicate that children with SSD and PA deficits can nonetheless use letter names and sounds to learn to read, sometimes normally. In contrast, children at family risk for RD who later become RD also have early PA deficits of a similar magnitude at age 5, but only a minority of them have SSD (Pennington & Lefly, 2001). So, across these two longitudinal studies in our lab, we have found dissociations among SSD, PA deficits, and later RD that question the phonological theory of RD. To better understand these dissociations, we conducted the present study.
Specifically, the present study extends the longitudinal study of our SSD sample to a third time point in order to study phonological development in SSD and RD in more detail. In the present study, we tested a representative subset of each of two groups of SSD children (SSD only and SSD+RD) and our control group at roughly age 11 years. We also added an RD group without history of earlier SSD or language problems, who would also be expected to have a PA deficit, in order to address Question (1) concerning whether the deficits in phonological representations found in RD and SSD are similar. To answer this question, we examined sensitivity to several kinds of structure in the speech signal using different speech perception tasks.
1.1 Historical perspectives on phonological and literacy development and disorder
It is well known that early speech and language difficulties often predict the development of a reading disability once a child reaches school age (Bishop & Adams, 1990; Catts, Fey, Tomblin, & Zhang, 2002; Hall & Tomblin, 1978). While the basis for this relationship is still being explored, mounting evidence suggests that the disorders share several deficits, primarily one in phonemic awareness, thus implicating phonological development in both SSD and RD, as well as in language impairment (Bird, Bishop, & Freeman, 1995; Clarke-Klein & Hodson, 1995; Leonard, 1982; Lewis & Freebairn, 1992). Phonological structure can be considered at a number of levels, including words, syllables, demisyllables (onset and rhyme), and phonemes. However, reading and language researchers commonly measure a child’s phonological development with tasks involving PA (see Swanson, Trainin, Necoechea, and Hammill, 2003). These tasks require awareness explicitly of the phonetic structure of words so that phonemes can be separately recognized and manipulated. Reading researchers have focused on the phonemic level because of the importance of the phoneme-grapheme correspondence in learning to read an alphabetic orthography, as we have in English. Nonetheless, the “phoneme” itself is not a discrete temporal segment; instead it is conceptually defined by several different aspects of the acoustic structure of the speech signal. As a result, each child must discover anew that relation between acoustic and phonetic structure in the native language being learned.
The label SSD refers to difficulties usually arising during the preschool years in the production of intelligible spoken language (Shriberg, 2003), which led earlier clinicians and researchers to assign a primary sensorimotor deficit to the disorder, calling it “functional articulation disorder” (see discussion in Bishop, 1997). However, this view of SSD is called into question by several lines of evidence, including speech error patterns and the performance of groups with SSD on various phonological tasks, including those that do not require a spoken output. Children with SSD sometimes produce a sound correctly in one context but not in another, and most of their errors are substitutions or omissions of phonemes, not the distortions we would expect if they had an imprecise motor program (Leonard, 1995). In addition, children with SSD have reliably been shown to have difficulty recognizing and manipulating phonetic structure, (e.g., Bird, Bishop, & Freeman, 1995; Rvachew, 2007; Rvachew, Ohberg, Grawburg, & Heyding, 2003), although some studies have found that the severity of the sensorimotor and phonological deficits are not well correlated (e.g., Larrivee & Catts, 1999; Rvachew & Grawburg, 2006). Moreover, there is some evidence that children with SSD are not as sensitive to all parts of the acoustic speech signal as are typically developing children (Rvachew & Jamieson, 1989).
In comparison, RD, or dyslexia, generally does not become obvious until school age, when difficulties learning written language appear. These children typically have age-appropriate speech intelligibility, but problems are seen in learning both to recognize printed words and to spell (Dickman, 2003). Reading disability is strongly associated with phonological difficulties, so much so that a core phonological deficit has been proposed as the cause of RD (Fowler, 1991; Stanovich & Siegel, 1994; Snowling, 2000). While the relation between reading and sensitivity to phonological structure is likely bidirectional (Wagner, Torgesen, & Rashotte, 1994), there is wide consensus that RD stems from a phonological deficit, independent of the type or amount of reading instruction (Vellutino, Fletcher, Snowling, & Scanlon, 2004). As a result, children and adults with dyslexia have difficulty constructing, maintaining, and retrieving explicitly phonetic representations, causing a range of problems at the behavioral level on tasks such as verbal short-term memory, non-word repetition, learning of new phonological forms, word retrieval, and rapid naming. In particular, the phonological deficit associated with RD is observed in PA tasks, on which children and adults with RD perform especially poorly (e.g., Mann & Liberman, 1984; Nittrouer & Miller, 1999; Pennington, Van Orden, Smith, Green, & Haith, 1990; Pratt & Brady, 1988; Wagner & Torgesen, 1987). In sum, deficits on PA tasks precede and predict later RD and are among the most persistent deficits in adults with RD (e.g. Pennington et al., 1990). Moreover, deficits in PA are genetically correlated with RD (rg = .67 in Tiu, Wadsworth, Olson, & DeFries, 2001). This high genetic correlation means that about two thirds of the genetic influences acting on either PA or RD deficits are shared by both deficits. But nonetheless, the genetic correlation does not specify the nature of the relation, which could run from RD to PA instead of the reverse, and may not be specific to PA.
The phonological theory of RD has considerable empirical support, but questions about it remain (Byrne, 2009; Castles & Coltheart, 2004; Pennington, 2006; Scarborough, 2005; Treiman et al., 2008). These questions arise because 1) letter knowledge is more predictive of later reading than is PA (Scarborough, 2005); 2) pre-dyslexic children have deficits in language, letter knowledge, and learning rate in addition to their deficits in PA (Scarborough, 2005); 3) we lack definitive evidence that selectively manipulating PA in preschool improves later reading because experimental training studies purporting to demonstrate a causal link between PA and reading skill have frequently not restricted the training to PA (Castles & Coltheart, 2004); 4) the genetic influences shared by PA and later reading skill are not specific to PA, but are shared with general verbal ability, print knowledge, and rapid serial naming (Byrne, 2009); and 5) as mentioned previously, children lacking PA can still use letter names to learn letter sounds to begin to read (Treiman et al., 2008). Thus, it may be more appropriate to view a PA deficit as an important risk factor for later RD among others, but not as a sufficient cause of later RD, as the phonological theory holds. By studying children for whom there is a disassociation between earlier PA deficits and later RD, as is true for the majority of SSD children in the current Denver SSD sample, we can shed light on other risk and protective factors affecting literacy outcome.
Moreover, although children with both SSD and RD exhibit deficits in PA, the question has yet to be answered regarding whether the deficit in phonological representations underlying the PA deficit is the same for both disorders. One reason to suspect that it may be the same is that the two diagnoses are frequently given to the same children. Comorbidity of SSD with RD is estimated to be 25-30 percent (Gallagher, Frith, & Snowling, 2000; Pennington & Lefly, 2001; Snowling, 1990), suggesting that the two disorders may be related to the same underlying deficit, and yet present slightly differently. Several possibilities can be entertained for why that might be. Perhaps children with SSD and RD share the same phonological deficit, but it differs in severity.
One version of this severity hypothesis was proposed by Harm & Seidenberg (1999) based on connectionist simulations of speech perception and reading development. This theory holds that the severity of deficits in phonological representations determines whether problems are observed in both speech perception and reading (associated with more severe deficits in phonological representations) or only in reading (associated with less severe deficits). Extending their theory to children with SSD and/or RD, Pennington (2006) reasoned that the severity hypothesis would predict that children with SSD and later RD must have a more severe deficit because it affects speech perception, production, and later reading, whereas children with RD without earlier SSD have a milder deficit in phonological representations that only affects reading development. This theory also predicts that SSD children without later RD must have a different form of SSD (without deficits in phonological representations or at least milder deficits than are found in RD only children) compared to children with SSD+RD. Because 70-75 percent of children with SSD in preschool do not go on to be diagnosed with RD, this theory must also hold that most children with SSD have this different form of SSD, not associated with problems in speech perception and PA (see Rvachew, 2007, which provides some evidence for this subtype hypothesis). However, the previously discussed findings from the Denver SSD longitudinal study (Peterson et al., 2009; Raitano et al., 2004), which was explicitly designed to test this severity hypothesis, are not consistent with the subtype hypothesis; PA and other phonological deficits were pervasive in our large SSD sample, but only a minority developed later RD. Even children who did not develop later RD had persisting deficits in PA. These findings lead us to postulate that additional cognitive risk or protective factors in addition to a PA deficit determine literacy outcome in SSD. Another possibility, tested in the present study, is that the nature of the phonological deficit in SSD without RD is distinct from that found in SSD+RD or RD only. So, the current study sought to further explore the nature of the deficits underlying these disorders by employing multiple measures of speech perception in children with SSD, RD, and SSD+RD.
While there is agreement that phonological development is impaired in SSD and RD, there are different theories regarding exactly how it is impaired. These competing theories can be distinguished by how they regard the role of the phonetic segment in speech, language, and reading development. Most reading researchers have embraced a segmental theory, exemplified by the segmentation hypothesis proposed by Fowler (1991) as an elaboration of the phonological model of RD. In turn, that hypothesis was based on the work of others, such as Ferguson and Farwell (1975), Menn (1983a, 1983b), Nittrouer and Studdert-Kennedy (1987), and Waterson (1971) regarding typical speech development. The segmentation hypothesis proposes that as children’s vocabularies develop, lexical representations become increasingly segmented, such that first they are in the form of whole word shapes, then syllables, followed by onsets and rhymes, and finally by individual phonemes. Eventual PA difficulties stem from phonological representations that fail to keep pace with typical developmental changes in specificity. In the current study, two of the speech perception tasks examined children’s sensitivity for signal components clearly affiliated with phoneme representations. The third speech perception task was designed to explore relatively recent hypotheses concerning speech perception, phoneme representations, and the source of PA difficulties. Until recently, primary hypotheses concerning the source of PA difficulties have focused on acoustic properties clearly affiliated with phonetic segments. However, perhaps being sensitive to such properties is not sufficient to support the formation of well-defined phonological representations. Perhaps children must also be sensitive to speech-relevant acoustic structure that extends over ranges broader than isolated phonetic segments and perhaps it is important for listeners to be able to integrate across all kinds of acoustic structure, those obviously affiliated with phonemic segments as well as those more broad in nature, in order to derive linguistic structure.
1.2 Speech Perception and Phoneme Representation: Bottom-up effects
Phoneme representations can be thought of as learned functions that, over the course of development and using information from a variety of contexts, map acoustic structure onto the abstract categories we call phonemes. The precision with which individuals accomplish this mapping varies cross-linguistically (Caravolas and Landerl, 2010) and across ages (Treiman and Zukowski, 1991). As a result, the distinctiveness in representation of separate phonemes varies. For instance, on tasks requiring the manipulation of a single phoneme in an utterance, Chinese adults who only read logographic characters perform similarly to illiterate Portuguese adults, and are significantly worse than Chinese adults who learned to read both the traditional logographic characters and an alphabetic system (Read, Zhang, Nie, & Ding, 1986; Morais, Cary, Alegria, & Bertelson, 1979). It has also been found that illiterate adults, like pre-reading children (Treiman and Zukowski, 1991) have the ability to analyze utterances into syllables, and to identify rhyming, despite lacking skill with more segmented phonemic analysis (de Santos Loureiro et al., 2004). Normally developing children refine their phoneme representations only once they begin to learn how to read (e.g., Olson, Wise, & Forsberg, 1996), possibly due to necessary refinement of the phoneme representation in order to associate the phoneme with a particular letter, or grapheme (Castles and Coltheart, 2004). The development of this phoneme-grapheme correspondence may drive the strong correlation between the acquisition of the alphabetic system, and the ability to perform explicit manipulations of phonetic segments. Because precise representations are needed in order to comprehend alphabetic orthographies, it would be useful to have a way of evaluating the precision of those representations.
While theoretically appealing, it is difficult to develop methods of quantifying the precision of individuals’ phonemic representation, or of how well they perform the mapping of acoustic to phonetic structure. In the literature on speech perception in children with developmental language disorders or RD, many studies have focused on the labeling of phonemes based on manipulation of individual acoustic cues. For example, researchers designed stimuli in which all acoustic properties were held constant except for one, such as voice onset time, which was varied continuously. Voice onset time (VOT) is defined as the time between the release of a supralaryngeal closure and subsequent laryngeal pulsing (Lisker & Abramson, 1964). It is, so to speak, the quintessential acoustic cue. In English, short lags in the onset of voicing (laryngeal pulsing) are perceived as voiced stops [b, d, g] and long lags in VOT are perceived as voiceless stops [p, t, k]. Stimuli can be designed in which VOT varies from values signaling voiced initial stops to values signaling voiceless initial stops. When typical participants are presented with stimuli in which VOT changes across stimuli in steps of equal size, but with the rest of the cues remaining constant, they do not demonstrate continuous labeling functions. That is, there are not equivalent changes in perception across VOT steps. Instead there are regions at either end of the continuum where labeling is fairly stable. The region of ambiguous labeling is restricted to rather brief sections at the middle of the continuum. In other words, perception is categorical (e.g., Lisker & Abramson, 1970).
Studies have shown that infants can discriminate between syllables forming minimal pairs that are not part of the child’s language. Only with exposure over the first year of life do children begin to lose their abilities to discriminate minimal pairs not found in their native language (Jusczyk, Houston, & Newsome, 1999; Werker & Tees, 1983). But although responses from one-year-olds suggest recognition of adult phonemic categories, perception remains immature for many years to come. In addition to the location of the VOT phoneme boundary shifting for some contrasts as children get older (Ohde & Sharf, 1988), the slope of the VOT labeling function becomes steeper with age (Hazan & Barret, 2000; Holden-Pitt, Hazan, Revoile, Edward, & Droge, 1995; Walley & Flege, 1999). Even at the age of 12 years, typically developing children are not demonstrating labeling functions as sharp as those of adults (Hazan & Barret, 2000).
When the performance of children with RD is compared to age-matched children, some studies have reported that labeling functions are even shallower in children with RD (e.g., Bogliotti, Serniclaes, Messaoud-Galusi, & Sprenger-Charolles, 2008; Chiappe & Chiappe, 2001; Godfrey, Syrdal-Lasky, Millay, & Knox, 1981). However, other studies have only found very weak evidence or found that only a subset of RD participants had abnormal labeling performance (Adlard & Hazan, 1998; Joannise, Manis, Keating, & Seidenberg, 2000; Manis et al., 1997; McBride-Chang, 1996; Werker & Tees, 1987). Far fewer studies have examined how children with SSD label stimuli varying along acoustic continua, in spite of the fact that reduced PA abilities and high rates of comorbid language impairment are observed for these children. Those that have, however, have found that these children show poor sensitivity to the acoustic cue manipulated (e.g., Hoffman, Daniloff, Bengoa, & Schuckers, 1985; Rvachew & Jamison, 1989). Other studies have examined how well children with SSD can identify natural members of minimal pairs likely to create difficulty in production, such as /r/ vs. /w/, /s/ vs. /∫/, and /s/ vs. /ts/ (Ohde & Sharf, 1988; Raaymakers & Crul, 1988). Looking across studies it has been found that children who could not produce the difference between the phonemes or consonant clusters also could not perceive the differences.
It has become clear that there is a need to examine speech perception in these populations from other perspectives. One reason is that the studies demonstrating categorical perception of acoustic cues underlying native phonetic categories typically manipulate only one cue. In fact, several acoustic properties generally define phonetic categories, and the way that perceptual attention is distributed across those properties cannot be examined with traditional one-cue methods. The Developmental Weighting Shift theory (DWS; Nittrouer, Manning, & Meyer, 1993) suggests that the kinds of acoustic properties to which a child attends change as the child gains experience with a native language. Methods developed based on this theory attempt to present speech cues in a more natural manner, examining preference for one cue over another, instead of manipulating only one phonetic cue. Results from a series of studies using such methodology (e.g., Nittrouer, 1992; 1996a; Nittrouer & Miller, 1997; Nittrouer & Studdert-Kennedy, 1987) have shown that children initially attend to dynamic acoustic properties related to vocal tract movement from one constriction into another: that is, the formant transition. As a child becomes more skilled with the native language, between 3.5 and 7.5 years of age, attention shifts to more specific kinds of cues, such as silent gaps (indicating periods of vocal tract closure), durations of units such as the vowels preceding final stops, or the spectral distribution of fricative noises. Accordingly, the DWS theory has been supported by studies of acoustic cues such as syllable duration and formant onset frequency (Hicks & Ohde, 2005; Nittrouer, 2004; Ohde & Haley, 1997; Walley & Carrell, 1983).
The DWS has been studied in groups with varying speech and language difficulties. For example, Nittrouer (1996b) found that children with both chronic otitis media (ear infections) and low socio-economic status (SES) showed delays in the acquisition of mature weighting strategies and PA, even with the contribution of nonverbal IQ removed. Nittrouer (1999) found similar results for children with RD, such that the phonologically impaired RD group used more immature weighting strategies. Similarly, Boada and Pennington (2006) reported that children with RD relied more on dynamic formant transition cues than both chronological-age-matched controls and reading-age-matched controls. Consistent with the hypothesis that the weighting of acoustic cues may be related to the organization of phonological representations, Boada and Pennington (2006) found significant correlations between speech perception strategies and measures of PA. Again, these results indicate that skill in all three domains (speech perception, phonemic awareness, and reading) are related and reduce the likelihood that reading experience alone drives PA or the precision of phoneme representations.
1.3 Global structure analysis
Another reason to suggest that the focus of speech perception research with children who have RD or SSD needs to be broadened is that the kind of acoustic structure examined heretofore has typically involved signal detail. Following basic studies of human speech perception, investigations into the deficits underlying RD and/or SSD have most often manipulated acoustic properties that are temporally brief and spectrally isolated. These are the properties that fit the original definition of acoustic cues (Repp, 1982). However, there is structure in the speech signal that is broader spectrally and longer temporally that also supports recovery of phonological representations. This level of structure has been termed “global,” and refers to the kind of structure that can only be resolved from signal stretches covering at least several syllables (Nittrouer, Lowenstein, & Packer, 2009). This kind of structure impacts the amplitude of a signal and arises from general postural settings of the vocal tract, and from the slow modulations in vocal tract shape and size.
Such structure can be examined in three key ways: through the amplitude envelope, through amplitude modulated, and through sine-wave speech. Different components of speech production affect signal amplitude differently, creating variations in the overall amplitude, or intensity, of the speech signal across time. These variations together comprise the amplitude envelope, or temporal envelope, as it is also known. The current study examined children’s abilities to use this amplitude envelope in their speech recognition Previous experiments looking at amplitude structure in speech perception divided the signal into several frequency bands, half-wave rectifying each band to derive the amplitude envelope, and multiplying noise bands by those envelopes. Using noise as the modulated signal has the intended purpose of largely removing spectral structure. Some of the first investigators to use this signal processing technique, a kind of vocoding, were Shannon, Zeng, Wygonski, Kamath, and Ekelid (1995), and they found that adults listening to their native language had sufficient information for accurate sentence recognition with roughly four bands. This experimental manipulation was ground-breaking because it demonstrated that listeners – at least adults hearing their first language – could recover linguistic structure, even when the acoustic details studied in traditional speech perception experiments, as well as spectral structure, were greatly reduced. Thus, global amplitude structure may be important to linguistic processing of heard speech signals, something that had never been studied in typical children, let alone in children with language disabilities.
Eisenberg, Shannon, Schaefer Martinez, Wygonski, and Boothroyd (2000) were the first to use this vocoding processing scheme to examine speech perception in children. Comparing the numbers of words recognized in the sentences presented, Eisenberg et al. found that children between 5 and 7 years old were significantly less accurate than adults and older children when fewer than eight channels were presented; all listeners were quite accurate with eight or more channels. This result was later replicated by Nittrouer et al. (2009), so it may be concluded that younger children are less skilled at using both the details of the signal (acoustic cues) as well as the global structure that provides information about syllabic and word structure.
A different line of research, exploring amplitude modulation, has indicated that insensitivity to amplitude changes in non-linguistic stimuli is associated with RD and language impairment. To study this phenomenon, researchers have modulated amplitude in non-speech tasks (Corriveau, Pasquini, & Goswami, 2007; Hamalainen et al., 2005; Lorenzi, Dumont, & Fullgrabe, 2000; Muneaux, Ziegler, Truc, Thomson, & Goswami, 2004; Richardson, Thomson, Scott, & Goswami, 2004; Witton, Stein, Stoodley, Rosner, & Talcott, 2002). For example, Goswami et al. (2002) asked children with or without RD to judge whether stimuli were comprised of a single element fluctuating in loudness, or two different elements, a distinct beat and a background sound. Very slow rise times (> 250 ms) of amplitude modulation are generally perceived as a continuous sound that varies in loudness. The sharper the rise time, the more likely people are to perceive two separate sounds. Children with RD continued to hear stimuli as consisting of two sounds at longer rise times than did normally developing 11-year-old children, leading the authors to speculate that children with RD have difficulty perceiving amplitude modulations in general. Follow-up studies indicated that the difficulty with rise time detection is not associated with the controversial disordered processing of rapid transient information tested in temporal order judgment tasks (e.g., Tallal, 1980). These results suggest instead that accurate detection of relatively slow amplitude changes indicating syllable structure are more important than the detection of rapid or transient cues for the development of phonological representations and literacy (Muneaux et al., 2004; Richardson et al., 2004).
More recently, research in this area has turned to measuring neurological processing of amplitude modulations. Rapid features in speech appear to be lateralized to left-hemisphere auditory areas (Joanisse and Gati, 2003; Abrams, Nicol, Zecker, and Kraus, 2006), while information associated with amplitude is lateralized to the right hemisphere (Abrams, Nicol, Zecker, and Kraus, 2008). Examining modulated amplitude processing in young students with a range of reading abilities, Abrams and colleagues (2009) found strong correlations between several variables related to the amplitude processing, including the degree of lateralization, and standardized measures of reading and PA, indicating a biological connection between impaired perception for slow amplitude signals and abnormal neurophysiological responses in weaker readers.
While vocoded speech preserves global amplitude structure, there is a way to process speech signals to largely eliminate traditional acoustic cues but preserve global spectral structure: It is known as sine wave speech. In this processing scheme, sine waves representing the center frequencies of the first three formants are generated from the speech signal. One study investigated speech perception in adults with RD using sine wave speech (Rosner et al., 2003) and found that adults with RD were significantly less accurate than adults without RD. Because those stimuli provided only formant trajectories, and labeling experiments have frequently shown that children with RD respond differently to those signal properties than do children with typical reading abilities (e.g., Boada & Pennington, 2006; Godfrey et al., 1981; Nittrouer, 1999; Werker & Tees, 1987), it is important to explore how children with RD would respond to signals that preserve global structure, but not by preserving formant transitions. For that reason, we elected to use vocoded stimuli in this study.
1.8 Top-down context effects
Rosner et al. (2003) attributed the poorer recognition for sine wave sentences exhibited by adults with RD, compared to adults without RD, to deficits in the ability to use linguistic context effects for speech recognition. However, without specifically quantifying the extent of these top-down linguistic effects, it is not possible to conclusively attribute the differences between groups to this phenomenon. In other words, the difference in recognition between groups was attributed to variability in how well listeners in the two groups could recover the original message from these impoverished signals using their familiarity with phonotactic, syntactic, and semantic regularities rather than from their abilities to perceptually organize the signals themselves. In designing this current study, it was hypothesized that any differences that might be found among groups would be attributable to differences in children’s abilities to recover coherent, linguistically relevant form from the vocoded stimuli. Therefore, we needed to be able to quantify top-down linguistic context effects in order to rule them out as the source of group differences, if any were observed.
Fortunately, metrics for quantifying these effects have been developed, and here we use one that was proposed by Boothroyd (e.g., 1968; Boothroyd & Nittrouer, 1988). This metric, known as the j factor, derives from the fact that the probability of recognizing a complete sentence is dependent on the probabilities of recognizing the separate words that comprise the sentence. If sentence context played no role in recognition, then the probability of recognizing a whole sentence correctly would be directly related to the probability of recognizing each of the words such that:
| (1) |
where ps is the probability of recognizing the complete sentence, pw is the probability of recognizing each word, and n is the number of words in the sentence. Words, however, can be recognized at poorer SNRs when presented in sentences rather than in isolation, and so sentence context itself must influence the perception of individual words. Therefore we can change (1) to:
| (2) |
where j is the number of independent channels of information, and is between 1 and n. We now have a way of solving for the effective number of information channels in the sentence:
| (3) |
In this formulation, the independent channels indexed by j are not appropriately viewed as actual words. Rather, j is a dimensionless factor that serves as an index of how strongly sentence context influences recognition. The smaller j is, the greater the effect of sentence context on recognition.
Nittrouer and Boothroyd (1990) investigated top-down linguistic contributions to sentence recognition for adults and children 4 to 6 years of age. Two kinds of sentences were developed for that study: sentences that provided clear syntactic structure, but no useful semantic information (syntax-only sentences) and sentences that provided clear syntactic structure, as well as strong semantic constraints (syntax + semantics sentences). All sentences were constructed from four monosyllabic words, and were embedded in noise at several signal-to-noise levels. In that study, mean j factors for the syntax-only sentences were 3.08 for children and 3.43 for adults. This difference was not significant, and indicates that children and adults effectively required slightly more than 3 independent channels of information to understand these sentences. On the other hand, evidence was obtained from the syntax + semantics sentences that children may not use semantic constraints as effectively as adults in sentence recognition. For that reason, sentences that provided clear syntactic structure, but no useful semantic information were used in this study. The participants in this study, all 10 or 11 years old at the time of testing, should be able to use these syntactic constraints, even if their language development was somewhat delayed. In addition, the sentences in this study consisted of four words, all monosyllables. The shorter sentences should help minimize memory demands, which would have been greater for the Rosner et al. (2003) study that used five to nine word sentences, including many multisyllabic words.
1.9 Current Study
In summary, this study investigated the abilities of four groups of children (SSD, RD, SSD+RD, and typical controls) to use three kinds of acoustic structure in speech perception: temporal fine structure (VOT), spectral fine structure (fricative noise spectra and onset formant transitions), and global structure (amplitude envelopes derived from vocoded sentences). These three sets of stimuli were well-distinguished by whether acoustic structure supported recovery specifically of phonetic segments (VOT and fricative stimuli), or broader, linguistically relevant form (vocoded sentences). This latter manipulation permitted us to inquire as to whether children with poor PA have difficulty only recovering phonetic structure, or if their problems extend to other kinds of linguistically relevant structures, as well, a question that has not been adequately addressed in past work. Including children with two distinct, but perhaps related disorders (as well as a comorbid group) allowed us to examine more closely if a single deficit underlies both disorders.
For the current study, the decision to include a VOT continuum was made partly because VOT is readily responded to in a categorical manner by almost all listeners, including infants (e.g., Eimas, Siqueland, Jusczyk, & Vigorito, 1971) and even animals of other species (e.g., Kluender, Diehl, & Killeen, 1987; Kuhl & Miller, 1978). This property is known to have a clear physiological correlate in the auditory periphery (e.g., Sinex, McDonald, & Mott, 1991), and even children with hearing loss who demonstrate other problems with speech perception are able to label these stimuli (Nittrouer & Burton, 2002). For these reasons it was suspected that if children with SDD and/or RD would be able to label any stimuli in a typical fashion, it would be these that varied in VOT. Having a demonstration of typical labeling would be useful because it would indicate that when delayed or deviant labeling functions are observed for these children it is not for reasons unrelated to their actual perception of the stimuli, such as attentional or cognitive factors.
The other two speech perception tasks were included in order to specifically address our main research questions, including: (1) How similar are the deficits in phonological representations that disrupt speech production in SSD to those that disrupt the decoding of printed words and nonwords in RD? (2) Do these deficits in SSD persist after the speech production problem has resolved? (3) If these deficits in phonological representations in SSD and RD are similar, how do we explain differences in clinical presentation, especially SSD without later RD and RD without earlier SSD? And (4) Are the deficits in these three groups exclusively at the “segmental” level, as is widely believed?
If a single deficit underlies both SSD and RD, children in all groups should perform similarly. If different deficits underlie these disorders, different patterns of performance across the tasks should be observed. In particular, if the phonological theory of RD is accurate, children with a history of SSD who do not develop a reading disability must have a different pattern of performance on speech perception tasks, indicating a different cause for their poor performance on PA tasks in the past, than children with RD. Additionally, inclusion of the comorbid group of children with SSD+RD allows us to examine the subtype hypothesis by directly comparing children diagnosed with SSD in preschool who go on to be diagnosed with RD in the early grades, to those children with SSD who do not later receive an RD diagnosis.
Based on previous findings within our lab, the prediction was that these groups that share PA deficits, but differ in RD outcome, also share similar problems detecting structure in the speech signal, thus challenging the phonological theory of RD. If these problems in speech perception extend beyond the segmental level, then the phonological theory of RD faces an even more serious challenge because the segmental theory of phonological development upon which it rests will need to be revised.
2. Material and Methods
2.1 Participants
Children in three of the four groups (SSD, SSD+RD, and Control) were drawn from a longitudinal study of SSD in which testing took place when children were 5 to 6 years of age, 7 to 8 years of age, and then for this report when children were 10 to 11 years of age. An additional group of children with RD were recruited from the Neuropsychology Clinic at the University of Denver, local reading tutors, and the Colorado Learning Disabilities Research Center (CLDRC) twins study. For most children, SSD diagnosis was completed by certified speech pathologists prior to participating in our study. For those that had not previously been diagnosed, diagnosis was performed by Richard Boada, the project co-PI and a certified speech pathologist. At the time of the current study children were not re-tested for persistence of SSD because so few children had persistent speech problems at age 8; however no obvious speech problems were noted by testers.
To qualify as having RD, children had to meet two criteria. First, they either had to have been previously diagnosed with a reading disorder or had to have a history of reading intervention. Second, they had to demonstrate a positive history of reading problems based on parental responses to the Learning Disability Questionnaire, an in-house instrument that is currently being developed within the Neuropsychology Clinic at the University of Denver. This questionnaire includes 7 items specific to reading, and responses range from 1 (“not at all”) to 5 (“always”). A child is considered to have a positive finding on the questionnaire if the mean score of answers to the seven questions is three or above. As important as it was to verify that the children in this RD group had histories of reading problems, it was equally as important to verify that there was no evidence of a comorbid SSD. To do that, parents completed another questionnaire, designed by the first author, asking detailed questions about the child’s development of speech production skills. All children in this group were found to have reached developmental milestones for speech production at typical ages and had not received any speech or language therapy. Children with RD were matched as closely as possible in age to participants in the other three groups.
To participate, all children had to pass audiometric screenings of the frequencies 500, 1,000, 2,000, and 4,000 Hz presented at 25 dB HL to each ear separately.
Table 1 shows demographic data for children in the four groups, including relevant non-speech perception tasks, age and an environmental variable associated with socio-economic status, parental years of education. One-way analyses of variance (ANOVAs) were performed on scores for each independent variable shown in Table 1. As can be seen, children’s ages at the time of testing and parental years of education were similar across groups. One-way ANOVAs were not significant for either of these variables.
Table 1.
Demographic data for children. Perceptual reasoning scores are from the WISC-IV. PPVT = Peabody Picture Vocabulary Test. TOWRE = Test of Word Reading Efficiency. Scores for those three tasks are given as standard scores. G-F Speech Errors = Number of errors on the Goldman-Fristoe Test of Articulation, administered at 5 years of age. PA raw = sum of items correct across the tasks of phoneme reversal and pig Latin. Standard deviations are shown in parentheses.
| N = | Control 16 |
SSD 17 |
RD 16 |
SSD+RD 17 |
One-way ANOVA result |
|---|---|---|---|---|---|
|
Age
(months) |
130.8 (6.0) |
132.7 (7.6) |
133.9 (9.1) |
129.1 (6.4) |
F (3, 62) = 1.34 |
|
Parental
Education (yrs) |
16.5 (1.0) |
16.7 (1.8) |
15.9 (2.1) |
15.4 (1.7) |
F (3, 62) = 2.23 |
|
Perceptual
Reasoning |
114.2 (9.3) |
109.9 (14.6) |
101.6 (11.1) |
94.8 (8.8) |
F (3, 62) = 9.85, p < .001 |
|
Processing
Speed |
107.5 (9.4) |
108.7 (12.8) |
94.4 (11.2) |
98.4 (14.3) |
F (3, 62) = 5.40, p < .01 |
| PPVT | 117.3 (10.6) |
109.5 (9.6) |
102.1 (6.0) |
97.2 (6.4) |
F (3, 62) = 18.04, p < .001 |
| TOWRE | 107.8 (13.4) |
103.1 (10.9) |
81.4 (9.5) |
83.9 (9.6) |
F (3, 62) = 24.34, p < .001 |
|
G-F
Speech Errors at Age 5 |
3.8 (2.6) |
20.4 (11.2) |
-- | 23.6 (13.3) |
|
| PA raw | 39.2 (7.6) |
37.8 (9.9) |
25.4 (9.7) |
24.7 (11.4) |
F (3, 62) = 10.49, p < .001 |
2.2 Cognitive Measures
2.2.1 Perceptual reasoning
In order to verify that no child was significantly impaired in non-verbal abilities, three subtests of the WISC-IV (Wechsler, 2003) making up the Perceptual Reasoning Index (the Block Design, Picture Concepts, and Matrix Reasoning tasks) were administered to all children. Means for all groups were well within normal limits, but analysis indicated a main effect of group, F (3, 62) = 9.85, p < .001, and post hoc comparisons with Bonferroni corrections (p < .05) showed that children in the Control group performed better than children in the other three groups, children in the SSD and RD groups performed similarly to each other, and children in the SSD group performed better than those in the SSD+RD group.
2.2.2 Processing Speed
The Coding and Symbol Search tasks of the WISC-IV were used to assess non-verbal processing speed for these children. Again, means for all groups were within normal limits, but analyses indicated a main effect of group, F (3, 62) = 5.40, p = .002, and post hoc comparisons with Bonferroni corrections (p < .05) showed that only children in the RD group had significantly poorer scores than children in the Control and SSD groups.
2.2.3 PPVT
All children were given the Peabody Picture Vocabulary Test, 3rd edition (PPVT; Dunn & Dunn, 1997). The PPVT-III is a receptive vocabulary task and does not require any reading or phonological output. Children simply point to the picture (out of a set of four) that illustrates the word spoken by the examiner. Although this task measures only receptive vocabulary, it often serves as a general measure of linguistic competency. Again, means for all groups were well within the normal range. Nonetheless, there was a significant group effect, F (3, 62) = 18.04, p < .001. Post hoc comparisons with Bonferroni corrections (p < .05) showed a steady worsening of scores from the Control to the SSD to the RD to the SSD+RD groups, such that children in the Control and SSD groups performed similarly, children in the SSD and RD groups performed similarly but the RD group performed worse than the Control group, and children in the RD and SSD+RD groups performed similarly but the SSD+RD group performed worse than both the Control and SSD groups.
2.2.4 Phoneme awareness (PA)
Two tasks measured PA. The first was a phoneme reversal task (Pennington & Lefly, 2001) consisting of 24 words with two or three phonemic segments. Children were asked to verbally produce the phonemic reversal of words presented orally by the examiner. They were told that they must reverse the sounds in words, not just the letters. Four training words were provided, with feedback, and 24 test stimuli formed this first part of the composite PA variable. These stimuli are provided in the appendix.
For the second part of the composite PA score, the pig Latin task, children heard 26 words that they needed to convert into pig Latin; no feedback was provided during testing. Practice was provided using eight words prior to testing, with feedback. Accuracy data from the 26 testing stimuli was added to accuracy data from the phoneme reversal task to create a PA composite score to be used as the dependent variable. These stimuli are also provided in the appendix.
Total numbers of items completed correctly are shown in Table 1. A significant group effect was found, F (3, 62) = 10.49, p < .001. Post hoc comparisons with Bonferroni corrections (p < .05) revealed that the two groups of children with RD performed similarly: The post hoc comparison was not significant for these two groups. Children in the Control and SSD groups performed similarly to each other (i.e., no significant post hoc comparison), and better than both groups of children with RD. For the comparisons of each of the Control and SSD groups with each of the RD and SSD+RD groups results were significant.
At the time that the data reported here were collected, children in the SSD group showed no PA deficits. Relevant to the current study, however, is the fact that they had a history of mild deficits. The top two rows of Table 2 show mean scores for the same PA tasks described above when these children were tested at the two earlier times. (Children in the RD group are not included because they were not tested previously.) At 5-6 years of age, children in the SSD group performed more poorly than children in the Control group, t(31) = 2.0, p = .054, but by 7-8 years of age there was no difference between those groups. Thus, over the course of two years and during early reading instruction, these children managed to acquire sufficient sensitivity to phonetic structure to perform PA tasks as do typically developing children. This finding differs from that of some others, who have shown that children with SSD who had poor PA in kindergarten continued to have poor PA at the end of first grade (Rvachew, 2007).
Table 2.
Mean PA scores for the three groups of children tested at 5-6 and 7-8 years of age are shown in the top two rows. Mean percentages of phonemes repeated correctly in a non-word (NW) repetition task at the same ages are shown in the bottom two rows. Standard deviations are shown in parentheses.
| Control | SSD | SSD+RD | |
|---|---|---|---|
|
PA score
5-6 years |
11.3 (4.9) |
8.7 (5.1) |
4.9 (2.5) |
|
PA score
7-8 years |
28.4 (4.3) |
25.7 (1.8) |
18.7 (6.6) |
|
| |||
|
NW repetition
5-6 years |
85.30 (7.08) |
71.47 (7.55) |
58.74 (7.97) |
|
NW repetition
7-8 years |
91.18 (4.24) |
82.35 (6.63) |
76.19 (6.42) |
In addition to those PA scores, a non-word repetition task had been administered to the children in the Control, SSD, and SSD+RD groups at earlier test times. Mean percentages of phonemes repeated correctly are shown in the bottom two rows of Table 2. One-way ANOVAs showed significant group effects at both the first test time, F(2, 45) = 48.18, p < .001, as well as the second, F(2, 45) = 25.05, p < .001, and post hoc comparisons with Bonferroni corrections (p < .05) revealed differences between the Control and SSD groups at both of those times. So, on this task children with SSD continued to show deficits, at least through age 7 to 8 years. Consequently, it is fair to conclude that children in the SSD group had delayed development of PA. However, it is clear from the continuum of scores represented on these tasks that these children were less delayed than the children in the comorbid SSD+RD group.
2.3 Grouping variables
2.3.1 TOWRE
In order to verify reading ability, all children were given the Test of Word Reading Efficiency (TOWRE; Torgesen, Wagner, & Rashotte, 1999). The TOWRE measures how many single words and non-words are accurately read within 45 seconds, giving an estimate of the child’s reading fluency. As expected, there was a significant main effect of group, F (3, 62) = 24.35, p <.001. Children in both the RD and SSD+RD groups performed more poorly than children in the SSD and Control groups, and scored more than one standard deviation below the typical mean on this test of reading ability.
2.3.2 G-F Speech Errors
SSD is a disorder that is generally diagnosed during the preschool years. Symptoms often attenuate during the early elementary grades. For that reason, scores from the Goldman-Fristoe Test of Articulation (Goldman & Fristoe, 1986) administered when these children were 5 years of age are shown on Table 1. Raw scores are shown here because they are more precise than standard scores, allowing more accurate comparison across groups. As can be seen, the two groups of children with SSD at the time of the test made more errors than did children in the Control group, F (1, 49) = 8.65, p < .01. Children in the RD group were not tested because they were not in an experimental protocol at 5 years of age.
2.4 Speech Perception Stimuli
Three sets of stimuli were generated. The VOT and fricative-vowel stimuli both used a 10-kHz sampling rate, with low-pass filtering below 4.8 kHz.
2.4.1 VOT
These stimuli were taken from a study examining labeling of syllable-initial stops with varying VOT by children with and without hearing loss (Nittrouer & Burton, 2002). The stimuli were constructed with natural burst noises and synthetic vocalic portions. Ten milliseconds of burst noise was excised from natural tokens of a male speaker saying /da/ and /ta/, and used in the construction of these stimuli. Because /d/ and /t/ share the same place of closure, the spectra of these noises do not differ greatly: A /t/ noise just has a little more energy in the high-frequency regions. The nine vocalic portions were 270 ms long. The first formant (F1) transition took place over the first 40 ms, and changed during that time from 200 Hz to its steady-state frequency of 650 Hz. The second and third formants (F2 and F3) changed over the first 70 ms of the vocalic portions. F2 started at 1800 Hz, and fell to its steady-state frequency of 1130 Hz. F3 started at 3000 Hz, and fell to its steady-state frequency of 2500 Hz. F4 and F5 were held constant at their default frequencies of 3250 Hz and 3700 Hz, respectively. The f0 was constant at 120 Hz for the first 70 ms, and then fell linearly through the rest of the vocalic portion to an ending frequency of 100 Hz. The onset of voicing was cut back in 5-ms steps from 0 ms to 40 ms, making a total of nine vocalic portions. With the 10 ms of burst noise, this means that VOT actually varied from 10 to 50 ms. There was no source provided to F1 before the onset of voicing. Aspiration noise was the source to the formants higher than F1 before the onset of voicing. Each burst noise was combined with each vocalic portion, making 18 stimuli in all.
2.4.2 Fricative-vowel syllables
These stimuli were used previously by Nittrouer (1992; 1996a; 1996b; Nittrouer & Lowenstein, 2009), and consisted of synthetic fricative noises concatenated with natural vocalic portions. The noises were single pole, and 150 ms in duration. The center frequencies of these noises varied from 2.2 kHz to 3.8 kHz in 200-Hz steps, making a total of nine such noises. The vocalic portions were taken from an adult, male speaker saying Sue and shoe. The fricative noises were removed from those samples. Here we indicate which context the vocalic portion came from by placing the original fricative label in parentheses. Five portions from each fricative context were used that matched in terms of duration and intonation contour. The five /(∫)u/ portions had a mean duration of 348 ms, and a mean f0 of 97 Hz. The five /(s)u/ portions had a mean duration of 347 ms, and a mean f0 of 99 Hz. The five /(∫)u/ portions had formant transitions appropriate for a preceding /∫/, and the five /(s)u/ portions had formant transitions appropriate for a preceding /s/. Each of these ten vocalic portions was concatenated with each of the nine synthetic fricative noises, making a total of 90 stimuli: five tokens each of 18 stimuli (9 noises × 2 formant transitions).
2.4.3 Vocoded sentences
Thirty-six four-word sentences from Nittrouer et al. (2009) were used. All sentences consisted entirely of monosyllabic words, were syntactically appropriate for English, but semantically anomalous. Most of these sentences had some version of a subject-verb structure (e.g., Dumb shoes will sing. Knees talk with mice.), although five had a command structure (e.g., Paint your belt warm.) Furthermore, all words were selected to be within the vocabulary of the typically developing children between 4 and 6 years of age, and so the 10 to 11-year-olds in this study should have been familiar with them. Finally, memory load was reduced by having sentences that consisted of just four monosyllabic words. Six sentences were used for practice, and thirty were used for testing. Sentences were recorded by an adult male speaker of American English at a 44.1-kHz sampling rate with 16-bit digitization. All sentences were equalized for mean RMS amplitude across sentences before any processing was done.
To create the vocoded stimuli, a MATLAB routine was written. Both four- and eight-channel stimuli were created. All signals were first low-pass filtered with an upper cut-off frequency of 8,000 Hz. For the four-channel stimuli, cut-off frequencies between bands were 800, 1,600, and 3,200 Hz; for the eight-channel stimuli, cut-off frequencies were 400, 800, 1,200, 1,800, 2,400, 3,000, and 4,500 Hz. Each channel was half-wave rectified, and results used to modulate white noise limited by the same band-pass filters as those used to divide the speech signal into channels. Resulting bands of modulated noise were low-pass filtered using a 160-Hz high-frequency cut-off, and combined. These stimuli were used previously by Nittrouer et al. (2009), and a complete list of the sentences can be found there.
2.5 Procedures
Children were first given the hearing screening, and administered the tasks from the WISC-IV, TOWRE, PPVT, and the two PA tasks. The three speech perception tasks (VOT, fricative-vowel syllables, and vocoded sentences) were then given, in random order across participants. The entire session took between two and two and a half hours. Breaks were given as needed to help maintain attention to the tasks and children were regularly rewarded with play money that could be exchanged for real money at the end of the testing session.
2.5.1 VOT and Fricative-Vowel Syllables
Procedures for the VOT and fricative-vowel syllables were identical. Stimuli were presented auditorily one at a time, and children had to assign one of two response labels to each. They indicated their choice by pointing to one of two pictures, and saying the “name” of that picture. The label sue corresponded to a picture of a girl, and shoe corresponded to a shoe. Pictures of a horse and a sea serpent were used for da and ta. Children were told that these were the names of the animals. The experimenter entered children’s responses into the computer.
Two kinds of training were provided. Initial training on responding to the words sue/shoe or da/ta was done with natural tokens produced by the experimenter in which the child was asked to point to the picture that matched the given name while simultaneously saying the name of that picture. Having listeners both point to and say their response served first as a check that they were appropriately associating the correct picture with each label. Later, during testing, it was an indication that they were consistently paying attention. After successful training with live voice, the participant put on headphones attached to the computer and he or she heard the best exemplars of the two categories involved in the test. For sue, for example, the best exemplar was the 3.8 kHz noise combined with the /(s)u/ vocalic portion. Again the child was asked to point to one of two pictures while saying the name of the picture. For this training, each end point was presented five times each, with order randomized. The child had to respond correctly 9 out of 10 times in this training phase to proceed to the testing phase. In this way it was assured that children were able to associate each label with the correct picture reliably.
During testing, stimuli were presented in five blocks of 18, consisting of all stimuli for the set. In order to maintain motivation, all participants were rewarded with 50 cents after each block of 18 and notified as to how many blocks they completed and how many they had remaining. As a check on whether children maintained general attention or not, the numbers of correct responses to the endpoint stimuli throughout testing were examined. These stimuli were distributed among all other stimuli during testing. Therefore, finding that children continued to respond accurately to these endpoints, which they had shown they could do during practice, indicated that they paid attention throughout the entire session. Children had to continue responding with 90 percent or greater accuracy to these endpoint stimuli during testing in order for their data to be included in analysis.
After testing, probit functions were fit to the resulting data. Closely related to logit functions, these functions are effectively z-transformations, only with 5 added to each z-score so that no value is negative. From this distribution, a mean (i.e., the point on the function where the probability of either response is the same) and a slope are derived. The mean is generally termed the phoneme boundary, as it is the point at which responses change from being primarily one category to the other. The separation between functions is defined at these phoneme boundaries, and serves to estimate the extent to which the listener based responses on the property defining the two separate functions. For the VOT stimuli, that property was whether the noise burst was appropriate for a /d/ or a /t/. For the fricative-vowel syllables, that property was whether the voiced formant transitions were appropriate for a syllable initial /s/ or /∫/. The greater the separation between functions, the greater the perceptual weight assigned to that acoustic property.
The slope of the functions serves as an estimate of the perceptual weight assigned to the acoustic property that varied across the continua. For the VOT stimuli, that was VOT. For the fricative-vowel syllables, that property was the center frequency of the fricative noise.
2.5.2 Vocoded sentences
For this task participants were asked to repeat all the words that they heard in a given sentence. For training purposes, children heard the same sentence twice in a row, first in a natural form and then in the processed form. After each presentation the child was asked to repeat the sentence. During testing, the child heard each processed sentence, twice in a row. After each presentation, the child repeated the sentence as best as possible. Every child heard all thirty sentences in a random order. Half of the sentences were presented as 8-channel vocoded signals, and half were presented as 4-channel vocoded signals. The software randomly chose which sentences to provide as 8- and 4-channel signals at the start of testing for each participant. Following the experimental task, all sentences were presented one more time in their non-vocoded format in order to verify that the children heard the words correctly under normal circumstances.
For statistical analyses, the mean numbers of words repeated correctly across the two trials served as the dependent variable. Because there were 15 sentences in each of the 4- and 8-channel conditions, maximum correct was 60 words. In addition, j factors were computed for each child. This analysis informed us about top-down linguistic context effects across groups.
3. Results
This study seeks to explore the similarities and differences in phonological representations, as measured by different speech perception tasks, in three different clinical groups: SSD only, RD only, and SSD+RD (individuals with a history of SSD and current RD). In order to explore these potential differences among clinical groups and a control group, each speech perception task is analyzed independently.
Prior to conducting inferential statistics, all dependent variables were checked for skewness, kurtosis, and outliers. All variables met criteria for normality. One child in the SSD+RD group was found to have an extraordinarily high number of errors on the sentence recognition post test (32 errors, compared to an average of 5 for the rest of the group). Her data for that task were removed. Data were lost for one child in the SSD-only group on the fricative labeling task due to computer error. Her data were removed for that one task only.
3.1 VOT
Figure 1 illustrates mean labeling functions for each group for the VOT stimuli. Table 3 shows mean phoneme boundaries and slopes for each group, as well as mean separation between phoneme boundaries. It is apparent that outcomes were similar across groups, and statistical analyses did not reveal a significant group effect either for mean slope or for the separation between the labeling functions.
FIGURE 1.
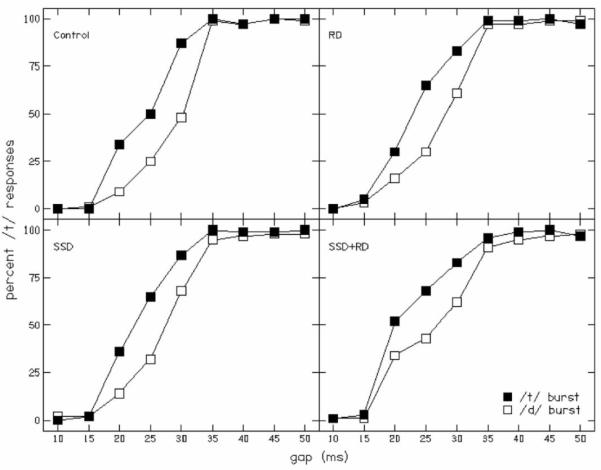
Labeling functions for the VOT task. Statistical analyses did not reveal a significant group effect either for mean slope or for the separation between the labeling functions. RD = Reading Disability, SSD = Speech Sound Disorder.
Table 3.
Outcomes for the VOT labeling task. Mean phoneme boundaries (in ms of VOT), mean separation between those phoneme boundaries (again in ms of VOT) and slopes (in probit units per ms of change in VOT) for each group are shown, with standard deviations in parentheses.
| Control | SSD | RD | SSD+RD | |
|---|---|---|---|---|
| Phoneme boundaries | ||||
| /d/ burst | 28.6 (2.3) |
27.2 (3.4) |
27.6 (3.3) |
26.4 (4.6) |
| /t/ burst | 24.2 (2.7) |
23.2 (2.7) |
23.9 (3.9) |
22.7 (4.2) |
| Separation |
4.4
(1.9) |
4.1
(2.2) |
3.7
(2.5) |
4.5
(3.6) |
|
| ||||
| Slope | ||||
| /d/ burst | 0.25 (0.11) |
0.24 (0.10) |
0.21 (0.09) |
0.18 (0.08) |
| /t/ burst | 0.23 (0.06) |
0.23 (0.08) |
0.23 (0.08) |
0.23 (0.11) |
| Mean Slope |
0.24
(0.07) |
0.23
(0.07) |
0.22
(0.07) |
0.21
(0.08) |
3.2 Fricative-vowel syllables
Figure 2 shows mean labeling functions for each group, and Table 4 provides mean phoneme boundaries and slopes. Regarding the separation between phoneme boundaries, it appears as if these separations are greater for all three clinical groups than for the Control group. Surprisingly, however, a one-way ANOVA failed to reveal a significant group effect [F(3, 61) = 2.07, p = .11], an outcome that differs from results of earlier investigators (Boada & Pennington, 2006; Nittrouer, 1999) who found delays in the DWS for children with RD. In those studies, children with RD, and so with poor PA, weighted formant transitions more in these very same fricative-vowel stimuli than did children with age-appropriate PA, leading to greater separations between functions based on formant transitions. But although the effect was not significant, there appears to be a trend for children in the clinical groups to have more widely separated labeling functions, suggesting greater weighting of those formant transitions.
FIGURE 2.
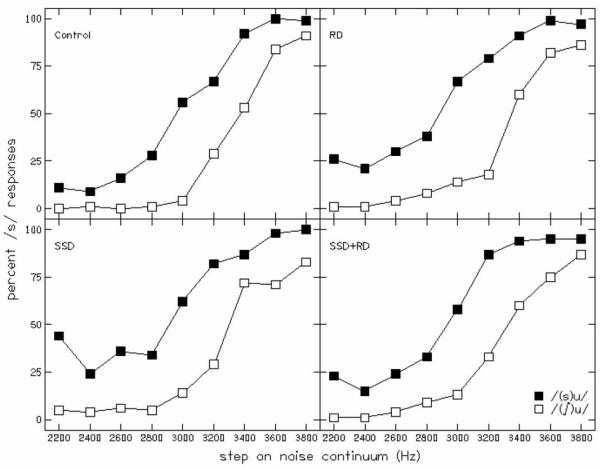
Labeling functions for fricative-vowel syllables. Children in the SSD group and RD group weighted formant transitions more than children in the Control group. Mean slope for the Control group was significantly different from those for all three clinical groups. RD = Reading Disability, SSD = Speech Sound Disorder.
Table 4.
Outcomes for the fricative labeling task. Mean phoneme boundaries (in Hz of fricative noise), mean separation between those phoneme boundaries (again in Hz) and slope (in probit units per kHz of fricative noise) for each group are shown. Standard deviations are in parentheses.
| Control | SSD | RD | SSD+RD | |
|---|---|---|---|---|
| Phoneme boundaries | ||||
| /(∫)u/ | 3381 (133) |
3404 (264) |
3421 (260) |
3359 (162) |
| (s)u/ | 2916 (263) |
2676 (272) |
2720 (311) |
2825 (253) |
| Separation |
474
(238) |
728
(409) |
701
(395) |
534
(320) |
|
| ||||
| Slope | ||||
| /(∫)u/ | 5.21 (2.28) |
3.47 (1.81) |
3.72 (1.62) |
3.57 (2.27) |
| /(s)u/ | 3.93 (2.00) |
1.88 (0.80) |
2.85 (2.06) |
2.77 (1.73) |
| Mean slope |
4.57
(1.85) |
2.68
(1.03) |
3.28
(1.41) |
3.16
(1.92) |
Additionally, we were mindful of the fact that significant group differences were observed for three cognitive and linguistic factors: perceptual reasoning, processing speed, and PPVT scores. Therefore, we computed Pearson product-moment correlation coefficients between each of those measures and the measure of separation between phoneme boundaries. None of those correlation coefficients was significant (p > .1).
Turning our attention to the slopes of the functions, which indicate the amount of weight assigned to the fricative-noise spectra, it is apparent that mean slope across the two labeling functions did show a significant group effect, F(3,61) = 4.25, p = .009. Post hoc t tests (with a Bonferroni correction) revealed that mean slope for the Control group was significantly different from the SSD group (p < .05) and was approaching significance for a comparison with the SSD+RD group (p < .1). Cohen’s ds (Cohen, 1988) were computed on these differences, and these values were 1.26 and 0.75, respectively, for the two comparisons.
Again, we computed Pearson product-moment correlation coefficients for each of the measures of perceptual reasoning, processing speed, and PPVT against mean slopes of the labeling functions. Only the correlation coefficient between mean slopes and PPVT scores was significant, r(65) = .38, p = .008. Thus, these two measures have roughly 11 percent of their variability in common. It’s difficult to assume any cause and effect relationship with this result since the only words associated with the task were “sue” and “shoe”.
3.3 Vocoded sentences
Table 5 provides the mean numbers of words (out of 120) repeated correctly by each group in the post-test presentation of unprocessed sentences. A one-way ANOVA performed on these numbers showed a significant group effect, F(3,60) = 5.59, p = .002, but post hoc comparisons revealed a significant difference only between children in the Control and SSD+RD groups. Cohen’s d for this contrast was 1.23.
Table 5.
Mean numbers of words repeated correctly in a post-test of sentence recognition with unprocessed signals. The numbers in parentheses are the standard deviations.
| Control | SSD | RD | SSD+RD | |
|---|---|---|---|---|
| Words repeated correctly |
117.25 (1.34) |
116.12 (1.45) |
115.38 (1.89) |
114.47 (2.90) |
Figure 3 shows mean correct word recognition for the 8- and 4-channel vocoded sentences. This information is also provided in Table 6. It is apparent that children in all three experimental groups repeated fewer words correctly in both vocoded conditions than did children in the Control group. A two-way ANOVA with condition as the within-groups factor and group as the between-groups factor showed significant effects of condition, F(1,60) = 440.32, p < .001, and group, F(3,60) = 8.30, p < .001. However, the Condition × Group interaction was not significant. This analysis was also performed using the numbers of words correctly repeated in the post test as a covariate, and the group effect was still significant, F(3,59) = 4.42, p = .007. That finding supports the suggestion that variation across groups in how well children could repeat these sentences was explained by something other than the factors that are typically viewed as supporting sentence recall abilities in general, such as syntactic knowledge and working memory. Presumably much of the reason that we did not find effects of these latter factors is because we explicitly tried to control for them by keeping syntactic structure simple and sentences short.
FIGURE 3.

Percent words recognized correctly (out of 60 possible) in 8- and 4-channel stimuli. Error bars are standard deviations. Children in the three experimental groups performed more poorly than children in the Control group, with the SSD vs Control effect lost after accounting for multiple comparisons. RD = Reading Disability, SSD = Speech Sound Disorder.
Table 6.
Outcomes for the sentence recognition task. Mean percent correct word recognition (out of 60 possible) for each trial in each condition, as well as means across the two trials for the amplitude envelope sentences are shown. Standard deviations are in parentheses.
| Condition and trial | Control | SSD | RD | SSD+RD |
|---|---|---|---|---|
| 8-channel | ||||
| Trial 1 | 28.88 (7.09) |
25.35 (5.04) |
24.00 (5.66) |
21.27 (5.75) |
| Trial 2 | 33.62 (5.66) |
28.94 (3.99) |
26.94 (3.75) |
24.6 (6.42) |
| Mean |
31.25
(6.04) |
27.15
(4.31) |
25.46
(4.60) |
22.93
(5.95) |
|
| ||||
| 4-channel | ||||
| Trial 1 | 13.75 (6.79) |
10.41 (5.06) |
9.13 (3.82) |
8.27 (4.70) |
| Trial 2 | 17.50 (6.83) |
13.29 (5.19) |
11.31 (4.57) |
9.80 (4.95) |
| Mean |
15.63
(6.68) |
11.85
(5.00) |
10.22
(3.89) |
9.03
(4.71) |
Looking at each condition separately, the effect of group was significant for both: 8- channel F(3,60) = 6.90, p < .001; 4-channel F(3,60) = 4.84, p = .004. In both conditions, post hoc t-tests also revealed that children in the three experimental groups performed more poorly than children in the Control group, but these comparisons were only significant for the contrasts of Control vs. RD and Control vs. SSD+RD when Bonferroni corrections (p = .05) were applied. Thus, children in the SSD group performed more similarly to children in the Control group than did children in the other two clinical groups. Cohen’s ds were computed between Control group and each of the other groups for sentence recognition scores in the 8- and 4-channel conditions. These are shown in Table 7.
Table 7.
Cohen’s ds between the Control group and each of the other groups for sentence recognition with the 8- and 4-channel vocoded stimuli.
| SSD | RD | SSD+RD | |
|---|---|---|---|
| 8-channel | 0.78 | 1.00 | 1.14 |
|
| |||
| 4-channel | 0.64 | 1.08 | 1.39 |
Again, we wanted to examine whether cognitive and linguistic factors may have explained any proportion of the variance in group differences, and so Pearson product moment correlation coefficients were computed between perceptual reasoning, processing speed and PPVT scores vs. numbers of words repeated correctly for the 8-channel and 4-channel stimuli. The PPVT scores were significantly correlated with each of the dependent measures: 8-channel r(64) = .51, p < .001; 4-channel r(64) = .44, p < .001. Therefore, it may be concluded that these scores shared 20 to 25 percent of their variance. Again, however, it is difficult to assign any kind of cause-and-effect relationship between these variables because receptive vocabulary is such a general measure of language ability and the words in these sentences were explicitly selected to be within the vocabularies of typically developing 4- to 6-year-olds.
Finally, j factors were computed to quantify the contributions of syntactic constraints on sentence recognition. These factors can not be validly computed when either word scores or sentence scores are below 5 percent or above 95 percent, and the only condition in which more than half of the children repeated more than 5 percent of whole sentences correctly was the second trial with 8-channel vocoded sentences. Therefore, j factors are reported for that condition only, and mean values are shown in Table 8. These values are similar across groups, and ANOVAs revealed no group effects. Consequently we may conclude that children in all groups used syntactic constraints to similar extents.
Table 8.
Mean j factors for the second trial of the 8-channel vocoded sentences. Standard deviations are in parentheses. Number of participants for whom j factors could be computed are shown in italics for each group.
| Control 12 |
SSD 15 |
RD 7 |
SSD+RD 8 |
|
|---|---|---|---|---|
| 8-channel | 3.58 (0.81) |
3.69 (0.79) |
3.09 (0.61) |
3.26 (0.57) |
4. Discussion
The main purpose of this study was to investigate how speech perception may differ in groups of children with histories of speech and/or reading disability. For that purpose, children in three clinical groups participated: SSD, RD, and SSD+RD. Children in the RD and SSD+RD groups had demonstrable PA deficits at the time of testing. Although they did not show evidence of PA deficits at the time of this testing, children in the SSD group had previously shown some mild delays in the acquisition of PA.
The three speech perception measures used here explored children’s sensitivity to segmental and global levels of speech structure by tapping into participants’ categorical perception of VOT, attention to a dynamic element of speech (the formant transition) compared to a static element (the fricative noise), and ability to use global structure in speech recognition. All children in the study responded similarly to the VOT labeling task, which means that they were able to use the temporal property manipulated in that task equally well. That is important because one prominent theoretical perspective holds that it is precisely the temporal aspect of speech with which children with language deficits struggle (e.g., Tallal, 1994), although this VOT task did not explicitly test rapid auditory processing, believed to be the key factor in an auditory temporal deficit. It is also the case that all four groups of children were able to use the burst release to similar extents, but that is a less interesting outcome because the bursts were extremely brief, and likely have little effect on labeling outcomes beyond ensuring that listeners hear these stimuli as having alveolar places of closure. Be that as it may, the finding that labeling was so similar across groups reassures us that children in the clinical groups were able to perform the task when they heard the stimuli as typically developing children hear them, and that they can label some stimuli in a categorical manner.
The evidence found here suggested a perceptual deficit for these children with speech and/or reading problems in other aspects of acoustic structure. Initial examination of the degree of separation between weighting functions, indicating sensitivity to the formant transition, did not reveal any difference between the groups, an outcome that differs from results of earlier investigators (Boada & Pennington, 2006; Nittrouer, 1999) who found delays in the DWS for children with RD. In those studies, children with RD, and so with poor PA, weighted formant transitions more in these very same fricative-vowel stimuli than did children with age-appropriate PA, leading to greater separations between functions based on formant transitions. Currently, there appears to be a trend for children in the clinical groups to have more widely separated labeling functions, suggesting greater weighting of those formant transitions, but the separation is not significant. The difference in outcomes across studies might be explained by the great variance found in this study for separation between functions. In turn, that variability may have occurred because children were presented with only five trials of each token in order to shorten the length of testing, rather than ten, which is customary.
However, analysis of the more dynamic signal in the task, the fricative noise, did reveal significant group differences. Children with a history of SSD (both the SSD only and SSD+RD groups, although the SSD+RD group had a result that was only approaching significance) weighted the spectra of the fricative noises to a lesser degree than children in the control group, as evidenced by shallower labeling functions, while the children with no history of SSD (RD only) were not statistically different from controls. Thus, the SSD children were more sensitive to structure in the speech signal, attending more to dynamic spectral structure than to static spectral structure. That weighting strategy represents one that is thought to be used at younger ages by typically developing children (e.g., Nittrouer, 1992). Looking across results for the analyses of separation between functions and slopes of those functions, it might seem that children in the RD only group showed performance that was most similar out of the three clinical groups to that of children in the Control group: the functions of children in the RD only group were most similar to children in the Control group, and those functions were roughly as close together as the functions of children in the Control group. Additionally, it is necessary to bear in mind that, in typically developing children, as the weight children assign to formant transitions diminishes, the weight they assign to fricative-noise spectra proportionately increases (e.g., Nittrouer, 1992; Nittrouer & Miller, 1997; Nittrouer & Studdert-Kennedy, 1987). Finding that these children with SSD or SSD+RD assigned similar weight to formant transitions as did the typically developing children but assigned less weight to fricative-noise spectra suggests that perhaps they were simply not very sensitive to the acoustic structure of these syllables at all.
When it came to outcomes for the vocoded stimuli, there was a clear ranking of abilities across groups of children. Children in the SSD group were able to integrate the sensory information in these signals in order to recover linguistically relevant structure better than children in the RD and SSD+RD groups, but not as well as children in the control group. Children in the RD group were better than children in the SSD+RD group. Certainly the newest and perhaps most important finding to emerge from these data involves these results showing that children with poor PA or histories of poor PA were not only insensitive to structure in the acoustic speech signal that very specifically underlies phonetic structure, but they demonstrated insensitivity to a more global level of structure, as well. These children were poorer at repeating words in sentences when presented with only vocoded signals. It may be the case that the perceptual deficit experienced by children with reading and other language-related problems is a general one of not being able to recover structure at any level in the acoustic speech signal. If this is the case, it means that our intervention programs may need to expand the scope of focus. Rather than placing the majority of our efforts on helping children with RD learn to recognize explicitly phonetic structure, we may need to think of ways to help them recover linguistically relevant form from the speech signal in an efficient manner. The significance of the finding reported here is that the perceptual deficit may be broader for these children than previously considered.
In addition to differences across groups in speech perception, receptive vocabulary was found to correlate with performance for both the fricative noise and vocoded stimuli. It is unlikely that this correlation reflects actual differences in knowledge of the words used in those tasks: The words Sue and shoe in the fricative task are well within a 10-year-old’s vocabulary and the vocoded stimuli were constructed from words well known to children as young as 5 and 6 years. Consequently all words should have been in the vocabularies of 10- to 11-year-olds who have PPVT scores within normal limits, which these children did. Instead, it is more likely that the development of mature perceptual strategies for speech signals contributes to the emergence of refined phonetic categories, thus shaping linguistic abilities more broadly. Support for that suggestion is obtained from the finding that a toddler’s ability to encode the fine phonetic details of speech when learning new words is correlated with both receptive and expressive vocabulary growth (Mills, Prat, Zangl, Stager, Neville, and Werker, 2004; Werker, Fennel, Corcoran, & Stager, 2002). Based on that evidence from typically developing children, Rvachew and Grawberg (2006) tested 4-year-olds with SSD on a speech perception task requiring the determination of whether or not a word is correctly pronounced, as well as on vocabulary, PA, and pre-literacy skills. Structural equation modeling showed that speech perception had a direct effect on articulation and PA, as well as an indirect effect on PA through vocabulary. Therefore, to the extent that we may speculate about the direction of a relationship between receptive vocabulary and our speech perception tasks, it could be that how children weight acoustic properties in the speech signal influences their language proficiency in general, and the PPVT actually indexes those abilities.
One problem with that proposal, however, is the finding that the SSD-only group demonstrated average (although significantly lower than children in the Control group) language skills, despite poor speech perception results on both the fricative noise and vocoded stimuli. Metsala and Walley (1998) have argued that vocabulary development drives phonetic segmentation, such that an expanding lexicon exerts pressure on the phonological system and representations need to become more refined. Based on this argument, a strong vocabulary would be driving PA and reading results, irrespective of speech perception deficits. When the children in the current study were tested at 5 years of age, the SSD-only group had a significantly lower mean vocabulary score than the Control group, but, mirroring current results, the average scaled score for the group (SS = 11.1) was above the population average. These results suggest that vocabulary acquisition may be driving PA and reading development, rather than speech perception driving vocabulary acquisition. Further research is necessary to disambiguate the two possibilities and provide a more accurate picture of the relationships among vocabulary, PA, and speech perception. Regardless, the view that one either has top-down influences on speech perception or bottom-up perception of cues is likely much too simple. Not only are there other levels of structure and integration in speech perception, but children listening to their native language do not have direct access to top-down linguistic structure; instead, they have to construct that structure from what they hear in the speech stream. Thus, it is too simple to say it is only a top-down effect unless one also has an account of how those top-down structures are constructed.
Concern may still exist that it is hard to reconcile the finding that children in the SSD-only group performed more poorly on the fricative labeling and sentence recognition tasks than did children in the Control group, even though children in the SSD group had similar PA to the children in the Control group. The suggestion being made here is that these children did demonstrate some sensitivity to linguistically relevant structure, but the degree of sensitivity and the specific properties being weighted revealed some developmental delay in the acquisition of mature speech perception strategies. Recall that PA testing with these children at 5 years of age had shown delay. The fact that performance on these particular PA tasks for these children reached age-appropriate levels before their sensitivity to linguistically relevant structure did supports the suggestion of Mayo, Scobbie, Hewlett, and Waters (2003) that it is the discovery of phonetic structure that spurs developmental shifts in perceptual strategies for speech, not the other way around. And again, that notion has clinical implications: Rather than explicitly trying to improve children’s auditory sensitivity to acoustic properties in the signal, perhaps instruction should focus on helping them first discover linguistic organization. In any event, we need to remind ourselves that previous work has explicitly defined sensitivity to phonological structure by performance on PA tasks and defined speech perception by performance on tasks involving discrete acoustic cues. Our understanding of the underlying constructs might be enhanced if we expand our conceptualizations of those skills. Where speech perception is concerned, that means designing studies to include signal properties that are both spectrally and temporally broader than traditional acoustic cues.
Returning to the four questions addressed by this study, we found: (1) phonological representation deficits may differ in part for children with speech production difficulties compared to those with decoding difficulties. The children with RD-only were less sensitive to the dynamic spectral structure, as would be expected for their age, than both SSD groups. Additionally, there was significant separation between the SSD-only and RD-only groups on the vocoded task, with the RD-only group performing worse. (2) Deficits in speech perception for children with SSD and SSD+RD persist well beyond the age at which the overt speech production problem has resolved. (3) Differences in reading outcome for children with pre-existing SSD seem to be related to several aspects of speech perception. Children in the SSD group, and the SSD+RD group to a lesser extent, appeared to be delayed in acquiring mature weighting strategies, but children in the SSD+RD group showed the poorest abilities when it came to perceptually integrating sensory information in order to recover a linguistically relevant form with the vocoded sentences. These results were not found to be related to the cognitive factors of perceptual reasoning or processing speed. (4) Deficits in speech perception in these three groups were not exclusively segmental, challenging the widely held segmentation theory (Fowler, 1991) upon which the phonological theory of RD is based. Taken together, these findings conflict with the phonological theory of RD because a deficit in underlying phonological representations does not invariably lead to a problem in either reading or even eventual PA performance. Even though SSD children without later RD have PA deficits before reading instruction begins, reading experience appears to improve their performance on PA tasks, even as their deficits in speech perception persist.
In summary, the experiment reported here examined sensitivity to several kinds of acoustic structure by children with three kinds of language-learning problems: SSD, RD, and SSD+RD. As has been found in earlier studies, children with these sorts of deficits were found to be delayed or disordered when it comes to how they weight acoustic properties in the speech signal. A finding not previously reported is that these difficulties were not found to be restricted to acoustic detail that is explicitly related to phonetic structure: Children with RD showed difficulty using more global structure, as well. For all three groups, problems were revealed for spectral and amplitude structure. These findings likely have clinical relevance concerning the level of structure on which intervention should focus. It appears as if our clinical interventions should be broadened to provide help to these children in learning to recognize structure at all levels, not just at the level of the phoneme.
CEU Questions
- Why is it important to explore speech perception in children with reading disability (RD)?
- RD is the result of congenital hearing loss.
- Children with RD typically have difficulty hearing phonemes in speech and we need to understand why.
- Speech perception plays a key role in phonological awareness development and children with RD typically have poor phonological awareness.
- There is a common genetic factor affecting both reading ability and speech perception.
- What is the difference between segmental and global processing?
- Global processing refers to the ability to recognize a word by processing all of the formant transitions available in the word. Segmental processing refers to processing each formant transition individually.
- Global processing involves focusing on the acoustic structure within a word, while segmental processing focuses on phonemes within a word.
- Segmental processing focuses on acoustic structure while global processing focuses on phonemes.
- Segmental processing involves attending to details of the acoustic structure so that a person can segment a word into component syllables and phonemes. Global processing involves attending to the overall linguistic structure, apart from the acoustic structure.
- Why are the results for the SSD group so unexpected?
- The SSD group does not currently have any problems with PA or reading.
- Children with SSD typically have poor global processing abilities.
- The SSD group does not currently have any problems with speech perception.
- Children with SSD typically perform worse than children with RD.
- These results imply that weak phonological representations, as measured by speech perception tasks, may be the cause of reading difficulties.
- TRUE
- FALSE
- There were no differences in speech perception abilities between the group with RD and the group with both RD and SSD.
- TRUE
- FALSE
ANSWERS
1. C
2. D
3. A
4. B
5. B
Acknowledgments
This work was supported in part by Grant HD049027 from the National Institute of Health and Human Development, to Bruce Pennington. This work was also supported in part by research Grant R01 DC-00633 from the National Institute on Deafness and Other Communication Disorders, the National Institutes of Health, to Susan Nittrouer. Both funding sources had no involvement in the study or submission of the paper.
In addition, the authors would like to thank Christa Hutaff-Lee, Irina Kaminer, and Katie Strandjorn for their assistance in collecting and entering data.
Appendix
Items used in the Phoneme Reversal task
Training: CAT, GAS, TIP, AIM
Testing: I’LL, LICK, PEEK, APE, TUB, ROB, GAB, NIECE, KNOLL, SELL, TEAM, OAT, KISS, PAM, ACE, I’D, TIME, LET, TOOL, TEA, KNIFE, LIP, DICE, PEACE
Items used in the Pig Latin task
Training: GO, PAT, HAPPY, CANDY, STICK, DRIP, STRAP, BROKEN
Testing: DAY, BOX, LADY, GRAY, BLOS, BLEND, DRAGON, GAME, MAN, GREEN, SCREW, FLATTER, SHELTER, STEAK, SHONE, SHUDDER, SHINY, THAT, SHELF, STRICT, BRIEF, CLOSET, SPRINT, SCREAMER, RABBIT, DRESSER
Footnotes
- SSD
- Speech Sound Disorder
- RD
- Reading Disability
- PA
- Phonemic Awareness
- VOT
- Voice Onset Time
- DWS
- Developmental Weighting Shift Theory
Publisher's Disclaimer: This is a PDF file of an unedited manuscript that has been accepted for publication. As a service to our customers we are providing this early version of the manuscript. The manuscript will undergo copyediting, typesetting, and review of the resulting proof before it is published in its final citable form. Please note that during the production process errors may be discovered which could affect the content, and all legal disclaimers that apply to the journal pertain.
References
- Abrams DA, Nicol T, Zecker SG, Kraus N. Auditory brainstem timing predicts cerebral asymmetry for speech. Journal of Neuroscience. 2006;26:11131–11137. doi: 10.1523/JNEUROSCI.2744-06.2006. [DOI] [PMC free article] [PubMed] [Google Scholar]
- Abrams DA, Nicol T, Zecker SG, Kraus N. Right-hemisphere auditory cortex is dominant for coding syllable patterns in speech. Journal of Neuroscience. 2008;28:3958–3965. doi: 10.1523/JNEUROSCI.0187-08.2008. [DOI] [PMC free article] [PubMed] [Google Scholar]
- Abrams DA, Nicol T, Zecker S, Kraus N. Abnormal cortical processing of the syllable rate of speech in poor readers. Journal of Neuroscience. 2009;29:7686–7693. doi: 10.1523/JNEUROSCI.5242-08.2009. [DOI] [PMC free article] [PubMed] [Google Scholar]
- Adlard A, Hazan V. Speech perception in children with specific reading difficulties (dyslexia) Quarterly Journal of Experimental Psychology A: Human Experimental Psychology. 1998;51:153–177. doi: 10.1080/713755750. [DOI] [PubMed] [Google Scholar]
- Bird J, Bishop DV, Freeman NH. Phonological awareness and literacy development in children with expressive phonological impairments. Journal of Speech and Hearing Research. 1995;38:446–62. doi: 10.1044/jshr.3802.446. [DOI] [PubMed] [Google Scholar]
- Bishop DV. Uncommon understanding: Development and disorders of language comprehension in children. Psychology Press, Ltd.; Hove, UK: 1997. [Google Scholar]
- Bishop DV, Adams C. A prospective study of the relationship between specific language impairment, phonological disorders and reading retardation. Journal of Child Psychology and Psychiatry. 1990;31:1027–50. doi: 10.1111/j.1469-7610.1990.tb00844.x. [DOI] [PubMed] [Google Scholar]
- Boada R, Pennington BF. Deficient implicit phonological representations in children with dyslexia. Journal of Experimental Child Psychology. 2006;95:153–193. doi: 10.1016/j.jecp.2006.04.003. [DOI] [PubMed] [Google Scholar]
- Bogliotti C, Serniclaes W, Messaoud-Galusi S, Sprenger-Charolles L. Discrimination of speech sounds by children with dyslexia: Comparisons with chronological age and reading level controls. Journal of Experimental Child Psychology. 2008;101:137–155. doi: 10.1016/j.jecp.2008.03.006. [DOI] [PubMed] [Google Scholar]
- Boothroyd A. Statistical theory of the speech discrimination score. Journal of the Acoustical Society of America. 1968;43:362–367. doi: 10.1121/1.1910787. [DOI] [PubMed] [Google Scholar]
- Boothroyd A, Nittrouer S. Mathematical treatment of context effects in phoneme and word recognition. Journal of the Acoustical Society of America. 1988;84:101–114. doi: 10.1121/1.396976. [DOI] [PubMed] [Google Scholar]
- Byrne B. Evaluating the role of phonological factors in early literacy development: Insights from experimental and behavior-genetic studies. 2009. Chapter in press.
- Castles A, Coltheart M. Is there a causal link from phonological awareness to success in learning to read? Cognition. 2004;91:77–111. doi: 10.1016/s0010-0277(03)00164-1. [DOI] [PubMed] [Google Scholar]
- Catts HW, Fey ME, Tomblin JB, Zhang X. A longitudinal investigation of reading outcomes in children with language impairments. Journal of Speech, Language, and Hearing Research. 2002;45:1142–57. doi: 10.1044/1092-4388(2002/093). [DOI] [PubMed] [Google Scholar]
- Caravolas M, Landerl K. The Influences of Syllable Structure and Reading Ability on the Development of Phoneme Awareness: A Longitudinal, Cross-Linguistic Study. Scientific Studies of Reading. 2010;14:464–484. [Google Scholar]
- Chiappe P, Chiappe D. Speech perception, lexicality, and reading skill. Journal of Experimental Child Psychology. 2001;80:58–70. doi: 10.1006/jecp.2000.2624. [DOI] [PubMed] [Google Scholar]
- Clarke-Klein S, Hodson BW. A phonologically based analysis of misspellings by third graders with disordered-phonology histories. Journal of Speech and Hearing Research. 1995;38:839–849. doi: 10.1044/jshr.3804.839. [DOI] [PubMed] [Google Scholar]
- Cohen J. Statistical Power Analysis for the Behavioral Sciences. 2nd ed Erlbaum; Hillsdale, NJ: 1988. [Google Scholar]
- Corriveau K, Pasquini E, Goswami U. Basic auditory processing skills and specific language impairment: A new look at an old hypothesis. Journal of Speech, Language, and Hearing Research. 2007;50:647–666. doi: 10.1044/1092-4388(2007/046). [DOI] [PubMed] [Google Scholar]
- de Santos Loureiro C, Braga L, do Nascimento Souza L, Filho G, Quieroz E, Dellatolas G. Degree of illiteracy and phonological and metaphonological skills in unschooled adults. Brain and Language. 2004;89:499–502. doi: 10.1016/j.bandl.2003.12.008. [DOI] [PubMed] [Google Scholar]
- Dickman GE. The nature of learning disabilities through the lens of reading research. Perspectives: The International Dyslexia Association. 2003;29:4–8. [Google Scholar]
- Dunn LM, Dunn LM. Peabody Picture Vocabulary Test. 3rd Edition American Guidance Service; Circle Pines, MN: 1997. [Google Scholar]
- Eimas PD, Siqueland ER, Jusczyk P, Vigorito J. Speech perception in infants. Science. 1971;171:303–306. doi: 10.1126/science.171.3968.303. [DOI] [PubMed] [Google Scholar]
- Eisenberg L, Shannon R, Schaefer Martinez A, Wygonski J, Boothroyd A. Speech recognition with reduced spectral cues as a function of age. Journal of the Acoustical Society of America. 2000;107:2704–2710. doi: 10.1121/1.428656. [DOI] [PubMed] [Google Scholar]
- Ferguson CA, Farwell CB. Words and sounds in early language acquisition. Language. 1975;51:419–439. [Google Scholar]
- Fowler AE. How early phonological development might set the stage for phoneme awareness. In: Brady S, Shankweiler D, editors. Phonological processes in literacy: A tribute to Isabelle Y. Liberman. Lawrence Erlbaum Associates; Hillsdale, NJ: 1991. pp. 97–117. [Google Scholar]
- Gallagher A, Frith U, Snowling MJ. Precursors of literacy delay among children at genetic risk of dyslexia. Journal of Child Psychology and Psychiatry. 2000;41:203–213. [PubMed] [Google Scholar]
- Godfrey J, Syrdal-Lasky A, Millay K, Knox C. Performance of dyslexic children on speech perception tests. Journal of Experimental Child Psychology. 1981;32:401–424. doi: 10.1016/0022-0965(81)90105-3. [DOI] [PubMed] [Google Scholar]
- Goldman R, Fristoe M. Goldman-Fristoe Test of Articulation. American Guidance Service; Circle Pines, MN: 1986. [Google Scholar]
- Goswami U, Thomson J, Richardson U, Stainthorp R, Hughes D, Rosen S, Scott S. Amplitude envelope onsets and developmental dyslexia: A new hypothesis. Proceedings of the National Academy of Sciences. 2002;99:10911–10916. doi: 10.1073/pnas.122368599. [DOI] [PMC free article] [PubMed] [Google Scholar]
- Hall PK, Tomblin JB. A follow-up study of children with articulation and language disorders. Journal of Speech and Hearing Disorders. 1978;43:227–41. doi: 10.1044/jshd.4302.227. [DOI] [PubMed] [Google Scholar]
- Hamalainen J, Leppanen PHT, Torppa M, Muller K, Lyytinen H. Detection of sound rise time by adults with dyslexia. Brain and Language. 2005;94:32–42. doi: 10.1016/j.bandl.2004.11.005. [DOI] [PubMed] [Google Scholar]
- Harm MW, Seidenberg MS. Phonology, reading acquisition, and dyslexia: insights from connectionist models. Psychological Review. 1999;106:491–528. doi: 10.1037/0033-295x.106.3.491. [DOI] [PubMed] [Google Scholar]
- Hazan V, Barrett S. The development of phonemic categorization in children aged 6-12. Journal of Phonetics. 2000;28:377–396. [Google Scholar]
- Hicks C, Ohde R. Developmental role of static, dynamic, and contextual cues in speech perception. Journal of Speech, Language, and Hearing Research. 2005;48:960–974. doi: 10.1044/1092-4388(2005/066). [DOI] [PubMed] [Google Scholar]
- Hoffman PR, Daniloff RG, Bengoa D, Schuckers GH. Misarticulating and Normally Articulating Childrens Identification and Discrimination of Synthetic [R] and [W] Journal of Speech and Hearing Disorders. 1985;50:46–53. doi: 10.1044/jshd.5001.46. [DOI] [PubMed] [Google Scholar]
- Holden-Pitt L, Hazan V, Revoile S, Edward D, Droge J. Temporal and spectral cue-use for initial plosive voicing perception by hearing-impaired children and normal-hearing children and adults. European Journal for Disorders of Communication. 1995;30:417–434. doi: 10.3109/13682829509087242. [DOI] [PubMed] [Google Scholar]
- Joannise M, Manis F, Keating P, Seidenberg M. Language deficits in dyslexic children: Speech perception, phonology, and morphology. Journal of Experimental Child Psychology. 2000;77:30–60. doi: 10.1006/jecp.1999.2553. [DOI] [PubMed] [Google Scholar]
- Joanisse MF, Gati JS. Overlapping neural regions for processing rapid temporal cues in speech and nonspeech signals. Neuroimage. 2003;19:64–79. doi: 10.1016/s1053-8119(03)00046-6. [DOI] [PubMed] [Google Scholar]
- Jusczyk PW, Houston D, Newsome M. The beginnings of word segmentation in English-learning infants. Cognitive Psychology. 1999;39:159–207. doi: 10.1006/cogp.1999.0716. [DOI] [PubMed] [Google Scholar]
- Kluender KR, Diehl RL, Killeen PR. Japanese quail can learn phonetic categories. Science. 1987;237:1195–1197. doi: 10.1126/science.3629235. [DOI] [PubMed] [Google Scholar]
- Kuhl PK, Miller JD. Speech perception by the chinchilla: Identification function for synthetic VOT stimuli. Journal of the Acoustical Society of America. 1978;63:905–917. doi: 10.1121/1.381770. [DOI] [PubMed] [Google Scholar]
- Kuschner ES, Bennetto L, Yost K. Patterns of nonverbal cognitive functioning in young children with autism spectrum disorders. Journal of Autism and Developmental Disorders. 2007;37:795–807. doi: 10.1007/s10803-006-0209-8. [DOI] [PubMed] [Google Scholar]
- Larrivee LS, Catts HW. Early reading achievement in children with expressive phonological disorders. American Journal of Speech-Language Pathology. 1999;8:118–128. [Google Scholar]
- Leonard LB. Phonological deficits in children with developmental language impairment. Brain and Language. 1982;16:73–86. doi: 10.1016/0093-934x(82)90073-6. [DOI] [PubMed] [Google Scholar]
- Leonard LB. Functional categories in the grammars of children with specific language impairment. Journal of Speech and Hearing Research. 1995;38:1270–1283. doi: 10.1044/jshr.3806.1270. [DOI] [PubMed] [Google Scholar]
- Lewis BA, Freebairn L. Residual effects of preschool phonology disorders in grade school, adolescence, and adulthood. Journal of Speech and Hearing Research. 1992;35:819–831. doi: 10.1044/jshr.3504.819. [DOI] [PubMed] [Google Scholar]
- Lisker L, Abramson AS. A cross-language study of voicing in initial stops: Acoustical measurements. Word. 1964;20:384–422. [Google Scholar]
- Lisker L, Abramson AS. Proceedings of the Sixth International Congress of Phonetic Sciences, Prague, 1967. Academia; Prague: 1970. The voicing dimension: some experiments in comparative phonetics; pp. 563–567. [Google Scholar]
- Lorenzi C, Dumont A, Fullgrabe C. Use of temporal envelope cues by children with developmental dyslexia. Journal of Speech, Language, and Hearing Research. 2000;43:1367–1379. doi: 10.1044/jslhr.4306.1367. [DOI] [PubMed] [Google Scholar]
- Mayo C, Scobbie JM, Hewlett N, Waters D. The influence of phonemic awareness development on acoustic cue weighting strategies in children’s speech perception. Journal of Speech, Language, and Hearing Research. 2003;46:1184–1196. doi: 10.1044/1092-4388(2003/092). [DOI] [PubMed] [Google Scholar]
- Mann VA, Liberman IY. Phonological awareness and verbal short-term memory. Journal of Learning Disabilities. 1984;17:592–599. doi: 10.1177/002221948401701005. [DOI] [PubMed] [Google Scholar]
- Manis FR, McBride-Chang C, Seidenberg M, Keating P, Doi LM, Munson B, Peterson A. Are speech perception deficits associated with developmental dyslexia? Journal of Experimental Child Psychology. 1997;66:211–235. doi: 10.1006/jecp.1997.2383. [DOI] [PubMed] [Google Scholar]
- McBride-Chang C. Models of speech perception and phonological processing in reading. Child Development. 1996;67:1836–1856. [PubMed] [Google Scholar]
- Menn L. Language acquisitions, aphasia, and phonotactic universals; Paper presented at the 12th annual University of Wisconsin-Milwaukee Linguistics Symposium; Milwaukee, WI. 1983a. [Google Scholar]
- Menn L. Development of articulatory, phonetic and phonological capabilities. In: Butterworth B, editor. Language production: Development, writing and other language processes. Academic Press; New York: 1983b. pp. 3–50. [Google Scholar]
- Metsala JL, Walley AC. Spoken vocabulary growth and the segmental restructuring of lexical representations: Precursors to phonemic awareness and early reading ability. In: Metsala JL, Ehri LC, editors. Word recognition in beginning literacy. Erlbaum; Hillsdale, NJ: 1998. pp. 89–120. [Google Scholar]
- Mills DL, Prat C, Zangl R, Stager CL, Neville HJ, Werker JF. Language experience and the organization of brain activity to phonetically similar words: ERP evidence from 14- and 20-month olds. Journal of Cognitive Neuroscience. 2004;16:1452–1464. doi: 10.1162/0898929042304697. [DOI] [PubMed] [Google Scholar]
- Morais J, Cary L, Alegria J, Bertelson P. Does awareness of speech as a sequence of phones arise spontaneously? Cognition. 1979;7:323–331. [Google Scholar]
- Muneaux M, Ziegler JC, Truc C, Thomson J, Goswami U. Deficits in beat perception and dyslexia: Evidence from French. Neuroreport. 2004;15:1–5. doi: 10.1097/01.wnr.0000127459.31232.c4. [DOI] [PubMed] [Google Scholar]
- Nittrouer S. Age-related differences in perceptual effects of formant transitions within syllables and across syllable boundaries. Journal of Phonetics. 1992;20:1–32. [Google Scholar]
- Nittrouer S. Discriminability and perceptual weighting of some acoustic cues to speech perception by 3-year-olds. Journal of Speech and Hearing Research. 1996a;39:278–297. doi: 10.1044/jshr.3902.278. [DOI] [PubMed] [Google Scholar]
- Nittrouer S. The relation between speech perception and phonemic awareness: Evidence from low-SES children and children with chronic OM. Journal of Speech, Language, and Hearing Research. 1996b;39:1059–1070. doi: 10.1044/jshr.3905.1059. [DOI] [PubMed] [Google Scholar]
- Nittrouer S. Do temporal processing deficits cause phonological processing problems? Journal of Speech, Language, and Hearing Research. 1999;42:925–42. doi: 10.1044/jslhr.4204.925. [DOI] [PubMed] [Google Scholar]
- Nittrouer S. The role of temporal and dynamic signal components in the perception of syllable-final stop voicing by children and adults. Journal of the Acoustical Society of America. 2004;115:1777–1790. doi: 10.1121/1.1651192. [DOI] [PMC free article] [PubMed] [Google Scholar]
- Nittrouer S, Boothroyd A. Context effects in phoneme and word recognition by young children and older adults. Journal of the Acoustical Society of America. 1990;87:2705–2715. doi: 10.1121/1.399061. [DOI] [PubMed] [Google Scholar]
- Nittrouer S, Burton LT. The role of early language experience in the development of speech perception and language processing abilities in children with hearing loss. Volta Review. 2002;103:5–37. [Google Scholar]
- Nittrouer S, Lowenstein JH. Does harmonicity explain children’s cue weighting of fricative-vowel syllables? Journal of the Acoustical Society of America. 2009;125:1679–1692. doi: 10.1121/1.3056561. [DOI] [PMC free article] [PubMed] [Google Scholar]
- Nittrouer S, Lowenstein JH, Packer R. Children discover the spectral skeletons in their native language before the amplitude envelopes. Journal of Experimental Psychology: Human Perception and Performance. 2009 August;35 doi: 10.1037/a0015020. [DOI] [PMC free article] [PubMed] [Google Scholar]
- Nittrouer S, Manning C, Meyer G. The perceptual weighting of acoustic cues changes with linguistic experience. Journal of the Acoustical Society of America. 1993;94:S1865. [Google Scholar]
- Nittrouer S, Miller ME. Predicting developmental shifts in perceptual weighting schemes. Journal of the Acoustical Society of America. 1997;101:2253–2266. doi: 10.1121/1.418207. [DOI] [PubMed] [Google Scholar]
- Nittrouer S, Miller ME. The development of phonemic coding strategies for serial recall. Applied Psycholinguistics. 1999;20:563–588. [Google Scholar]
- Nittrouer S, Studdert-Kennedy M. The role of coarticulatory effects on the perception of fricatives by children and adults. Journal of Speech, Language, and Hearing Research. 1987;30:319–329. doi: 10.1044/jshr.3003.319. [DOI] [PubMed] [Google Scholar]
- Ohde RN, Haley KL. Stop consonant and vowel perception in 3- and 4-year-old children. Journal of the Acoustical Society of America. 1997;102:3711–3722. doi: 10.1121/1.420135. [DOI] [PubMed] [Google Scholar]
- Ohde RN, Sharf DJ. Perceptual categorization and consistency of synthesized /r-w/ continua by adults, normal children, and /r/-misarticulating children. Journal of Speech and Hearing Research. 1988;31:556–568. doi: 10.1044/jshr.3104.556. [DOI] [PubMed] [Google Scholar]
- Olson R, Wise B, Forsberg H. The 5 to 7 shift in reading and phoneme awareness for children with dyslexia. In: Samaroff A, Haith M, editors. The five to seven year shift: The age of reason and responsibility. University of Chicago Press; Chicago: 1996. pp. 187–204. [Google Scholar]
- Pennington BF. From single to multiple deficit models of developmental disorders. Cognition. 2006;101:385–413. doi: 10.1016/j.cognition.2006.04.008. [DOI] [PubMed] [Google Scholar]
- Pennington BF, Lefly D. Early reading development in children at risk for reading disability. Child Development. 2001;72:816–833. doi: 10.1111/1467-8624.00317. [DOI] [PubMed] [Google Scholar]
- Pennington BF, Van Orden GC, Smith SD, Green PA, Haith MM. Phonological processing skills and deficits in adult dyslexics. Child Development. 1990;61:1753–1778. [PubMed] [Google Scholar]
- Peterson RL, Pennington BF, Shriberg LD, Boada R. What influences literacy outcomes in children with Speech Sound Disorder? Journal of Speech, Langauge, and Hearing Research. 2009 doi: 10.1044/1092-4388(2009/08-0024). in press. [DOI] [PMC free article] [PubMed] [Google Scholar]
- Pratt AC, Brady S. Relation of phonological awareness to reading disability in children and adults. Journal of Educational Psychology. 1988;80:319–323. [Google Scholar]
- Raaymakers EM, Crul T. Perception and production of the final /s-ts/ contrast in Dutch by misarticulating children. Journal of Speech and Hearing Disorders. 1988;53:262–270. doi: 10.1044/jshd.5303.262. [DOI] [PubMed] [Google Scholar]
- Raitano NA, Pennington BF, Tunick RA, Boada R, Shriberg LD. Pre-literacy skills of subgroups of children with speech sound disorders. Journal of Child Psychology and Psychiatry, and Allied Disciplines. 2004;45:821–835. doi: 10.1111/j.1469-7610.2004.00275.x. [DOI] [PubMed] [Google Scholar]
- Read C, Yun-Fei Z, Hong-Yin N, Bao-Quing D. The ability to manipulate speech sounds depends on knowing alphabetic writing. Cognition. 1986;24:31–44. doi: 10.1016/0010-0277(86)90003-x. [DOI] [PubMed] [Google Scholar]
- Richardson U, Thomson JM, Scott SK, Goswami U. Auditory processing skills and phonological representation in children with dyslexia. Dyslexia. 2004;10:215–233. doi: 10.1002/dys.276. [DOI] [PubMed] [Google Scholar]
- Rosner BS, Talcott JB, Witton C, Hogg JD, Richardson AJ, Hansen PC, et al. The perception of “sine-wave speech” by adults with developmental dyslexia. Journal of Speech Language and Hearing Research. 2003;46:68–79. doi: 10.1044/1092-4388(2003/006). [DOI] [PubMed] [Google Scholar]
- Rvachew S. Phonological processing and reading in children with speech sound disorders. American Journal of Speech Language Pathology. 2007;16:260–270. doi: 10.1044/1058-0360(2007/030). [DOI] [PubMed] [Google Scholar]
- Rvachew S, Grawburg M. Correlates of phonological awareness in preschoolers with speech sound disorders. Journal of Speech Language and Hearing Research. 2006;49:74–87. doi: 10.1044/1092-4388(2006/006). [DOI] [PubMed] [Google Scholar]
- Rvachew S, Jamieson DG. Perception of voiceless fricatives by children with a functional articulation disorder. Journal of Speech and Hearing Disorders. 1989;54:193–208. doi: 10.1044/jshd.5402.193. [DOI] [PubMed] [Google Scholar]
- Rvachew S, Ohberg A, Grawburg M, Heyding J. Phonological awareness and phonemic perception in 4-year-old children with delayed expressive phonology skills. American Journal of Speech-Language Pathology. 2003;12:463–471. doi: 10.1044/1058-0360(2003/092). [DOI] [PubMed] [Google Scholar]
- Scarborough HS. Developmental relationships between language and reading: Reconciling a beautiful hypothesis with some ugly facts. In: Catts HW, Kahmi AG, editors. The connections between language and reading disabilities. Taylor & Francis; London: 2005. pp. 3–22. [Google Scholar]
- Shannon RV, Zeng FG, Wygonski J, Kamath V, Ekelid M. Speech recognition with primarily temporal cues. Science. 1995;270:303–304. doi: 10.1126/science.270.5234.303. [DOI] [PubMed] [Google Scholar]
- Shriberg LD. Diagnostic markers for child speech-sound disorders: Introductory comments. Clinical Linguistics & Phonetics. 2003;17:501–505. doi: 10.1080/0269920031000138150. [DOI] [PubMed] [Google Scholar]
- Sinex DG, McDonald LP, Mott JB. Neural correlates of nonmonotonic temporal acuity for voice onset time. Journal of the Acoustical Society of America. 1991;90:2441–2449. doi: 10.1121/1.402048. [DOI] [PubMed] [Google Scholar]
- Snowling MJ. Learning to be Literate - Garton, A., Pratt, C. Journal of Child Psychology and Psychiatry and Allied Disciplines. 1990;31:824. [Google Scholar]
- Snowling MJ. Dyslexia. Blackwell; Oxford: 2000. [Google Scholar]
- Stanovich KE, Seigel LS. Phenotypic performance profile of children with reading disabilities: A regression-based test of the phonological-core variable-difference model. Journal of Educational Psychology. 1994;86:24–53. [Google Scholar]
- Stothard SE, Snowling MJ, Bishop DV, Chipchase BB, Kaplan CA. Language-impaired preschoolers: a follow-up into adolescence. Journal of Speech Language and Hearing Research. 1998;41:407–418. doi: 10.1044/jslhr.4102.407. [DOI] [PubMed] [Google Scholar]
- Swanson HL, Trainin G, Necoechea D, Hammill DD. Rapid naming, phonological awareness, and reading: A meta-analysis of the correlation evidence. Review of Educational Research. 2003;73:404–440. [Google Scholar]
- Tallal P. Auditory temporal perception, phonics, and reading disabilities in children. Brain and Language. 1980;9:182–198. doi: 10.1016/0093-934x(80)90139-x. [DOI] [PubMed] [Google Scholar]
- Tallal P. In the perception of speech time is of the essence. In: Buzsaki G, Llinas R, Singer W, Berthoz A, Christen Y, editors. Temporal coding in the brain. Springer-Verlag; Berlin: 1994. [Google Scholar]
- Tiu RD, Jr., Wadsworth SJ, Olson RK, DeFries JC. Causal models of reading disability: a twin study. Twin Research. 2004;7:275–283. doi: 10.1375/136905204774200550. [DOI] [PubMed] [Google Scholar]
- Torgesen J, Wagner R, Rachotte C. Test of Word Reading Efficiency (TOWRE) Pearson; New York: 1999. [Google Scholar]
- Treiman R, Pennington BF, Shriberg LD, Boada R. Which children benefit from letter names in learning letter sounds? Cognition. 2008;106:1322–1338. doi: 10.1016/j.cognition.2007.06.006. [DOI] [PMC free article] [PubMed] [Google Scholar]
- Treiman R, Zukowski A. Levels of phonological awareness. In: Brady SA, Shankweiler DP, editors. Phonological processes in literacy: A tribute to Isabelle Y. Liberman. Erlbaum; Hillsdale, NJ: 1991. pp. 67–83. [Google Scholar]
- Vellutino FR, Fletcher JM, Snowling MJ, Scanlon DM. Specific reading disability (Dyslexia: what have we learned in the past four decades?) Journal of Child Psychology and Psychiatry. 2004;45:2–40. doi: 10.1046/j.0021-9630.2003.00305.x. [DOI] [PubMed] [Google Scholar]
- Wagner RK, Torgesen JK. The nature of phonological processing and its causal role in the acquisition of reading skills. Psychological Bulletin. 1987;101:192–212. [Google Scholar]
- Wagner RK, Torgesen JK, Rashotte CA. Development of reading-related phonological processing abilities: New evidence of bidirectional causality from a latent variable longitudinal study. Developmental Psychology. 1994;30:73–87. [Google Scholar]
- Walley AC, Carrell TD. Onset spectra and formant transitions in adult’s and child’s perception of place of articulation in stop consonants. Journal of the Acoustical Society of America. 1983;73:1011–1022. doi: 10.1121/1.389149. [DOI] [PubMed] [Google Scholar]
- Walley AC, Flege JE. Effect of lexical status on children’s and adult’s perception of native and non-native vowels. Journal of Phonetics. 1999;27:307–332. [Google Scholar]
- Waterson N. Child phonology: A prosodic view. Journal of Linguistics. 1971;7:179–211. [Google Scholar]
- Wechsler D. Wechsler Intelligence Scale for Children. 4th Edition The Psychological Corporation; San Antonio, TX: 2003. [Google Scholar]
- Werker JF, Tees RC. Developmental changes across childhood in the perception of non-native speech sounds. Canadian Journal of Psychology. 1983;37:278–286. doi: 10.1037/h0080725. [DOI] [PubMed] [Google Scholar]
- Werker JF, Tees RC. Speech perception in severely disabled and average reading children. Canadian Journal of Psychology. 1987;41:48–61. doi: 10.1037/h0084150. [DOI] [PubMed] [Google Scholar]
- Werker J, Fennel CT, Corcoran KM, Stager CL. Infants’ ability to learn phonetically similar words: Effects of age and vocabulary size. Infancy. 2002;3:1–30. [Google Scholar]
- Witton C, Stein JF, Stoodley CJ, Rosner BS, Talcott JB. Separate influences of acoustic AM and FM sensitivity on the phonological decoding skills of impaired and normal readers. Journal of Cognitive Neuroscience. 2002;14:866–874. doi: 10.1162/089892902760191090. [DOI] [PubMed] [Google Scholar]