

Abstract
We have investigated whether Gcn5, a histone acetyltransferase (HAT), is involved in ethanol induced acetylation of histone H3 at lysine 9 (H3AcK9) and has any effect on the gene expression. Human hepatoma HepG2 cells transfected with ethanol metabolizing enzyme alcohol dehydrogenase 1 (VA 13 cells) were used. Knockdown of Gcn5 by siRNA silencing decreased mRNA and protein levels of GCN5, HAT activity, and also attenuated ethanol induced H3AcK9 in VA13 cells. Illumina gene microarray analysis using total RNA showed 940 transcripts affected by GCN5 silencing or ethanol. Silencing caused differential expression of 891 transcripts (≥ 1.5 fold up- or down- regulated). Among these, 492 transcripts were up- and 399 were down- regulated compared to their respective controls. Using a more stringent threshold (≥ 2.5 fold) the array data from GCN5 silenced samples showed 57 genes differentially expressed (39 up-regulated and 18 down-regulated). Likewise, ethanol caused differential regulation of 57 transcripts with ≥ 1.5 fold change (35 gene up-regulated and 22 down-regulated). Further analysis showed that eight genes were differentially regulated that were common for both ethanol treatment and GCN5 silencing. Among these, SLC44A2 (a putative choline transporter) was strikingly up-regulated by ethanol (3 fold), and GCN5 silencing down regulated it (1.5 fold). The quantitative RT-PCR profile corroborated the array findings. This report demonstrates for the first time that (a) GCN5 differentially affects expression of multiple genes, (b) ethanol induced histone H3-lysine 9 acetylation is mediated via GCN5 and (c) that GCN5 is involved in ethanol induced expression of the putative choline transporter SLC44A2.
INTRODUCTION
Alcoholic liver disease is the second leading cause of death among all the liver diseases (Lieber, 2004). However, its biochemical mechanism remains poorly understood. We have shown that ethanol and surrogate alcohols caused selective acetylation of histone H3 at lysine 9 in primary rat hepatocytes (Park et al., 2003, Shukla et al., 2008). This was also demonstrated in rats acutely treated with ethanol (Kim and Shukla, 2006). Ethanol metabolism (Choudhury and Shukla, 2008), oxidative stress (Choudhury et al., 2008) and MAP Kinase signaling pathways, are involved in this epigenetic process (Shukla et al., 2008).
Histone acetylation has been linked to the transcriptional activity of cellular chromatin (Turner, 1998). The steady state level of histone acetylation is a balance between the action of histone acetyltransferases (HAT) and histone deacetylases (HDAC). Given the central role of these enzymes in transcriptional regulation, it is not surprising that aberrant regulation of these enzymes are linked to human disease (Kundu and Dasgupta, 2007). These enzymes are often found to be associated with large multisubunit protein complexes and contain known regulators of transcription (Struhl, 1998). In yeast, one of the best known HATs is GCN5 (general control non-depressible 5) which is the catalytic subunit of the SAGA complex that acetylates primarily histones H3 and H2B (Zhang et al., 1998; Suka et al., 2001). The transcriptional adaptor Gcn5 was originally demonstrated to be a histone acetyltransferase predominantly modifying H3 at K14 in vitro (Kuo et al., 1996). Mutations in drosophila GCN5 abolished the K9 and K14 acetylation of H3 but had no effect on H4K8 acetylation (Carre et al., 2005). Even though extensive biochemical and structural analysis of Gcn5 complexes exist (Marmorstein and Roth, 2001), the role of Gcn5 is not well understood in mammalian cells or in disease states. In the context of ethanol induced histone acetylation, the identity of the specific HAT targeted by ethanol remains unknown. Human hepatoma HepG2 cells have been widely used in the literature. HepG2 cells are amenable to genetic manipulations and have therefore served as a useful cell culture model in a variety of mechanistic studies related to the actions of ethanol. We have investigated here the role of Gcn5 in ethanol induced histone acetylation in human hepatoma cells and its consequential relationship to transcription.
MATERIALS AND METHODS
Polyclonal anti-acetylated histone H3 lysine 9 antibody and HAT assay kit were obtained from Upstate Biotechnology (Lake Placid, NY). Gcn5 antibody and donkey anti-goat IgG were brought from Santa Cruz Biotechnology (Santa Cruz). The goat anti-rabbit and anti-mouse immunoglobulin G (IgG) conjugated with horseradish peroxidase (HRP) and Bio-Rad DC protein assay kit were purchased from Bio-Rad Laboratories (Hercules, CA). Ethanol (≥ 98% pure) was purchased from Fisher Scientific (Fair Lawn, NJ). All other chemicals were obtained from Sigma Aldrich (St. Louis, MO). Small interfering RNA for hGCN5, control non-targeting RNA and the transfection reagent were purchased from Dharmacon (Lafayette, CO).
Cell culture
VA13 is a clonal derivative of Human hepatoma HepG2 cells stably transfected with a eukaryotic expression plasmid containing a cDNA copy of murine alcohol dehydrogenase 1(ADH1) (Clemens et al., 2002). These cells were cultured in DMEM medium with 400 μg/ml zeocin. The cells were subcultured at appropriate intervals according to experimental protocol. During ethanol treatment, 25 mmol/L HEPES (pH 7.3) was added to the growth media and flasks were sealed with parafilm to minimize the evaporation of ethanol.
Western blotting
Equal amounts of nuclear extracts were separated on various percentage of sodium dodecyl sulfate-polyacrylamide gel electrophoresis (SDS–PAGE) depending on the molecular weight of the protein of interest as previously described (Choudhury and Shukla, 2008).
HAT assay
HAT activity was measured using an assay kit according to the manufacturer’s (Upstate) protocol and has been used by us earlier (Choudhury and Shukla, 2008).
siRNA silencing experiments
Cells were seeded at 2 × 10⁵ cells per well in 6 well culture plates in an antibiotic free normal DMEM growth medium with 10% fetal bovine serum. After 14 h, the cells were washed and the growth medium was replaced with 0.5 ml low serum Opti-MEM medium (GIBCO). Target siRNA for GCN5 (from Dharmacon SMARTpool- combination of four siRNA) or non-target siRNA oligonucleotides (each 40 nM); and transfection reagent were diluted with Opti-MEM medium separately for 5 min under sterile conditions. Target (T) or non-target (NT) siRNA were then mixed with the diluted transfection reagent and incubated for 30 min before adding to the culture wells. After 10 h, 1 ml of growth media was added to each well. The media was replaced with the serum free media after 24 h. The cells were treated with 100 mM ethanol 42 h after siRNA transfection and are labeled as TE (target ethanol) and NTE (non-target ethanol). Nuclear extraction was performed after 10 h of ethanol incubation as described previously (Choudhury and Shukla, 2008). Three separate batches were used for siRNA experiments and their data are presented in this study.
RNA extraction and microarray hybridization
Total RNA was extracted from cells after different treatments via the Qiagen RNeasy kit (Qiagen, Valencia, CA) using the standard protocol according to the manufacturer’s instructions. After DNase digestion, RNA was quantified spectrophotometrically and for quality control, RNA purity and integrity were evaluated by denaturing gel electrophoresis and OD 260/280 ratio. Total RNA (0.5 μg) was used to prepare biotin-labeled antisense RNA (aRNA) target using the Illumina TotalPrep RNA amplification kit (Ambion, Austin, TX) following the manufacturer’s procedures. Briefly, the total RNA was reverse transcribed to first strand cDNA with a oligo(dT) primer bearing a 5′-T7 promoter using ArrayScript reverse transcriptase. The first strand cDNA then underwent second-strand synthesis and clean-up to become the template for in vitro transcription. The biotin-labeled aRNA was synthesized using T7 RNA polymerase with biotin-NTP mix and purified. RNA (0.75 μg) was hybridized to Illumina HumanHT-12 BeadChip array at 58°C for 20 h. After hybridization, the chips were washed stringently and stained with streptavidin-C3. The image data was acquired by scanning of bound fluorescence using Bead Array Reader (Illumina, San Diego, CA).
Illumina Microarray Analysis
The data obtained was processed by a series of programs to determine whether a given transcript was present and if there were consistently significant differences based on three separate experiments (Experiment 1, 2 and 3). The data quality was examined by looking at the quality controls metrics produced by Illumina’s software (BeadStudio v3.1.3.0, Gene Expression Module 3.3.8) both before and after background correction using the software’s default method. The analysis of differential gene expression was performed using moderated t-statistics applied to the log-transformed (base 2) normalized intensity for each gene using an Empirical Bayes approach (Smyth, 2004), in which the standard errors are shrunk towards a common value. The final linear model fit (Smyth, 2005; R Development Core Team, 2006) to each gene was a two-factor (fixed-effects) factorial model, with the main effects being ethanol and targeted knockdown. Comparisons were made between ethanol treated and ethanol non-treated groups. For each comparison, we computed the aforementioned moderated t-statistics and corresponding nominal and adjusted p-values, along with estimated log-odds ratios of differential expression. Adjustment for multiple testing was made using the false discovery rate (FDR) method (Benjamini and Yekutieli, 2001), and probes with adjusted p-values less than 10% were selected as differentially expressed (which corresponded to controlling the FDR at 10% or less). The interaction term in the models were only marginally significant for a few genes. Therefore, orthogonal contrasts were used for comparisons. To facilitate interpretation, log fold changes were transformed back to fold change on the data scale and log-odds ratios of differential expression were converted into probabilities of differential expression.
Real Time- PCR
Total RNA (1 μg) was used for first-strand cDNA synthesis in 20 μl reaction volume containing 1X first-strand buffer, 5 μM of random primers, 500 μM dNTPs, 10 units of RNase inhibitor, 100 units of Moloney murine leukemia virus reverse transcriptase (Ambion). To amplify the cDNA, PCR primers were designed and the product size was selected as 50– 150 bp; optimal primer size was 20 nucleotides; primer with Tm was between 58 and 62°C, with an optimal Tm of 60°C. The forward and reverse primers used for Real Time-PCR analysis are described in Table 1. Real-time PCR quantification was then performed using a SYBR Green approach. PCR was carried out in a final volume of 20 μl using 0.1 μM final concentration of each primer, 6.25 ng cDNA template. After a 10-min preincubation at 95°C, runs corresponded to 50 cycles of 15 s each at 95°C (denaturation), 30 s at 60°C annealing and elongation using the iQ5Cycler system. PCR products were subjected to melting-curves analysis to confirm homogeneity of the PCR products. Relative ΔCT of the individual gene was calculated by subtracting the GAPDH CT (threshold cycle) from the target CT values (ΔCT = CT Target - CT GAPDH). The variation in non-target was calculated using equation ΔΔCT = (CT Non-Target - CT GAPDG)individual - (CT Non-Target - CT GAPDG)average. The relative expression of the GCN5 targeted and/or ethanol induced genes was calculated by subtracting ΔCTaverage control cells (transfected with non-target siRNA) from the samples ΔCT sample value using equation 2-(ΔCT sample- ΔCT control).
Table 1.
Gene specific primers used for validation of microarray data by Real-Time-Qt PCR.
| S. No. | Gene | 5′ primer sequence (5′-3′) | 3′ primer sequence (5′-3′) | Primers designed Exon | Accession No |
|---|---|---|---|---|---|
| 1. | SLC44A2 | ACAGCACCACCCCTCAATTA | CATGCCATAGACGCTGAAGA | 21–22 | NM_020428 |
| 2. | ZIC2 | TCCGAGAACCTCAAGATCC | TAGGGCTTATCGGAGGTG | 1–2 | NM_007129 |
| 3. | SLC16A9 | CCTAGCCTTGTGTGCAATTCC | CCCTAGGATCCCAGAAAGCAA | 5–5 | NM_194298.2 |
| 4. | RAN | GCCCAGCGTCAGAAGTCTAGTT | CGCTGCACCGCTGACA | 7–7 | NM_006325.3 |
| 5. | RNASEH1 | TGGCTGCTGCTCCAGTAATG | CCCCAGTAAACGCCGATTC | 4–4 | NM_002936.3 |
| 6. | GCN5 | CTGAAGACCATGACTGAGCGG | TCGGCCACAAAGAGCTTCC | 18–18 | NM_021078.2 |
| 7. | GAPDH | GAAGGTGAAGGTCGGAGTC | GAAGATGGTGATGGGATTTC | 2–4 | NM_002046 |
Statistical Analysis
The western blot and HAT activity experiments were performed 3–5 times. In each experiment the treatments were done in triplicate sets. Data from the 3–5 separate experiments were used for the statistical analysis. For Figures 1 to 3, the statistical significance was calculated using a standard one-way ANOVA and two-tailed unpaired Student’s t test. Values with p < 0.05 were considered significant. Details of the statistical analysis for gene array are described above in the section ‘Illumina Microarray Analysis’.
FIG. 1. Effect of ethanol on H3AcK9 and GCN5 in VA13 cells.


Cells were treated with 100 mM ethanol for 10 hours. Nuclear extracts were used for Western blot analysis to detect A) H3AcK9 and B) GCN5. Equal amounts (40 μg) of extracts were subjected to SDS–PAGE and transferred onto nitrocellulose membranes and monitored with ECL detection. Quantitative analysis was performed by densitometric analysis and is presented as mean ± SEM (bar), n = 3 experiments (C: control; E: 100 mM ethanol). The GCN5 bands in both samples comigrated with a known GCN5 protein standard ran on a separate lane (not shown). In Fig 1A, # # # represents significance value of p< 0.001 compared to C (control). The data in Fig 1B were not significantly different.
FIG. 3. Effect of GCN5siRNA ologonucleotides on ethanol induced HAT activity in VA13 cells.

Effects of GCN5 siRNA ologonucleotides on ethanol induced HAT activity was examined by the ELISA method. Cells were transfected with scrambled (non targeted siRNA) or GCN5 siRNA oligonucleotides (see Materials & Methods) followed by ethanol treatment. Nuclear extracts were prepared and incubated with histone H3 peptide in the presence of HAT assay cocktail containing HAT assay buffer, Na-butyrate and acetyl-CoA. HAT activity assay kit was supplied by Upstate and was used by protocol provided by the manufacturer. Values are presented as the mean ± SEM (bar), n = 3 experiments and represent fold increase over control group (control = 1) (C: untransfetecd cells, no ethanol; E: ethanol, untransfected cells; T: GCN5 siRNA transfected cells, no ethanol; NT: non-target siRNA transfected cells, no ethanol; TE: GCN5 siRNA transfected cells, with 100 mM ethanol; NTE: non-target siRNA transfected cells, with 100 mM ethanol). The symbol * and *** represent significance values p< 0.05 and p< 0.001 respectively, when compared with NT. The symbol # # # represents p< 0.001 in comparison with C (control).
RESULTS
We have investigated the role of Gcn5 in ethanol induced histone H3-lysine 9 acetylation in VA13 cells. Liver cells can be exposed to higher concentrations and amount of ethanol than observed in peripheral blood. The upper limit of ethanol in chronic alcoholics can reach 100 mM or 245 mM or in one report as high as 300 mM (Deitrich and Harris, 1996). We have used here 100 mM, a patho-physiologically relevant concentration widely used in alcohol studies. In primary cultures of rat hepatocytes, 100 mM ethanol caused the highest histone acetylation (Park et al., 2003). We were unable to use the primary rat hepatocytes for the GCN5 down regulation experiments because in the absence of antibiotics (necessary for siRNA transfection), cells were easily contaminated and could not be cultured for longer periods. In addition, primary hepatocytes cultured in vitro for extended period lose the ability to express many liver specific functions including alcohol metabolism that is required for histone acetylation (Park et al 2003; Choudhury & Shukla, 2008). Metabolism of ethanol is required for histone actylation in hepatocytes. This is based on observations that 4 mthyl pyrazole (ADH1 inhibitor) and cyanamide (aldehyde dehydrogenase inhibitor) decerased ethanol induced histone actylation in rat hepatocytes (Park et al, 2003). We therefore chose to use VA13 cells, a clonal derivative of the well differentiated hepatoma cell line HepG2 cells. Ability of native HepG2 cells to metabolize ethanol is negligible, concomitantly there was no hitone acetylation by ethanol in HepG2 cells (data not shown). We therefore used HepG2 cells stably transfected and constitutively expressing ethanol-metabolizing enzyme ADH1 (termed VA 13 cells). VA13 cells are well characterized and have been shown to possess many characteristics of primary hepatocytes (Clemens et al, 2002).
Effect of ethanol on histone H3 acetylation at lysine 9 in VA13 cells
First, we tested if ethanol causes histone acetylation in VA13 cells. VA13 cells were treated with ethanol for different time points (6 h to 24 h) and levels of H3AcK9 were determined. At 10 h, ethanol increased the level of H3AcK9 by 4.5 fold compared to control (Fig. 1A). Increases in H3AcK9 compared to control were also seen at other time points (data not shown). The 10 h time point was chosen for subsequent siRNA experiments. VA13 cells also expressed Gcn5. Ethanol treatment did not result in a statistically significant change in the GCN5 expression based on three independent experiments (Fig. 1B).
Effect of GCN5 silencing on ethanol induced Histone H3 acetylation at lysine 9 in VA13 cells
To examine the role of GCN5 we knocked down GCN5 by silencing with siRNA and monitored its effect on ethanol induced acetylation of histone H3. VA13 cells were transfected with GCN5 target siRNA (T) or non–target siRNA (NT) oligonucleotides as described in the Materials & Methods. The target siRNA transfection caused about 80% inhibition of Gcn5 protein expression (Fig. 2A) determined by western blotting and agreed with reduction (about 50%) in GCN5 mRNA (see Fig. 6). Levels of β-actin (a house keeping protein) did not change in these samples. Non-target siRNA transfected cells reflected no significant decrease in GCN5 mRNA or protein expression in three separate experiments (Figs. 2 & 6). To assess whether the knockdown of GCN5 had any influence on the ethanol induced H3AcK9, we incubated the transfected or non-transfected VA13 cells with 100 mM ethanol for 10 h and analyzed their nuclear extracts for H3AcK9 by western blotting. Ethanol increased H3AcK9 by 4.3 and 4.2 fold, respectively in normal cells and cells transfected with non-target siRNA (see E & NTE; Fig. 2B). Transfection with target GCN5 siRNA reduced basal level of H3AcK9 in cells (Fig. 2B, C vs T). The level of H3AcK9 by ethanol was reduced by about 65% after target siRNA (TE), when compared with cells transfected with non-target siRNA, NTE (p<0.001; Fig. 2B).
FIG. 2. Effect of GCN5 siRNA oliogonucleotides on ethanol induced changes in H3AcK9 in VA13 cells.


Cells were transfected with scrambled (non targeted siRNA) or GCN5 siRNA oligonucleotides as described in Materials and Methods section. Expression of GCN5 and H3AcK9 were analyzed by Western blots. A) Equal amount of nuclear extracts were run on the blots for GCN5 or β-actin. B) The siRNA transfected cells were next treated with 100 mM ethanol for 10 h, the nuclear proteins were extracted and western blot for H3AcK9 were performed. Quantitative analysis of the bands was performed by densitometry and is presented as mean ± SEM (bar), n = 3 experiments. Values represent fold increase compared to control (C: untransfected cells, no ethanol treatment; E: ethanol-treated, untransfected cells; T: GCN5 siRNA transfected cells, no ethanol; NT: non-target siRNA transfected cells, no ethanol; TE: GCN5 siRNA transfected cells, with 100 mM ethanol; NTE: non-target siRNA transfected cells, with 100 mM ethanol). The symbol *** represents significance value p< 0.001 in comparison with NT. The symbols # # and # # # represent significance values p< 0.01 and p< 0.001 respectively, in comparison with C (control).
FIG. 6. Real time-PCR analysis.

RNA extracted from each treatment group were used for synthesis of cDNA and amplified by PCR using the indicated gene specific primers. Real Time- PCR was performed as described under Materials and Methods section. The results are expressed in arbitrary units after normalization by GAPDH mRNA levels. The relative changes were calculated using −ΔΔCt method as described in Material & Methods. T: GCN5 target siRNA transfected cells, no ethanol; NT: non-target siRNA transfected cells, no ethanol; TE: GCN5 target siRNA transfected cells, with 100 mM ethanol; NTE: non-target siRNA transfected cells, with 100 mM ethanol. Results present the fold change of average value of three different independent experiments ± SEM. Statistical significance of differences was evaluated by one way ANOVA and two-tailed unpaired Student’s t test. Differences were considered to be significant, *p< 0.05, **p < 0.01, ***p < 0.001, when compared with NT.
Effect of ethanol on HAT activity in VA13 cells after GCN5 knockdown
We next questioned whether this decrease in the level of Gcn5 resulted in a concomitant decrease in its HAT activity. Using a similar approach as above, we conducted HAT activity assay in various nuclear extracts from cells transfected with target and non-target siRNA. GCN5 knockdown caused a small reduction in the basal level of total HAT activity (Fig. 3). The residual activity presumably represents contributions from other HAT enzymes present in the VA13 cells. Compared to control (C), ethanol increased HAT activity in normal cells (E) and cells transfected with non-target siRNA (NTE) by 2.9 and 3 fold respectively. On the other hand, VA13 cells transfected with GCN5 target siRNA showed an approximately 60% reduction in HAT activity following ethanol treatment when compared with cells transfected with non-target siRNA (p<0.001; Fig. 3) demonstrating a reduction in HAT activation; in agreement with the decreased mRNA and protein expressions.
Consequences of GCN5 silencing on gene array profile
Of the 48803 genes represented on the Illumina Human HT-12 array, 14244 genes were detected and analyzed further for their differential expression. Interestingly, 940 known transcripts were affected by GCN5 silencing and or ethanol. GCN5 silencing alone caused differential expression of 891 transcripts (≥ 1.5 fold up- or down- regulated; adjusted P value < 0.1). Among these, 492 genes were up- and 399 were down- regulated as compared to their respective control non-target siRNA transfected VA13 cells (data provided in Supplementary Table). A more stringent 2.5 fold cutoff threshold (instead of 1.5 fold cutoff value) reduced the number of GCN5-regulated transcript to 57 (Table 2). Examples of genes upregulated by GCN5 silencing include ALS2CR2 (amyotrophic lateral sclerosis 2 (juvenile) chromosome region, candidate 2), MDK (midkine neurite growth-promoting factor 2), TGFBR2 (transforming growth factor, beta receptor II), AGTR1 (angiotensin II receptor, type 1), NT5E (5′-nucleotidase, ecto CD73), CYP2J2 (cytochrome P450, family 2, subfamily J, polypeptide 2) and those down regulated include PDHA1 (pyruvate dehydrogenase (lipoamide) alpha 1), DNMT3B (DNA (cytosine-5-)-methyltransferase 3 beta), MMP7 (matrix metallopeptidase 7), CASP3 (Caspase 3, apoptosis-related cysteine peptidase), MKNK2 (MAP kinase interacting serine/threonine kinase 2), RING1 (ring finger protein 1). As expected, the expression of GCN5 mRNA was down regulated by about 50% after silencing with siRNA (see Table 2). Treatment of VA13 cells with ethanol caused up-regulation of a number of genes that include SLC44A2 (solute carrier family 44, member 2), EGR1 (early growth response 1), PLA2G12B (phospholipase A2, group XIIB), BHMT (betaine-homocysteine methyltransferase) and ATF4 (activating transcription factor 4). Ethanol also causes down regulation of several genes like RAN (RAN, member RAS oncogene family), ARL4A (ADP-ribosylation factor-like 4A), LACTB2 (lactamase, beta 2) more than 1.5 fold different from control (see Table 2 for details). A scatter plot of the transcript levels revealed a broader variation in gene expression changes following GCN5 knockdown than following ethanol treatment (Fig. 4). Ethanol treatment alone caused differential regulation of 57 transcripts (35 up-regulated and 22 down regulated) at the 1.5 fold cutoff value with adjusted P-value of ≤ 0.1 (Fig. 4B and Table 2). Next, we used hierarchical clustering to compare expression intensity of the 57 ethanol regulated genes, and 57 GCN5-regulated genes across all four sample groups (Fig. 5). The pattern of expression of genes was found to be reproducibly consistent among the three independent experiments. It was apparent that there were 3–5 well formed clusters among the different treatments. Eight genes, SLC44A2, ZIC2 (Zic family member 2), SLC16A9 (solute carrier family 16, member 9), JSRP1 (junctional sarcoplasmic reticulum protein 1), RAN, RNASEH1 (ribonuclease H1), RPS23 (ribosomal protein S23) and LSS (lanosterol synthase 2,3-oxidosqualene-lanosterol cyclase) (see Table 2 for details) were found at the intersection associated with GCN5 silencing or ethanol. Among these the gene for SLC44A2 also termed choline transporter like protein 2, (CTL2), a putative choline transporter, was most remarkably up-regulated by ethanol (3 fold) and GCN5 silencing down regulated it (1.5 fold). In the case of NTE there was a small increase in mRNA of GCN5. In the knockdown the GCN5 levels decreased (Fig. 2 & 6).
Table 2. Differential expression of genes associated with GCN5 knockdown and ethanol.
Genes shown are all significant after adjusting the p-values for multiple testing based on the false discovery rate method (adjusted p<0.10).
| Gene Symbol | Gene description | Fold Change | Accession No. |
|---|---|---|---|
| Genes differentially regulated by GCN5 silencing [T vs NT] (≥ 2.5 fold) | |||
| ALS2CR2 | amyotrophic lateral sclerosis 2 (juvenile) chromosome region, candidate 2 | 6.44 | NM_018571.5 |
| MDK | midkine (neurite growth-promoting factor 2) | 5.89 | NM_001012334.1 |
| TMCO1 | Transmembrane channel-like 6 (TMC6) | 5.52 | NM_007267.5 |
| HRASLS3 | HRAS-like suppressor 3 | 5.36 | NM_007069.2 |
| MRPL36 | mitochondrial ribosomal protein L36 | 4.21 | NM_032479.2 |
| DAZAP2 | deleted in azoospermia (DAZ) associated protein 2 | 4.07 | NM_014764.2 |
| TGFBR2 | transforming growth factor, beta receptor II | 3.84 | NM_001024847.1 |
| SMPDL3A | sphingomyelin phosphodiesterase, acid-like 3A | 3.61 | NM_020159.2 |
| SURF4 | suppressor of Ty 4 homolog 1 | 3.58 | NM_003168.1 |
| DUSP5 | dual specificity phosphatase 5 | 3.50 | NM_004419.3 |
| CTHRC1 | collagen triple helix repeat containing 1 | 3.40 | NM_138455.2 |
| APLP2 | amyloid beta (A4) precursor-like protein 2 | 3.39 | NM_001642.1 |
| SERP1 | serine incorporator 3 | 3.38 | NM_006811.2 |
| TRAK1 | TOX high mobility group box family member 4 | 3.15 | NM_014828.2 |
| DNAJB6 | DnaJ (Hsp40) homolog, subfamily B, member 6 | 3.12 | NM_058246.3 |
| MOBKL3 | Mps One Binder kinase activator-like 3 | 3.11 | NM_001100819.1 |
| AGTR1 | angiotensin II receptor, type 1 | 2.96 | NM_000685.4 |
| LYVE1 | lymphatic vessel endothelial hyaluronan receptor 1 | 2.94 | NM_006691.3 |
| EEF1A2 | eukaryotic translation elongation factor 1 alpha 2 | 2.93 | NM_001958.2 |
| NUDT21 | nudix (nucleoside diphosphate linked moiety X)-type motif 21 | 2.89 | NM_007006.2 |
| LOC339344 | hypothetical protein | 2.71 | NM_001012643.2 |
| ANTXR2 | anthrax toxin receptor 2 | 2.70 | NM_058172.3 |
| BNIP3L | BCL2/adenovirus E1B 19kDa interacting protein 3-like | 2.69 | NM_004331.2 |
| UCRC | uridine-cytidine kinase 1-like 1 | 2.68 | NM_017859.2 |
| AGTR1 | angiotensin II receptor, type 1 | 2.68 | NM_004835.3 |
| IGSF1 | immunoglobulin superfamily, member 1 | 2.67 | NM_001555.2 |
| NT5E | 5′-nucleotidase, ecto (CD73) | 2.67 | NM_002526.1 |
| AQP8 | aquaporin 8 | 2.64 | NM_001169.2 |
| ZNF32 | zinc finger protein 30 | 2.64 | NM_001099437.1 |
| CCL20 | coiled-coil domain containing 51 | 2.63 | NM_024661.3 |
| RNF149 | ring finger protein 128 (RNF128) | 2.57 | NM_024539.3 |
| C4orf18 | chromosome 4 open reading frame 18 | 2.53 | NM_016613.4 |
| CCNY | cyclin Y (CCNY), transcript variant 1, mRNA | 2.53 | NM_145012.3 |
| ARHGDIB | Rho GDP dissociation inhibitor (GDI) beta | 2.53 | NM_001175.4 |
| FAM8A1 | family with sequence similarity 8, member A1 | 2.53 | NM_016255.1 |
| BEGAIN | branched chain ketoacid dehydrogenase kinase | 2.53 | NM_005881.1 |
| MBNL2 | muscleblind-like 2 | 2.51 | NM_207304.1 |
| RGS10 | regulator of G-protein signaling 10 | 2.51 | NM_001005339.1 |
| CYP2J2 | cytochrome P450, family 2, subfamily J, polypeptide 2 | 2.50 | NM_000775.2 |
| CLPTM1L | CLPTM1-like | − 2.52 | NM_030782.3 |
| PDHA1 | pyruvate dehydrogenase (lipoamide) alpha 1 | − 2.53 | NM_000284.1 |
| DNMT3B | DNA (cytosine-5-)-methyltransferase 3 beta | − 2.54 | NM_006892.3 |
| GNB1 | guanine nucleotide binding protein (G protein), beta polypeptide 1 | − 2.59 | NM_002074.2 |
| MMP7 | melanoma inhibitory activity 2 | − 2.59 | NM_054024.3 |
| KRT23 | keratin 23 | − 2.63 | NM_015515.3 |
| KRT80 | keratin 80 | − 2.94 | NM_182507.2 |
| HMGCS1 | 3-hydroxy-3-methylglutaryl-Coenzyme A synthase 1 | − 2.96 | NM_002130.6 |
| SLC2A3 | solute carrier family 2, member 3 | − 3.12 | NM_006931.1 |
| MMP7 | matrix metallopeptidase 7 | − 3.15 | NM_002423.3 |
| HMGCR | hairy and enhancer of split 4 | − 3.20 | NM_021170.2 |
| NSUN2 | NOL1/NOP2/Sun domain family, member 2 | − 3.23 | NM_017755.4 |
| GCN5L2 | GCN5 general control of amino-acid synthesis 5-like 2 | − 3.35 | NM_021078.2 |
| SCML1 | sex comb on midleg-like 1 | − 3.40 | NM_001037540.1 |
| CASP3 | Caspase 3, apoptosis-related cysteine peptidase | − 3.57 | NM_032991.2 |
| UBD | ubiquitin D (UBD), mRNA | − 3.75 | NM_006398.2 |
| MKNK2 | MAP kinase interacting serine/threonine kinase 2 | − 3.77 | NM_017572.2 |
| RING1 | ring finger protein 1 | − 4.16 | NM_002931.3 |
| Genes differentially regulated by ethanol [NT vs NTE] (≥ 1.5 fold) | |||
| SLC44A2 | solute carrier family 44, member 2 | 3.02 | NM_020428.2 |
| C20orf46 | chromosome 20 open reading frame 46 | 2.38 | NM_018354.1 |
| MIXL1 | Mix1 homeobox-like 1 | 2.08 | NM_031944.1 |
| EGR1 | early growth response 1 | 2.01 | NM_001964.2 |
| PLA2G12B | phospholipase A2, group XIIB | 1.99 | NM_032562.2 |
| BHMT | betaine-homocysteine methyltransferase | 1.93 | NM_001713.1 |
| HMGB2 | high-mobility group box 2 | 1.87 | NM_002129.2 |
| ERRFI1 | ERBB receptor feedback inhibitor 1 | 1.86 | NM_018948.2 |
| ASNS | asparagine synthetase | 1.84 | NM_133436.1 |
| ZIC2 | Zic family member 2 | 1.83 | NM_007129.2 |
| MTHFD2 | methylenetetrahydrofolate dehydrogenase | 1.77 | NM_006636.3 |
| PMP22 | peripheral myelin protein 22 | 1.65 | NM_153321.1 |
| BCAS4 | breast carcinoma amplified sequence 4 | 1.65 | NM_017843.3 |
| HNMT | histamine N-methyltransferase | 1.64 | NM_001024074.1 |
| ATF4 | activating transcription factor 4 | 1.59 | NM_001675.2 |
| MTHFD2 | methenyltetrahydrofolate cyclohydrolase | 1.59 | NM_006636.3 |
| LMO4 | LIM domain only 4 | 1.58 | NM_006769.2 |
| LMO4 | LIM domain only 4 | 1.58 | NM_006769.2 |
| HSD17B11 | hydroxysteroid (17-beta) dehydrogenase 11 | 1.57 | NM_016245.3 |
| SLC16A9 | solute carrier family 16, member 9 | 1.56 | NM_194298.1 |
| ADCK2 | aarF domain containing kinase 2 | 1.56 | NM_052853.3 |
| CACNA2D4 | calcium channel, voltage-dependent, alpha 2/delta subunit 4 | 1.56 | NM_001005737.1 |
| BCAS4 | breast carcinoma amplified sequence 4 | 1.55 | NM_017843.3 |
| MGAT4A | mannosyl (alpha-1,3-)-glycoprotein beta-1,4-N- acetylglucosaminyltransferase | 1.55 | NM_012214.2 |
| CBX4 | chromobox homolog 4 | 1.54 | NM_003655.2 |
| SAP30L | SAP30-like | 1.53 | NM_024632.4 |
| ADM2 | Adrenomedullin 2 | 1.52 | NM_024866.4 |
| JSRP1 | junctional sarcoplasmic reticulum protein 1 | 1.52 | NM_144616.2 |
| OVOL2 | ovo-like 2 | 1.52 | NM_021220.2 |
| AQP11 | aquaporin 11 | 1.51 | NM_173039.1 |
| LRP11 | low density lipoprotein receptor-related protein 11 | 1.51 | NM_032832.4 |
| AAA1 | AAA1 protein | 1.51 | NM_207284.1 |
| SOBP | sine oculis binding protein | 1.51 | NM_018013.3 |
| FBXL20 | F-box and leucine-rich repeat protein 20 | 1.50 | NM_032875.1 |
| FRAT2 | frequently rearranged in advanced T-cell lymphomas 2 | 1.50 | NM_012083.2 |
| RAN | RAN, member RAS oncogene family | − 1.50 | NM_006325.2 |
| C9orf123 | chromosome 9 open reading frame 123 | − 1.52 | NM_033428.1 |
| SFRS7 | splicing factor, arginine/serine-rich 7 | − 1.55 | NM_001031684.1 |
| RNASEH1 | ribonuclease H1 | − 1.55 | NM_002936.3 |
| GMEB2 | glucocorticoid modulatory element binding protein 2 | − 1.55 | NM_012384.2 |
| NASP | nuclear autoantigenic sperm protein (histone-binding) | − 1.56 | NM_172164.1 |
| PIGW | phosphatidylinositol glycan anchor biosynthesis, class W | − 1.57 | NM_178517.3 |
| C17orf70 | chromosome 17 open reading frame 70 | − 1.58 | NM_025161.3 |
| OSBPL3 | oxysterol binding protein-like 3 | − 1.58 | NM_145321.1 |
| NCL | nucleolin (NCL) | − 1.60 | NM_005381.2 |
| RPS23 | ribosomal protein S23 | − 1.60 | NM_001025.4 |
| ARL4A | ADP-ribosylation factor-like 4A | − 1.60 | NM_001037164.1 |
| DBNL | drebrin-like | − 1.62 | NM_001014436.1 |
| SFRS3 | splicing factor, arginine/serine-rich 3 | − 1.66 | NM_003017.3 |
| HNMT | histamine N-methyltransferase | − 1.67 | NM_001024074.1 |
| VAPA | VAMP (vesicle-associated membrane protein)- associated protein A | − 1.69 | NM_003574.5 |
| KIAA1618 | KIAA1618 | − 1.71 | NM_020954.2 |
| LSS | lanosterol synthase (2,3-oxidosqualene-lanosterol cyclase) | − 1.74 | NM_001001438.1 |
| EPM2AIP1 | EPM2A (laforin) interacting protein 1 | − 1.77 | NM_014805.2 |
| HNMT | histamine N-methyltransferase | − 1.79 | NM_001024074.1 |
| SYNCRIP | synaptotagmin binding, cytoplasmic RNA interacting protein | − 1.88 | NM_006372.3 |
| LACTB2 | lactamase, beta 2 | − 2.05 | NM_016027.1 |
T: GCN5 siRNA transfected cells, no ethanol; NT: non-target siRNA transfected cells, no ethanol; TE: GCN5 siRNA transfected cells, with 100 mM ethanol; NTE: non-target siRNA transfected cells, with 100 mM ethanol.
FIG. 4. Scatter diagram of gene expression levels versus treatment-dependent change in their expression.

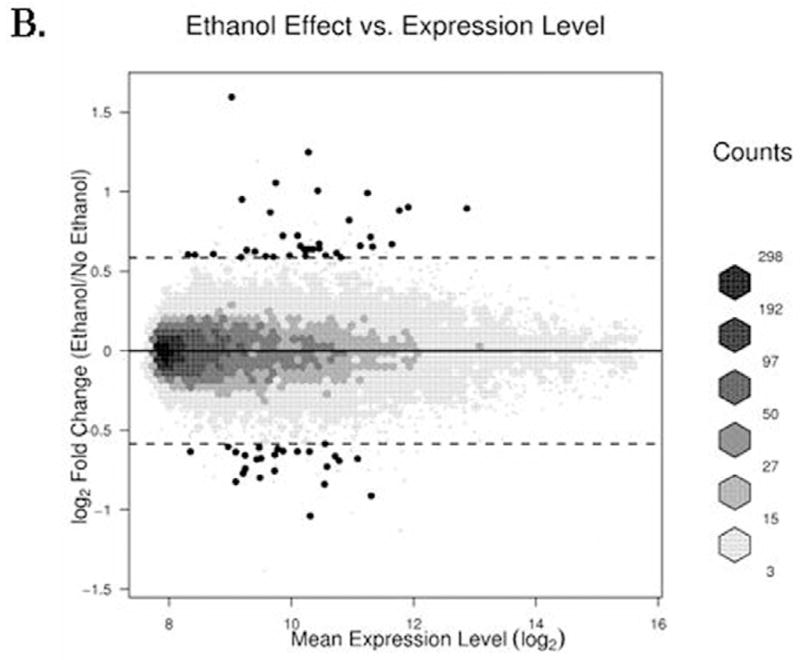
(A) The log transformed ratio of expression due to GCN5 knockdown compared to the background-adjusted and normalized signals of transcripts plotted on a logarithmic scale is shown. (B) A similar plot is shown for the ethanol effect. Hexagon binning is used to elucidate the distribution of the data. Darker shades indicate increased density. Single points represent the genes given in Table 2, while the broken lines indicate the log2 equivalent of 2.5-fold cutoff (4A) or 1.5-fold cutoff (4B).
FIG. 5. Hierarchical clustering of gene expression.

The figure shows hierarchial clustering of gene expression using the genes that exhibit differential expression (Table 2) between either GCN5 knockdown or ethanol treatment. The color indicates the intensity of the background-adjusted and normalized signal on a logarithmic scale. The rows represent genes and the columns represent samples (T: GCN5 siRNA transfected cells, no ethanol; NT: non-target siRNA transfected cells, no ethanol; TE: GCN5 siRNA transfected cells, with 100 mM ethanol; NTE: non-target siRNA transfected cells, with 100 mM ethanol). The clustering was based on Euclidean distance. Results from all three separate experiments are shown.
GCN 5 silencing appears to influence genes involved in a number of cellular functions and pathways. We have subjected our data to analysis based on KEGG, Kyoto Encyclopedia of Genes & Genomes (Kanehisa et al, 2010), with a cut off for a minimum of 3 genes affected (Tables 3 and 4). In addition, data were also analysed for genes differentially expressed ≥2.5 fold using Ingenuity System (Table 5). The Ingenuity Pathway Analysis provides the ability to understand biology at multiple levels by integrating data for different network functions, physiological and toxicological functions, disease, canonical pathways and molecular interactions (Calvano et al, 2005). It is apparent from the two database analysis that genes for multiple pathways, and networks are influenced by GCN5 silencing. Although these analytical tools offer a broad picture of the possible pathways, it paves the way for additional investigations to delineate these pathways in the future.
Table 3.
KEGG Pathways associated with ≥3 differentially expressed genes due to knockout effect. The genes were statistically significant and had ≥1.5 fold difference (up or down).
| KEGGID | # Genes | Description |
|---|---|---|
| 1100 | 91 | Metabolic pathways |
| 5200 | 33 | Pathways in cancer |
| 4110 | 31 | Cell cycle |
| 4010 | 24 | MAPK signaling pathway |
| 4060 | 19 | Cytokine-cytokine receptor interaction |
| 4114 | 18 | Oocyte meiosis |
| 3030 | 17 | DNA replication |
| 4510 | 17 | Focal adhesion |
| 4810 | 17 | Regulation of actin cytoskeleton |
| 4910 | 16 | Insulin signaling pathway |
| 4914 | 16 | Progesterone-mediated oocyte |
| 4062 | 15 | Chemokine signaling pathway |
| 5210 | 14 | Colorectal cancer |
| 100 | 13 | Steroid biosynthesis |
| 4144 | 13 | Endocytosis |
| 4350 | 13 | TGF-beta signaling pathway |
| 4115 | 11 | p53 signaling pathway |
| 4120 | 11 | Ubiquitin mediated proteolysis |
| 4620 | 11 | Toll-like receptor signaling pathway |
| 280 | 10 | Valine, leucine and isoleucine |
| 3010 | 10 | Ribosome degradation |
| 4666 | 10 | Fc gamma R-mediated phagocytosis |
| 4722 | 10 | Neurotrophin signaling pathway |
| 5016 | 10 | Huntington’s disease |
| 5212 | 10 | Pancreatic cancer |
| 650 | 9 | Butanoate metabolism |
| 4514 | 9 | Cell adhesion molecules (CAMs) |
| 4540 | 9 | Gap junction |
| 4650 | 9 | Natural killer cell mediated cytotoxicity |
| 5120 | 9 | Epithelial cell signaling in H. pylori |
| 5215 | 9 | Prostate cancer infection |
| 5219 | 9 | Bladder cancer |
| 5222 | 9 | Small cell lung cancer |
| 230 | 8 | Purine metabolism |
| 240 | 8 | Pyrimidine metabolism |
| 620 | 8 | Pyruvate metabolism |
| 4012 | 8 | ErbB signaling pathway |
| 4310 | 8 | Wnt signaling pathway |
| 4512 | 8 | ECM-receptor interaction |
| 4610 | 8 | Complement and coagulation cascades |
| 4662 | 8 | B cell receptor signaling pathway |
| 5211 | 8 | Renal cell carcinoma |
| 5220 | 8 | Chronic myeloid leukemia |
| 10 | 7 | Glycolysis / Gluconeogenesis |
| 330 | 7 | Arginine and proline metabolism |
| 3420 | 7 | Nucleotide excision repair |
| 3430 | 7 | Mismatch repair |
| 4142 | 7 | Lysosome |
| 4370 | 7 | VEGF signaling pathway |
| 4630 | 7 | Jak-STAT signaling pathway |
| 4660 | 7 | T cell receptor signaling pathway |
| 4664 | 7 | Fc epsilon RI signaling pathway |
| 4912 | 7 | GnRH signaling pathway |
| 4916 | 7 | Melanogenesis |
| 5010 | 7 | Alzheimer’s disease |
| 5218 | 7 | Melanoma |
| 310 | 6 | Lysine degradation |
| 340 | 6 | Histidine metabolism |
| 480 | 6 | Glutathione metabolism |
| 900 | 6 | Terpenoid backbone biosynthesis |
| 3410 | 6 | Base excision repair |
| 4270 | 6 | Vascular smooth muscle contraction |
| 4520 | 6 | Adherens junction |
| 4640 | 6 | Hematopoietic cell lineage |
| 4670 | 6 | Leukocyte transendothelial migration |
| 4930 | 6 | Type II diabetes mellitus |
| 5012 | 6 | Parkinson’s disease |
| 5130 | 6 | Pathogenic Escherichia coli infection |
| 5213 | 6 | Endometrial cancer |
| 5214 | 6 | Glioma |
| 5221 | 6 | Acute myeloid leukemia |
| 20 | 5 | Citrate cycle (TCA cycle) |
| 72 | 5 | Synthesis and degradation of ketone bodies |
| 190 | 5 | Oxidative phosphorylation |
| 640 | 5 | Propanoate metabolism |
| 3040 | 5 | Spliceosome |
| 3320 | 5 | PPAR signaling pathway |
| 4210 | 5 | Apoptosis |
| 4622 | 5 | RIG-I-like receptor signaling pathway |
| 4730 | 5 | Long-term depression |
| 5216 | 5 | Thyroid cancer |
| 5223 | 5 | Non-small cell lung cancer |
| 5412 | 5 | Arrhythmogenic right ventricular |
| 5416 | 5 | Viral myocarditis |
| 71 | 4 | Fatty acid metabolism |
| 260 | 4 | Glycine, serine and threonine metabolism |
| 380 | 4 | Tryptophan metabolism |
| 561 | 4 | Glycerolipid metabolism |
| 830 | 4 | Retinol metabolism |
| 982 | 4 | Drug metabolism - cytochrome P450 |
| 1040 | 4 | Biosynthesis of unsaturated fatty acids |
| 4020 | 4 | Calcium signaling pathway |
| 4150 | 4 | mTOR signaling pathway |
| 4260 | 4 | Cardiac muscle contraction |
| 4360 | 4 | Axon guidance |
| 4530 | 4 | Tight junction |
| 4621 | 4 | NOD-like receptor signaling pathway |
| 4720 | 4 | Long-term potentiation |
| 30 | 3 | Pentose phosphate pathway |
| 270 | 3 | Cysteine and methionine metabolism |
| 350 | 3 | Tyrosine metabolism |
| 450 | 3 | Selenoamino acid metabolism |
| 983 | 3 | Drug metabolism - other enzymes |
| 3018 | 3 | RNA degradation |
| 3450 | 3 | Non-homologous end-joining |
| 4070 | 3 | Phosphatidylinositol signaling system |
| 4320 | 3 | Dorso-ventral axis formation |
| 4614 | 3 | Renin-angiotensin system |
| 4920 | 3 | Adipocytokine signaling pathway |
| 5014 | 3 | Amyotrophic lateral sclerosis (ALS) |
| 5110 | 3 | Vibrio cholerae infection |
Table 4.
KEGG Pathways associated with ≥3 differentially expressed genes due to ethanol effect. The genes were statistically significant and had ≥1.5 fold difference (up or down).
| KEGG ID | # Genes | Description |
|---|---|---|
| 1100 | 8 | Metabolic pathways |
| 340 | 3 | Histidine metabolism |
| 4010 | 3 | MAPK signaling pathway |
Table 5.
GCN5 silencing and Ethanol induced differentially regulated genes associated with major networks and pathways: Ingenuity Pathway Analysis
| Group | Network and pathways | Genes |
|---|---|---|
| Ethanol up-regulated | Gene expression, Embryonic development, Tissue development | ADM2, ASNS, ATF4, BHMT, ERRF11, HNMT, HSD17B11, MGAT4A, MTHFD2, PLA2G12B, SAP30L, SLC16A9 |
| Cell death, Reproductive system disease, Cell cycle | BCAS4, CBX4, EGR1, FBXL20, FRAT2, HMGBR2, LMO4, LRP11, PMP22, SLC44A2, TMEM97, ZIC2 | |
| C20orf46 | ||
| Embryonic development, Tissue development, Tissue morphology | MIXL1 | |
| Genetic disorder, Opthalmic disease, Organismal injury and Abnormalities | CACNA2D4 | |
| Ethanol down-regulated | Antigen presentation, Cell-To-Cell signaling and interaction, Hematological system development and function | ARL4A, DBNL, HNMT, LSS, NCL, OSBPL3, RNASEH1, RPS23, SFRS3, SFRS7, SYNCRIP |
| Infection mechanism, Gene expression, Cancer | GMEB2, NASP, PSPC1, RAN, VAPA | |
| Carbohydrate metabolism, Molecular transport, Cellular development | EPM2AIP1 | |
| GCN5 up-regulated | Cardiovascular system development and function, Reproductive system development and function, cell morphology | ANTXR2, APLP2, DAZAP2, DNAJB6, IGSF1, LOC339344, PLA2G16, RGS10, RNF149, SERP-1, SMPDL3A, TMC01 |
| Lipid metabolism, Molecular transport, Small molecule biochemistry, | AGTR1, AQP8, CCL20, CYP2J2, DUSP5, MDK, MRPL36, TGFBR2, TRAK1 | |
| Cell death, Respiratory disease, Cellular development | ARHGD1B, BEGAIN, BNIP3L, EEF1A2, LYVE1, MBNL2, MOBKL3, NUDT21, STRADB, SURF | |
| RNA Post-translational modification | SNORD13 | |
| Cancer, Gastrointestinal disease disease, Hepatic system disease | CCNY | |
| GCN5 down- regulated | Gene expression, Lipid metabolism, Molecular transport | CASP3, DNMT3B, HMGCR, HMGCS1, MKNK2, MMP7, NSUN2, PDHA1, SCML1, SLC2A3, UBD |
| Organismal development, Gene expression, infection mechanism | KAT2A, RING1 | |
| Genetic disorder, Neurological disease, Cell signing | GNB1 | |
| Ethanol+ GCN5 | Gene expression, Cardiac fibrosis, Cardiovascular disease | LSS, MMP7, MVD, RAN, RNASE1, RPS23, SLC44A2, ZIC2 |
| SLC16A9 |
Validation of microarray by real-time qPCR
A set of six genes, SLC44A2, ZIC-2, SLC16A9, RAN, RNASE-H1 and GCN5 was selected for validation by real-time qPCR. The data showed a pattern of expression levels consistent with the microarray results. Ethanol treatment increased SLC44A2 transcript level in the presence of nontargeting siRNA (4.4 fold) and had a small effect (1.8 fold increase) on the GCN5 mRNA itself (NTE vs NT). Transfection with GCN5 target siRNA reduced GCN5 transcript level in both control (T vs. NT) and ethanol-treated (TE vs NTE) cells and attenuated the SLC44A2 transcript following ethanol treatment (NT vs NTE). In contrast, the expression of the gene for transcriptional repressor zinc finger protein ZIC2 was significantly up-regulated (~ 2 fold) either by ethanol treatment or GCN5 silencing. Transcripts for the proton-linked monocarboxylate transporter SLC16A9 was also up-regulated (~ 1.8 fold) either by ethanol treatment or GCN5 silencing. Interestingly, the gene for RAN (RAs-Nuclear protein) involved in nuclear protein transport and RNASE-H1, that hydrolyzes RNA in RNA-DNA hybrid, were both down-regulated (about 30 %) by ethanol and significantly (p<0.001) up-regulated by GCN5 silencing. Thus, knockdown of GCN5 correlated with differential expression of several genes that included reduction in the induction of SLC44A2 by ethanol.
DISCUSSION
This is the first study demonstrating a role for the HAT, GCN5, in ethanol induced acetylation of histone H3 at lysine 9. Knockdown of GCN5 with siRNA and the concomitant decreases in the expression of GCN5 mRNA & protein, HAT activity and ethanol induced H3AcK9, lead us to conclude that GCN5 is involved in ethanol induced increase in H3AcK9. Ethanol exposure resulted in no statistically significant change in GCN5 protein expression. This suggests that mechanisms other than an increase in the GCN5 protein levels are involved in ethanol induced GCN5 activation. This may include post-translational mechanisms, and the role of other co-activators/co-repressors. GCN5 is an important HAT since its deletion in mice leads to embryonic death (Xu et al., 2000; Yamauchi et al., 2000). Several histone actyltransferases have been identified in biological systems. Modulations in HAT activities have been proposed to play role(s) in genome stability, DNA repair/damage, development & cellular growth, and tumorogenic responses of the cells. HATs are also known to be involved in the formation of complexes with other components at the transcriptional level and, in this case, the interactions among these components in the regulation of HAT activity are likely (Lee and Workman, 2007). Transcriptional activation of genes due to HAT activation by ethanol may lead to expression of genes involved in alcoholic injury. Although the present investigation dealt with an in vitro cell culture model, the in vivo consequences of HAT activation have to be addressed next, especially as it relates to the increase in GCN5 activity.
Epigenetic consequences of the interaction between ethanol and GCN5 silencing were elaborated with gene array analysis. These studies also shed light, for the first time, on the transcriptional effect of GCN5 silencing on a human hepatic tumor cells. Silencing of GCN5 itself affected expression of multiple genes, and so did ethanol exposure to VA13 cells. Surprisingly, knockdown of GCN5 significantly affected expression of only a few ethanol induced genes despite the fact that ethanol up-and down-regulated several genes in VA13 cells. This indicated that expression of only a small number of ethanol induced genes are mediated via GCN5 in this cell under conditions used in this study. Among these genes, change in SLC44A2 (a putative choline transporter) was the most striking because its expression by ethanol was dramatically reduced by GCN5 silencing. Metabolism of ethanol has been documented to affect choline absorption in rat jejunum after chronic ethanol administration (Hajjar et al., 1985) but, to our knowledge, there is no study of the relationship between ethanol and any specific choline transporter. In this regard, changes in the choline transporter expression and hence the choline transport, could be of importance. For example, synthesis of phosphatidylcholine (PC), via CDP-choline pathway, can be modulated by levels of choline and this in turn can result in altered PC levels. PC is known substrate for other lipid mediators. In the case of ethanol PC serves as a substrate for the generation of phosphatidylethanol, PEth, via phospholipase D. Another implication is in the methyl group donating pathways such as metabolism of betaine and s- adenosyl methionine (SAMe), in liver and other systems (Shukla et al, 2008). The levels of betaine and SAMe have relevance to the oxidative stress. SAMe levels also affect methylation of PE (phosphatidylethanolamine) to PC mediated via PE-methyl transferases. Furthermore, choline will affect methylation dependent epigenetic pathways eg. methylation of DNA and histones. These exciting possibilities must be examined next. The fact that GCN5 silencing itself affects expression of different genes, representing diverse functional networks, opens an avenue for additional investigations into its pharmacological and molecular implications in liver disease, cancer and other patho-physiological conditions.
Supplementary Material
Acknowledgments
This work was supported by NIH grant AA016347 from the National Institute on Alcohol Abuse & Alcoholism. A part of this work was presented at Experimental Biology 2009 meeting (Choudhury et al, 2009).
We are grateful to Dr. Sharon Dent of the University of Texas, MD Anderson Cancer Centre for helpful advice regarding GCN5 experiments. We are thankful to Dr. Greg Sowa and Dr. Annaya Aroor for useful comments, to Mr. Daniel Jackson for technical help and to DNA core facility of MU for gene array analysis. This work was supported by National Institute on Alcohol Abuse & Alcoholism grant AA016347.
The abbreviations used are
- GCN5
General control non-depressible 5
- HAT
histone acetyl transferase
- HDAC
histone deacetylase
- H3AcK9
Histone H3 acetylated at lysine 9
- NT
non-target siRNA
- T
GCN5 target siRNA
Footnotes
Publisher's Disclaimer: This is a PDF file of an unedited manuscript that has been accepted for publication. As a service to our customers we are providing this early version of the manuscript. The manuscript will undergo copyediting, typesetting, and review of the resulting proof before it is published in its final citable form. Please note that during the production process errors may be discovered which could affect the content, and all legal disclaimers that apply to the journal pertain.
References
- Bardag-Gorce F, French BA, Dedes J, Li J, French SW. Gene expression patterns of the liver in response to alcohol: in vivo and in vitro models compared. Exp Mol Pathol. 2006;80:241–251. doi: 10.1016/j.yexmp.2005.12.006. [DOI] [PubMed] [Google Scholar]
- Benjamini Y, Yekutieli D. The control of the false discovery rate in multiple testing under dependency. Ann Stat. 2001;29:1165–1188. [Google Scholar]
- Calvano SE, Xiao W, Richards DR, Felciano RM, Baker HV, Cho RJ, Chen RO, Brownstein BH, Cobb JP, Tschoeke SK, Miller-Graziano C, Moldawer LL, Mindrinos MN, Davis RW, Tompkins RG, Lowry SF. Inflammation and host response to injury: large scale collaborative research program. A network analysis of systemic inflammation in humans. Nature. 2005;437:1032–1037. doi: 10.1038/nature03985. [DOI] [PubMed] [Google Scholar]
- Carre C, Szymczak D, Pidoux J, Antoniewski C. The histone H3 acetylase dGcn5 is a key player in Drosophila melanogaster metamorphosis. Mol Cell Biol. 2005;25:8228–8238. doi: 10.1128/MCB.25.18.8228-8238.2005. [DOI] [PMC free article] [PubMed] [Google Scholar]
- Choudhury M, Shukla SD. Surrogate alcohols and their metabolites modify histone H3 acetylation: involvement of histone acetyl transferase and histone deacetylase. Alcohol Clin Exp Res. 2008;32:829–839. doi: 10.1111/j.1530-0277.2008.00630.x. [DOI] [PubMed] [Google Scholar]
- Choudhury M, Pandey RS, Clemens DL, Davis JW, Lim RW, Shukla SD. Silencing of histone acetyltransferase GCN5 affects gene expression in human hepatoma cells: A gene array analysis. FASEB J. 2009;23:585.8. [Google Scholar]
- Choudhury M, Park PH, Shukla SD. Oxidative stress and ethanol induced histone acetylation in primary rat hepatocytes. FASEB J. 2008;22:lb632. [Google Scholar]
- Clemens DL, Forman A, Jerrells TR, Sorrell MF, Tuma DJ. Relationship between acetaldehyde levels and cell survival in ethanol-metabolizing hepatoma cells. Hepatology. 2002;35:1196–1204. doi: 10.1053/jhep.2002.32668. [DOI] [PubMed] [Google Scholar]
- Deitrich RA, Harris RA. How much alcohol I use in my experiments? Alcohol Clin Exp Res. 1996;20:1–2. doi: 10.1111/j.1530-0277.1996.tb01033.x. [DOI] [PubMed] [Google Scholar]
- Hajjar JJ, Baker ER, Renison DM, Gardner PW, Zirin R, Tomicic TK. Effect of ethanol on choline transport in rat jejunum. Am J Physiol. 1985;249:G177–G183. doi: 10.1152/ajpgi.1985.249.2.G177. [DOI] [PubMed] [Google Scholar]
- Kanehisa M, Goto S, Furumichi M, Tanabe M, Hirakawa M. KEGG for representation and analysis of molecular networks involving disease and drugs. Nucleic Acids Res. 2010;38:D355–D360. doi: 10.1093/nar/gkp896. [DOI] [PMC free article] [PubMed] [Google Scholar]
- Kim JS, Shukla SD. Acute in vivo effect of ethanol (binge drinking) on histone H3 modifications in rat tissues. Alcohol Alcohol. 2006;41:126–132. doi: 10.1093/alcalc/agh248. [DOI] [PubMed] [Google Scholar]
- Kundu TK, Dasgupta D. Choromatin and Disease. Subcell Biochem. 2007;41:458. [Google Scholar]
- Kuo MH, Brownell JE, Sobel RE, Ranalli TA, Cook RG, Edmondson DG, Roth SY, Allis CD. Transcription-linked acetylation by Gcn5p of histones H3 and H4 at specific lysines. Nature. 1996;383:269–271. doi: 10.1038/383269a0. [DOI] [PubMed] [Google Scholar]
- Lee KK, Workman JL. Histone acetyltransferase complexes: one size doesn’t fit all Nature Reviews: Mol. Cell Biol. 2007;8:284–295. doi: 10.1038/nrm2145. [DOI] [PubMed] [Google Scholar]
- Lieber CS. Alcoholic fatty liver: its pathogenesis and mechanism of progression to inflammation and fibrosis. Alcohol. 2004;34:9–19. doi: 10.1016/j.alcohol.2004.07.008. [DOI] [PubMed] [Google Scholar]
- Marmorstein R, Roth SY. Histone acetyltransferases: function, structure, and catalysis. Curr Opin Genet Dev. 2001;11:155–161. doi: 10.1016/s0959-437x(00)00173-8. [DOI] [PubMed] [Google Scholar]
- Park PH, Miller R, Shukla SD. Acetylation of histone H3 at lysine 9 by ethanol in rat hepatocytes. Biochem Biophys Res Commun. 2003;306:501–514. doi: 10.1016/s0006-291x(03)01040-4. [DOI] [PubMed] [Google Scholar]
- R Development Core Team. R Foundation for Statistical Computing; Vienna, Austria: 2006. http://www.r-project.org. [Google Scholar]
- Schrem H, Klempnauer J, Borlak J. Liver-enriched transcription factors in liver function and development. Part I: the hepatocyte nuclear factor network and liver-specific gene expression. Pharmacol Rev. 2002;54:129–158. doi: 10.1124/pr.54.1.129. [DOI] [PubMed] [Google Scholar]
- Shukla SD, Velazquez J, French S, Lu S, Ticku M, Zakhari S. Emerging role of epigenetics in the actions of alcohol. Alcohol Clin Exp Res. 2008;32:1525–1534. doi: 10.1111/j.1530-0277.2008.00729.x. [DOI] [PubMed] [Google Scholar]
- Smyth GK. Statistical Applications in Genetics and Molecular Biology. 2004;3:3. doi: 10.2202/1544-6115.1027. http://www.bepress.com/sagmb/vol3/iss1/art3. [DOI] [PubMed]
- Smyth GK. In: Springer. Gentleman R, Carey V, Dudoit S, Irizarry R, Huber W, editors. New York: 2005. [Google Scholar]
- Struhl K. Histone acetylation and transcriptional regulatory mechanisms. Genes Dev. 1998;12:599–606. doi: 10.1101/gad.12.5.599. [DOI] [PubMed] [Google Scholar]
- Suka N, Suka Y, Carmen AA, Wu J, Grunstein M. Highly specific antibodies determine histone acetylation site usage in yeast heterochromatin and euchromatin. Mol Cell. 2001;8:473–479. doi: 10.1016/s1097-2765(01)00301-x. [DOI] [PubMed] [Google Scholar]
- Turner BM. Histone acetylation as an epigenetic determinant of long-term transcriptional competence. Cell Mol Life Sci. 1998;54:21–31. doi: 10.1007/s000180050122. [DOI] [PMC free article] [PubMed] [Google Scholar]
- Xu W, Edmondson DG, Evrard YA, Wakamiya M, Behringer RR, Roth SY. Loss of Gcn5l2 leads to increased apoptosis and mesodermal defects during mouse development. Nat Genet. 2000;26:229–232. doi: 10.1038/79973. [DOI] [PubMed] [Google Scholar]
- Yamauchi T, Yamauchi J, Kuwata T, Tamura T, Yamashita T, Bae N, Westphal H, Ozato K, Nakatani Y. Distinct but overlapping roles of histone acetylase PCAF and of the closely related PCAF-B/GCN5 in mouse embryogenesis. Proc Natl Acad Sci USA. 2000;97:11303–11306. doi: 10.1073/pnas.97.21.11303. [DOI] [PMC free article] [PubMed] [Google Scholar]
- Zhang W, Bone JR, Edmondson DG, Turner BM, Roth SY. Essential and redundant functions of histone acetylation revealed by mutation of target lysines and loss of the Gcn5p acetyltransferase. EMBO J. 1998;17:3155–3167. doi: 10.1093/emboj/17.11.3155. [DOI] [PMC free article] [PubMed] [Google Scholar]
Associated Data
This section collects any data citations, data availability statements, or supplementary materials included in this article.