Abstract
Objective
To determine if 3D shape analysis precisely diagnoses right and left differences in asymmetry patients
Study Design
Cone-beam CT data was acquired pretreatment from 20 patients with mandibular asymmetry. 3D shape analysis was used to localize and quantify the extent of virtually simulated asymmetry. Two approaches were used: (1) mirroring on the midsagittal plane determined from landmarks and (2) mirroring on an arbitrary plane, then registering on the cranial base of the original image. The validation presented in this study used simulated data and has been applied to three clinical cases.
Results
For mirroring on the midsagittal plane there was a >99% probability that the difference between measured and simulated asymmetry was less than 0.5 mm. For mirroring with cranial base registration, there was a >84% probability of differences less than 0.5 mm.
Conclusions
Mandibular asymmetry can be precisely quantified with both mirroring methods. Cranial base registration has the potential to be used for patients with trauma situations or when key landmarks are unreliable or absent.
INTRODUCTION
Precise knowledge of the location and magnitude of mandibular asymmetry is essential for the diagnosis of facial deformities and for the planning of corrective and reconstructive procedures.1 Computed tomography, either cone-beam (CBCT) or spiral CT, coupled with software that allows virtual preparation of the operative plan, such as 3DMDvultus, 3DMD, Atlanta, GA; Maxilim, Medicim, Mechelen, Belgium; Dolphin Imaging, Dolphin Imaging & Management Solutions, Chatsworth, CA; InVivoDental, Anatomage, San Jose, CA; and SurgiCase, Materialise, Leuven, Belgium), offer greatly improved precision in accomplishing this, but validation of currently available methods is lacking. The identification of a reference plane is essential in evaluating asymmetry, because it allows correction of the head tilt in the image data and facilitates visual and quantitative assessment of symmetry. In addition, the plane can be used in asymmetrical deformities to mirror the healthy mandibular side.2 This technique requires adequate definition of the plane used in the mirroring operation. The result can then be employed as a template for diagnosis and planning for correction of the affected side.
Several methods have been proposed to compute the reference plane using volumetric image datasets.2–6 Previous work on a landmark-based symmetry plane, using nasion, anterior nasal spine and basion to locate the midline, showed that the definition of this plane is a reliable procedure.7 A second method is based on mirroring the mandible in an arbitrary plane, and then rigidly registering at the cranial base, to provide information of the mandibular asymmetry relative to the face.8 This can be important if the landmarks have been obscured by trauma or are affected by craniofacial disorders like craniofacial microsomia or clefting, in which entire regions of the anatomy may be missing or severely dislocated.
As computer systems to assess mandibular asymmetry three-dimensionally begin to be used in clinical practice, it is important to validate the clinical application of these methods and critically assess the difficulty of quantifying asymmetry. Specifically, we tested two mirroring approaches: (1) mirroring on the midsagittal plane determined from landmarks and (2) mirroring on an arbitrary plane, then registering on the cranial base of the original image. Our aims were to determine if 3D shape analysis virtually performed on the CBCT segmentations of the face correctly quantified and located mandibular asymmetries when the two different mirroring techniques were used, and to demonstrate its application to aid orthognathic surgery planning in 3 translational and 3 rotational planes of space.
STUDY DESIGN
Pretreatment CBCT images of 20 patients with asymmetry were taken from a consecutive prospectively collected sample of patients who sought care through our Dentofacial Deformities Program and who consented to CBCT imaging as part of their diagnostic evaluation. Patients ranged in age from 9.3 to 41.2 years with a mean age of 21.4 ± 6.7 years. Inclusion criteria were patients with clinically detectable asymmetry, defined as more than 2 mm of chin deviation or cant of the occlusal plane before the start of their orthodontic treatment. Exclusion criteria were a history of previous jaw surgery or a condition that required reconstructive surgery, as graft planning was not the objective of this study.
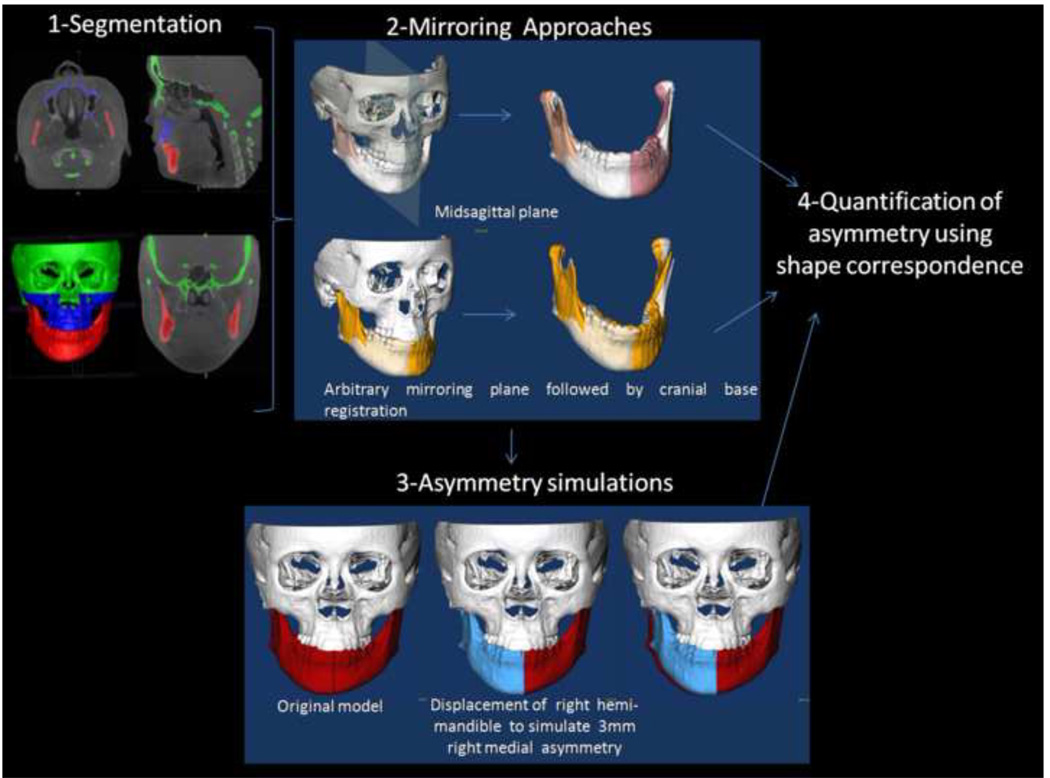
The sequence of image analysis procedures in this study are summarized in Figure 1. NewTom 3G CBCT (AFP Imaging, Elmsford, NY) images with the patient in supine position were obtained prior to any treatment. Virtual 3D models were created by segmentation that involved outlining the shape of structures visible in the cross-sections of a volumetric dataset from the CBCT images, so that anatomical areas of interest were delineated (Figure 2). Segmentation was performed with ITK-SNAP open source software. 9–11 The models were built from a set of ~ 300 axial cross-sectional slices for each image with the image voxels reformatted for an isotropic of 0.5 × 0.5 × 0.5 mm. This resolution was used because higher spatial resolution with smaller slice thickness would have increased image file size and required greater computational power and user interaction time.
Figure 1. Validation of asymmetry quantification methods.
(1) Cone beam CTs are taken for each patient and segmentation involves delineation of the anatomical areas of interest. (2) Visualization of the two mirroring techniques used to create mirror images for quantification of right and left side differences. (3) Simulation of asymmetry. (4) Quantification of asymmetry.
Figure 2. Image segmentation.
Cone beam CT images are imported as DICOM files into ITK Snap. In a process known as semiautomatic segmentation, anatomical areas of interest are identified and delineated to construct virtual surface models of the hard tissues of the face. The automatic segmentation procedures in ITK-SNAP use 2 active contour methods to compute feature images based on the CBCT image’s gray level intensity and boundaries. Manual editing is performed to ensure accuracy of the segmentations. It takes approximately 1 hour for a trained student to generate the surface model. The images can be viewed in three dimensions and as axial, coronal, and sagittal slices of each image.
Reference Planes and Mirroring
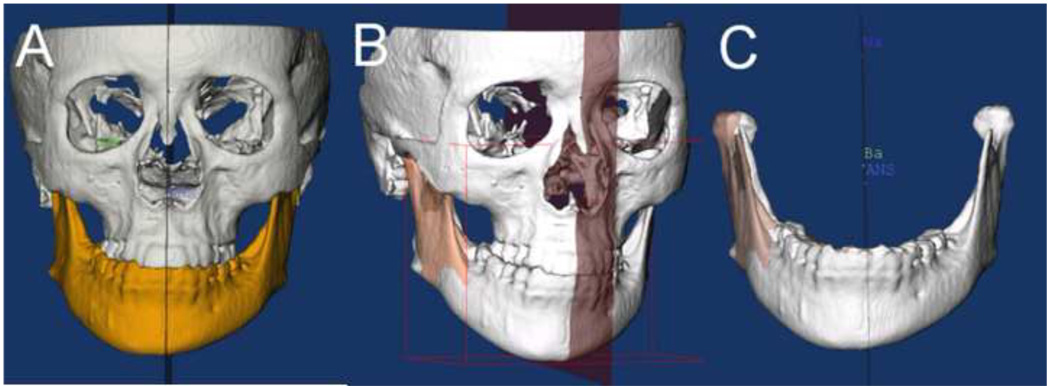
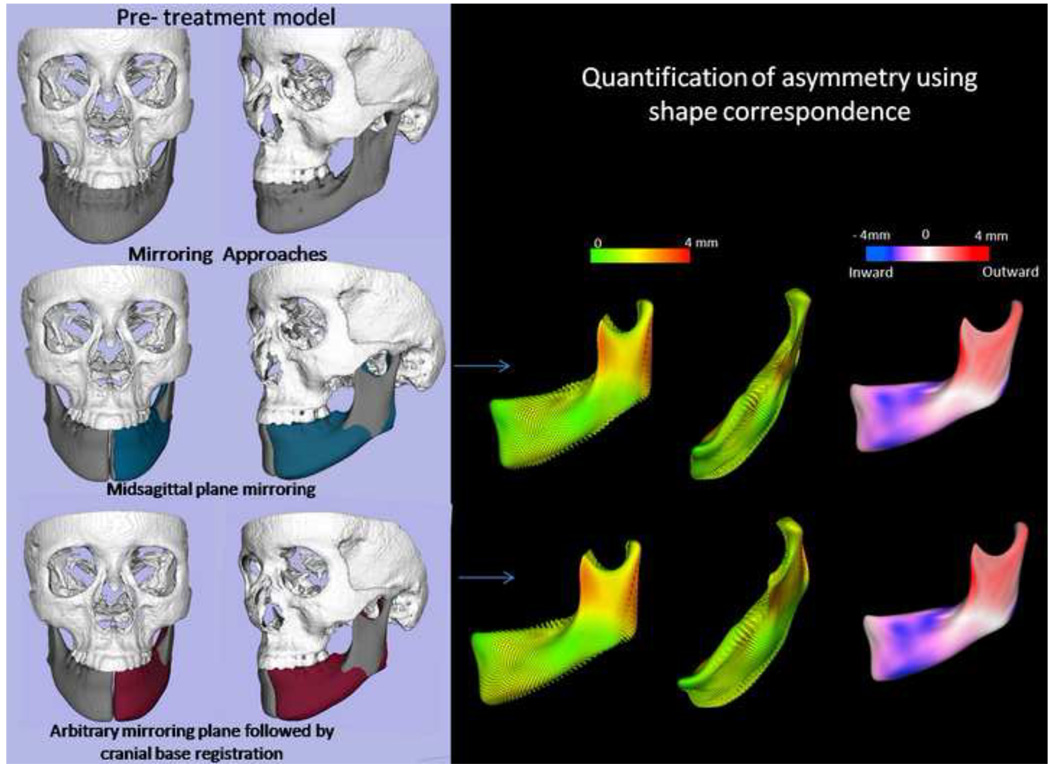
In the landmark-based approach, nasion (Na), anterior nasal spine (ANS) and basion (Ba) were defined for each patient. The midsagittal plane was defined as the plane passing through those three landmarks. The resultant midsagittal plane was used to create mirrors for both halves of the mandible, creating right and left hemi-mandibles (Figure 3).
Figure 3. Three-dimensional model mirroring on the midsagittal plane.
Mirroring can be a valuable technique in the planning treatment of asymmetries. As shown below, the virtual 3D surface of the mandible (A) has been colored yellow. (B) The left ramus was mirrored onto the right side using the CMF applications mirror function and the midsagittal plane was defined for the image. The right lateral ramus was then overlaid with the mirror of the left side. (C) Shows in detail the overlay of the mirror and actual model.
The midsagittal plane was identified 5 times on 22 randomly selected patients, and the differences in quantification of asymmetry were not statistically significant, serving as a measure of reproducibility of midsagittal plane identification.7 Paired T and the Cochran-Mantel-Haenszel tests were used to test differences between the two mirroring approaches. The average surface distances were calculated for nine anatomical regions of interest (ROI): the lateral pole, medial pole, anterior and posterior surfaces of both condyles, lateral surface of the rami and corpora of the mandible, inferior and posterior surfaces of the mandible, and anterior surface of the symphysis.
In the alternative method, each virtual model was mirrored on an arbitrary plane. The mirroring is done by arbitrarily converting the image orientation in ITK-SNAP from (Right-Left, Antero-Posterior and Infero-Superior) to (Left-Right, Antero-Posterior and Infero-Superior). The original and the arbitrarily mirrored images were then registered on the cranial base (Figure 4). The IMAGINE software (available for free)12 was used to mask facial structures displaced with growth or treatment, and to perform a fully automated, voxel-wise, rigid registration at the cranial base.13 The registration of the cranial base uses maximization of mutual information to avoid observer-dependent techniques based on overlap of anatomic landmarks. After the software masks the maxillary and mandibular structures, it compares the gray level intensity of each voxel in the cranial base to register the 2 CBCT images. These rotation and translation parameters are also applied to register the 3D models. After registration, we can assess the overlay of the 3D models.
Figure 4. Arbitrary plane mirroring followed by cranial base registration approach.
(A) Cranial base virtual surface model for a patient (white) and arbitrarily mirrored image model (purple); (B) original model and arbitrary mirror matching on the cranial base as a result of a voxel-based registration; (C) color map of the surface distance between the registered original and arbitrary mirror models shown at 0-mm surface distances (green); (D) Virtual surface model (white) and registered arbitrarily mirrored image model (orange); (E) Close-up showing mandibular asymmetry.
The CranioMaxilloFacial (CMF) software (Müller Institute, University of Bern, Switzerland) developed under the funding of the Co-Me network,14,15 was then used to display the superimposed images with the two approaches. This superimposition is fully automated, using voxel-wise rigid registration of the cranial base instead of landmark matching, which is observer-dependent and highly variable. After masking out maxillary and mandibular structures, the registration transform was computed solely on the grey level intensities in the cranial base. Rotation and translation parameters were calculated and then applied to register the 3D models.
Asymmetry Simulation
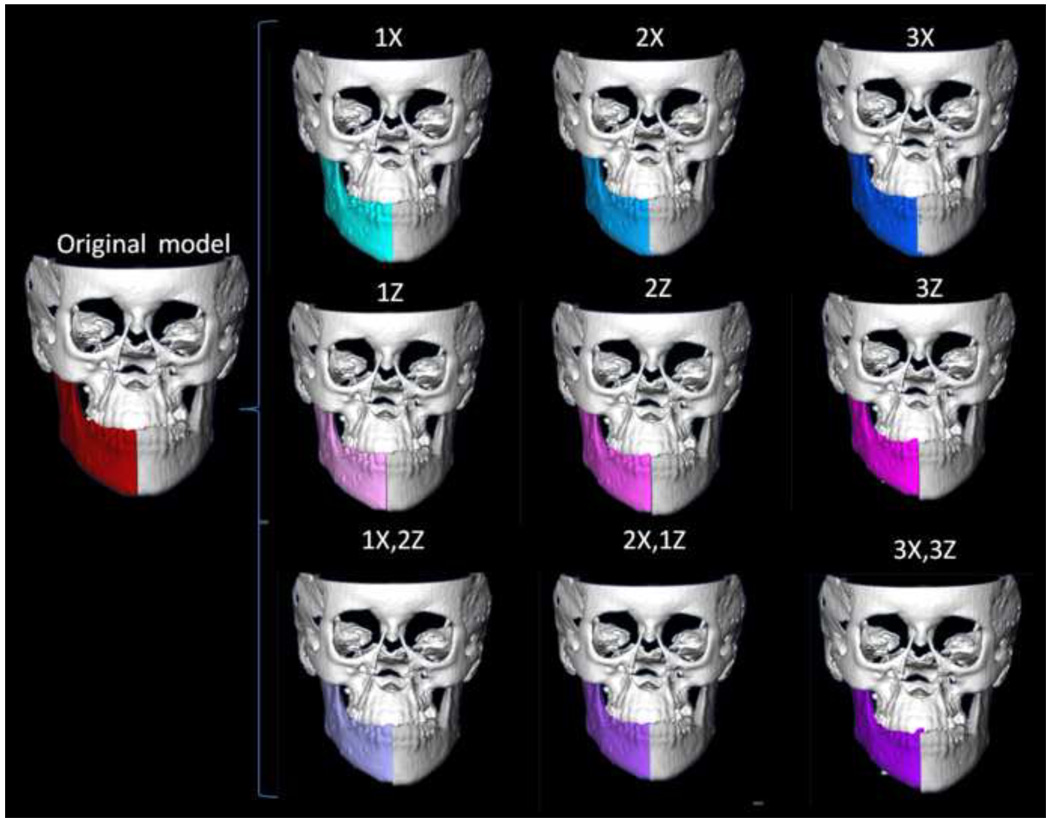
Asymmetry simulation was also performed with the CMF software. For each left and right hemi-mandible, we simulated asymmetry by translating the original models with a known value of added asymmetric displacement, where × is a vertical and z is a lateral plane of translation. Asymmetric lateral and superior-inferior simulated translational movements were performed to create additional asymmetries of known magnitude (1, 2 and 3mm simulations). Asymmetries were not simulated in the y axis (antero-posterior) because antero-posterior displacements of the mandible do not alter mandibular symmetry.
After the virtual simulation of asymmetry, the mirror models were used by a single examiner to quantify the asymmetry and visualize the right and left side differences. This was done by using semi-transparent overlays of displaced models which superimposed on the original mirror models (Figure 5).
Figure 5. Asymmetry simulation.
3-dimensional virtual surface models of hemi-mandibles are displaced in the lateral (X axis, yaw) and superior inferior (Z axis, roll) planes of spaces by 1, 2 and 3mm. The 9 different simulations are shown.
Quantification of Differences between Simulated Asymmetries and Mirror Models
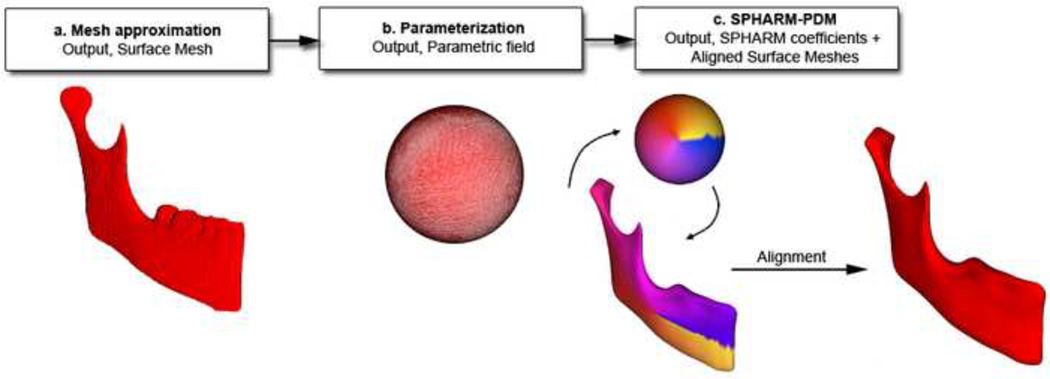
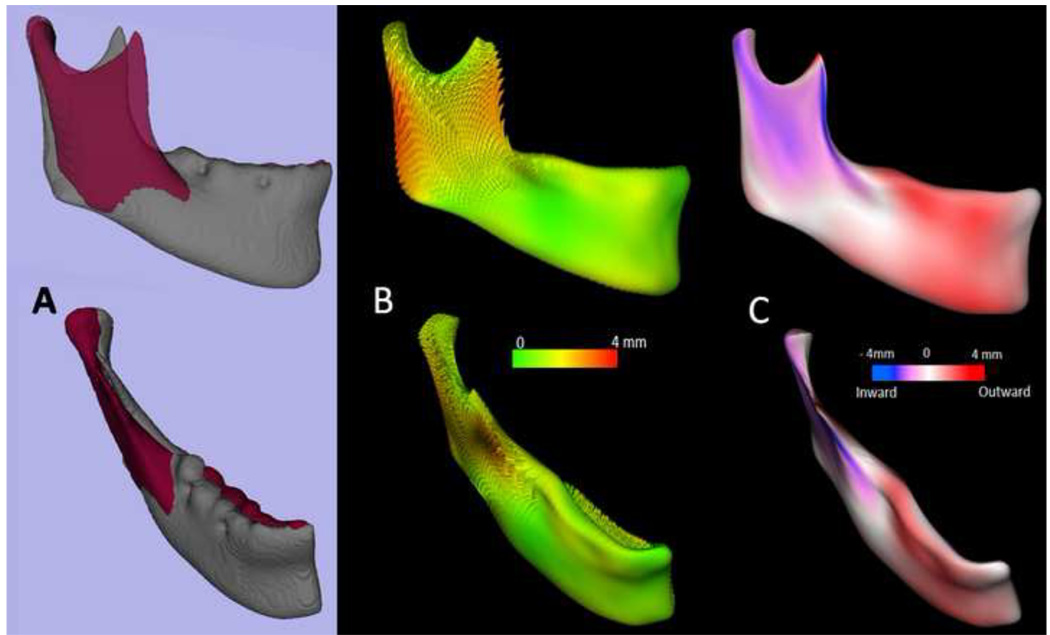
A novel 3D shape analysis, Shape Correspondence (SC), was employed to provide a unique and symmetric point correspondence across all measured surfaces. The correspondence was computed via mapping every point on the mandibular 3D surface models to a unique position on the unit sphere (UNC SPHARM-PDM toolbox, open source software, developed as part of the NAMIC Consortium, UNC Neuro-Image Laboratory).16–17 This was followed by generating a uniformly triangulated surface based on this spherical mapping (Figure 6).18–20 Jaw asymmetry was measured for each right and left hemi-mandible, comparing the original and the mirrored structures. First, subtraction of mirrored and original (actual) asymmetry models provided color-coded corresponding distance maps and maps of vectors of differences between these models. Second, subtraction of mirror and simulated asymmetry models allowed display using color-coded corresponding distance maps and maps of vectors of differences between these models.
Figure 6. Description of 3D shape analysis procedures.
The segmented 3-dimensional surface models of hemi-mandibles are converted into surface meshes, and a spherical parametrization is computed for the surface meshes using area-preserving and distortion-minimizing spherical mapping. The SPHARM description is computed from the mesh and its spherical parametrization. Using the first-order ellipsoid from the spherical harmonic coefficients, the spherical parametrizations establish correspondence across all surfaces. The SPHARM description is then sampled into a triangulated surface (SPHARM-PDM). The hemi-mandibles are represented using 4002 surface points.
The distance maps measure the magnitude of the differences between the mirror and simulated asymmetry point-based models, while the vector maps offer directionality (Figure 7). The 6 degrees of freedom (DOF) of the differences were calculated using rigid Procrustes alignment, which is the geometric transformation that best maps and measures positional changes between point-based correspondent models. The measured simulated translations with SC/Procrustes were the absolute differences between the measurements of simulated asymmetries and the actual asymmetry.
Figure 7. Quantification of mandibular asymmetry for a patient using 3D shape analysis.
(A) original model (grey) and left hemi-mandible arbitrary mirror matching on the cranial base(maroon); (B) shape analysis can be used to quantify the right and left differences as represented in this vectorial color map of the surface distance between the registered original and arbitrary mirror models; (C) Signed color maps showing the directionality of the differences; the left ramus is wider and left corpus is narrower than the right.
Statistical Analysis
Three statistical methods were used to analyze the accuracy of asymmetry representation: (1) P(| X̅ − known |< .5), the probability that the sample mean measurement was within 0.5mm (translation) or 5° (rotation) of the true value of the simulated asymmetry, (2) 95% confidence interval (CI), and (3) 95% prediction interval (PI). The 95% CI provides an interval with 95% confidence that the true mean falls within the interval. The confidence interval does not necessarily contain the true mean. The 95% PI is an estimate of an interval that a future observation of a random variable will fall with certain probability. It can be considered as a “confidence interval” for prediction. The prediction interval is always wider than the confidence interval because of the additional uncertainty for prediction. All analyses were based on the assumption of a normal distribution for this population.
An overview of the methodology is shown in Figure 1. After the validation study, 3D shape analysis was then applied as a diagnostic tool to aid treatment planning for asymmetry patients.
RESULTS
Table 1 shows the results for the midsagittal plane mirroring and describes the probabilities, confidence intervals and prediction intervals for each x, y and z plane of rotation and translation measured for the simulated asymmetries using mirroring in the midsagittal plane. Note that for the majority of the assessments, the probability (P) that the magnitude of the asymmetry measurement difference from the known value of simulated asymmetry was less than 0.5mm (translation) or 5° (rotation) was high, ranging from 0.99 to 1. For the arbitrary mirroring/cranial base registration approach (Table 2), the same probabilities ranged from 0.84 to 1.
Table 1.
Probabilities, confidence intervals and prediction intervals for each x, y and z plane for rotation and translation measured for the simulated asymmetries using mirroring in the mid-sagittal plane.
| Mid sagittal plane |
Known asymmetry simulation |
6 degrees of freedom |
Mean±SD | CI(Min- Max) |
PI(Min- Max) |
P(| measured mean- known|<.5) |
|---|---|---|---|---|---|---|
| Mirror_ translation 1x |
0 | Rx | 0.00±0.00 | (0.00–0.01) | (0.00–0.01) | 1 |
| 0 | Ry | 0.01±0.01 | (0.00–0.01) | (−0.02–0.03) | 1 | |
| 0 | Rz | 0.01±0.01 | (0.00–0.01) | (−0.01–0.02) | 1 | |
| 1 | Tx | 1.02±0.11 | (0.97–1.08) | (0.79–1.26) | 1 | |
| 0 | Ty | 0.00±0.01 | (0.00–0.01) | (−0.01–0.02) | 1 | |
| 0 | Tz | 0.00±0.00 | (0.00–0.01) | (0.00–0.01) | 1 | |
| Mirror_ translation 1x_2z |
0 | Rx | 0.01±0.01 | (0.00–0.01) | (−0.01–0.03) | 1 |
| 0 | Ry | 0.01±0.01 | (0.00–0.01) | (−0.01–0.03) | 1 | |
| 0 | Rz | 0.01±0.01 | (0.00–0.01) | (−0.01–0.03) | 1 | |
| 1 | Tx | 1.03±0.11 | (0.97–1.08) | (0.79–1.27) | 1 | |
| 0 | Ty | 0.01±0.00 | (0.00–0.01) | (−0.01–0.02) | 1 | |
| 2 | Tz | 2.00±0.01 | (1.99–2.00) | (1.99–2.01) | 1 | |
| Mirror_ translation 1z |
0 | Rx | 0.00±0.00 | (0.00–0.01) | (−0.01–0.01) | 1 |
| 0 | Ry | 0.01±0.02 | (0.00–0.02) | (−0.02–0.05) | 1 | |
| 0 | Rz | 0.01±0.01 | (0.00–0.01) | (−0.01–0.03) | 1 | |
| 0 | Tx | 0.08±0.34 | (−0.08–0.23) | (−0.64–0.80) | 0.99 | |
| 0 | Ty | 0.01±0.01 | (0.00–0.01) | (−0.01–0.02) | 1 | |
| 1 | Tz | 1.00±0.00 | (0.99–1.00) | (0.99–1.01) | 1 | |
| Mirror_ translation 2x |
0 | Rx | 0.01±0.01 | (0.00–0.01) | (−0.01–0.02) | 1 |
| 0 | Ry | 0.00±0.01 | (0.00–0.01) | (−0.01–0.02) | 1 | |
| 0 | Rz | 0.00±0.01 | (0.00–0.01) | (−0.01–0.02) | 1 | |
| 2 | Tx | 1.97±0.11 | (1.92–2.03) | (1.73–2.22) | 1 | |
| 0 | Ty | 0.00±0.00 | (0.00–0.01) | (−0.01–0.01) | 1 | |
| 0 | Tz | 0.00±0.00 | (0.00–0.01) | (0.00–0.01) | 1 | |
| Mirror_ translation 2x_1z |
0 | Rx | 0.01±0.01 | (0.00–0.01) | (−0.01–0.02) | 1 |
| 0 | Ry | 0.01±0.01 | (0.01–0.02) | (−0.02–0.04) | 1 | |
| 0 | Rz | 0.01±0.01 | (0.01–0.02) | (−0.01–0.03) | 1 | |
| 2 | Tx | 1.97±0.11 | (1.92–2.03) | (1.73–2.21) | 1 | |
| 0 | Ty | 0.01±0.01 | (0.00–0.01) | (−0.01–0.02) | 1 | |
| 1 | Tz | 1.00±0.00 | (0.99–1.00) | (0.99–1.01) | 1 | |
| Mirror_ translation 2z |
0 | Rx | 0.01±0.01 | (0.00–0.01) | (−0.01–0.02) | 1 |
| 0 | Ry | 0.01±0.01 | (0.00–0.01) | (−0.02–0.03) | 1 | |
| 0 | Rz | 0.01±0.01 | (0.00–0.01) | (−0.01–0.02) | 1 | |
| 0 | Tx | 0.08±0.34 | (−0.08–0.23) | (−0.64–0.80) | 0.99 | |
| 0 | Ty | 0.00±0.01 | (0.00–0.01) | (−0.01–0.02) | 1 | |
| 2 | Tz | 2.00±0.00 | (1.99–2.00) | (1.99–2.01) | 1 | |
| Mirror_ translation 3x |
0 | Rx | 0.01±0.00 | (0.00–0.01) | (0.00–0.01) | 1 |
| 0 | Ry | 0.01±0.01 | (0.00–0.02) | (−0.02–0.04) | 1 | |
| 0 | Rz | 0.01±0.01 | (0.00–0.01) | (−0.01–0.02) | 1 | |
| 3 | Tx | 2.92±0.34 | (2.77–3.08) | (2.21–3.64) | 0.99 | |
| 0 | Ty | 0.00±0.01 | (0.00–0.01) | (−0.01–0.02) | 1 | |
| 0 | Tz | 0.00±0.00 | (0.00–0.01) | (−0.00–0.01) | 1 | |
| Mirror_ translation 3x_3z |
0 | Rx | 0.01±0.01 | (0.00–0.01) | (−0.01–0.02) | 1 |
| 0 | Ry | 0.01±0.01 | (0.00–0.01) | (−0.01–0.02) | 1 | |
| 0 | Rz | 0.01±0.01 | (0.00–0.01) | (0.00–0.02) | 1 | |
| 3 | Tx | 2.92±0.34 | (2.77–3.08) | (2.21–2.64) | 0.99 | |
| 0 | Ty | 0.00±0.01 | (0.00–0.01) | (−0.01–0.02) | 1 | |
| 3 | Tz | 3.00±0.00 | (2.99–3.00) | (2.99–3.01) | 1 | |
| Mirror_ translation 3z |
0 | Rx | 0.01±0.01 | (0.00–0.01) | (−0.01–0.02) | 1 |
| 0 | Ry | 0.01±0.01 | (0.00–0.02) | (−0.02–0.04) | 1 | |
| 0 | Rz | 0.01±0.01 | (0.00–0.01) | (−0.01–0.02) | 1 | |
| 0 | Tx | 0.08±0.34 | (−0.08–0.24) | (−0.64–0.80) | 0.99 | |
| 0 | Ty | 0.01±0.01 | (0.00–0.01) | (−0.01–0.02) | 1 | |
| 3 | Tz | 3.00±0.00 | (2.99–3.00) | (2.99–3.01) | 1 |
Table 2.
Probabilities, confidence and prediction intervals for each x, y and z plane for rotation and translation measured for the simulated asymmetries using mirroring with registration on the cranial base.
| Cranial base registration |
Known asymmetry simulation |
6 degrees of freedom |
Mean±SD | CI(Min- Max) |
PI(Min- Max) |
P(| measured mean- known|<.5) |
|---|---|---|---|---|---|---|
| Mirror_ translation 1x |
0 | Rx | 0.01±0.00 | (0.00–0.01) | (−0.01–0.02) | 1 |
| 0 | Ry | 0.01±0.01 | (0.00–0.01) | (−0.02–0.03) | 1 | |
| 0 | Rz | 0.01±0.01 | (0.00–0.01) | (−0.01–0.02) | 1 | |
| 1 | Tx | 1.02±0.11 | (0.97–1.08) | (0.79–1.26) | 1 | |
| 0 | Ty | 0.00±0.01 | (0.00–0.01) | (−0.01–0.02) | 1 | |
| 0 | Tz | 0.00±0.00 | (0.00–0.01) | (0.00–0.01) | 1 | |
| Mirror_ translation 1x_2z |
0 | Rx | 0.01±0.01 | (0.00–0.01) | (−0.01–0.03) | 1 |
| 0 | Ry | 0.01±0.01 | (0.00–0.01) | (−0.01–0.03) | 1 | |
| 0 | Rz | 0.01±0.01 | (0.00–0.01) | (−0.01–0.03) | 1 | |
| 1 | Tx | 1.03±0.11 | (0.97–1.08) | (0.79–1.27) | 1 | |
| 0 | Ty | 0.01±0.00 | (0.00–0.01) | (−0.01–0.02) | 1 | |
| 2 | Tz | 2.00±0.01 | (1.99–2.00) | (1.99–2.01) | 1 | |
| Mirror_ translation 1z |
0 | Rx | 0.00±0.00 | (0.00–0.01) | (−0.01–0.02) | 1 |
| 0 | Ry | 0.01±0.02 | (0.00–0.02) | (−0.02–0.05) | 1 | |
| 0 | Rz | 0.01±0.01 | (0.00–0.01) | (−0.01–0.03) | 1 | |
| 0 | Tx | 0.08±0.34 | (−0.08–0.23) | (−0.64–0.80) | 0.85 | |
| 0 | Ty | 0.01±0.01 | (0.00–0.01) | (−0.01–0.02) | 1 | |
| 1 | Tz | 1.00±0.00 | (0.99–1.00) | (0.99–1.01) | 1 | |
| Mirror_ translation 2x |
0 | Rx | 0.01±0.01 | (0.00–0.01) | (−0.01–0.03) | 1 |
| 0 | Ry | 0.00±0.01 | (0.00–0.01) | (−0.01–0.02) | 1 | |
| 0 | Rz | 0.00±0.01 | (0.00–0.01) | (−0.01–0.02) | 1 | |
| 2 | Tx | 1.97±0.11 | (1.92–2.03) | (1.73–2.22) | 1 | |
| 0 | Ty | 0.00±0.00 | (0.00–0.01) | (−0.01–0.01) | 1 | |
| 0 | Tz | 0.00±0.00 | (0.00–0.01) | (0.00–0.01) | 1 | |
| Mirror_ translation 2x_1z |
0 | Rx | 0.01±0.01 | (0.00–0.01) | (−0.01–0.02) | 1 |
| 0 | Ry | 0.01±0.01 | (0.01–0.02) | (−0.02–0.04) | 1 | |
| 0 | Rz | 0.01±0.01 | (0.01–0.02) | (−0.01–0.02) | 1 | |
| 2 | Tx | 1.97±0.11 | (1.92–2.03) | (1.73–2.21) | 1 | |
| 0 | Ty | 0.01±0.01 | (0.00–0.01) | (−0.01–0.02) | 1 | |
| 1 | Tz | 1.00±0.00 | (0.99–1.00) | (0.99–1.01) | 1 | |
| Mirror_ translation 2z |
0 | Rx | 0.01±0.01 | (0.00–0.01) | (−0.01–0.02) | 1 |
| 0 | Ry | 0.01±0.01 | (0.00–0.01) | (−0.02–0.03) | 1 | |
| 0 | Rz | 0.01±0.01 | (0.00–0.01) | (−0.01–0.02) | 1 | |
| 0 | Tx | 0.08±0.34 | (−0.08–0.23) | (−0.64–0.80) | 0.85 | |
| 0 | Ty | 0.00±0.01 | (0.00–0.01) | (−0.01–0.02) | 1 | |
| 2 | Tz | 2.00±0.00 | (1.99–2.00) | (1.99–2.01) | 1 | |
| Mirror_ translation 3x |
0 | Rx | 0.01±0.00 | (0.00–0.01) | (0.00–0.02) | 1 |
| 0 | Ry | 0.01±0.01 | (0.00–0.02) | (−0.02–0.04) | 1 | |
| 0 | Rz | 0.01±0.01 | (0.00–0.01) | (−0.01–0.02) | 1 | |
| 3 | Tx | 2.92±0.34 | (2.77–3.08) | (2.21–3.64) | 0.85 | |
| 0 | Ty | 0.00±0.01 | (0.00–0.01) | (−0.01–0.02) | 1 | |
| 0 | Tz | 0.00±0.00 | (0.00–0.01) | (−0.00–0.01) | 1 | |
| Mirror_ translation 3x_3z |
0 | Rx | 0.01±0.01 | (0.00–0.01) | (−0.01–0.02) | 1 |
| 0 | Ry | 0.01±0.01 | (0.00–0.01) | (−0.01–0.02) | 1 | |
| 0 | Rz | 0.01±0.01 | (0.00–0.01) | (0.00–0.02) | 1 | |
| 3 | Tx | 2.92±0.34 | (2.77–3.08) | (2.21–3.64) | 0.85 | |
| 0 | Ty | 0.00±0.01 | (0.00–0.01) | (−0.01–0.02) | 1 | |
| 3 | Tz | 3.00±0.00 | (2.99–3.00) | (2.99–3.01) | 1 | |
| Mirror_ translation 3z |
0 | Rx | 0.01±0.01 | (0.00–0.01) | (−0.01–0.02) | 1 |
| 0 | Ry | 0.01±0.01 | (0.00–0.02) | (−0.02–0.04) | 1 | |
| 0 | Rz | 0.01±0.01 | (0.00–0.01) | (−0.01–0.02) | 1 | |
| 0 | Tx | 0.08±0.34 | (−0.08–0.24) | (−0.64–0.80) | 0.85 | |
| 0 | Ty | 0.01±0.01 | (0.00–0.01) | (−0.01–0.02) | 1 | |
| 3 | Tz | 3.00±0.00 | (2.99–3.00) | (2.99–3.01) | 1 |
The results showed an acceptable error range in measurements calculated for both mirroring techniques. All the 95% CI and PI tests contained the hypothesized means (known asymmetry values) (Tables 1 and 2).
For clinical application, measurements within the spatial resolution of the image (in this case 0.5 mm) can be considered accurate. The use of mirroring techniques and 3D shape analysis to quantify mandibular asymmetry is illustrated in Figures 8–12.
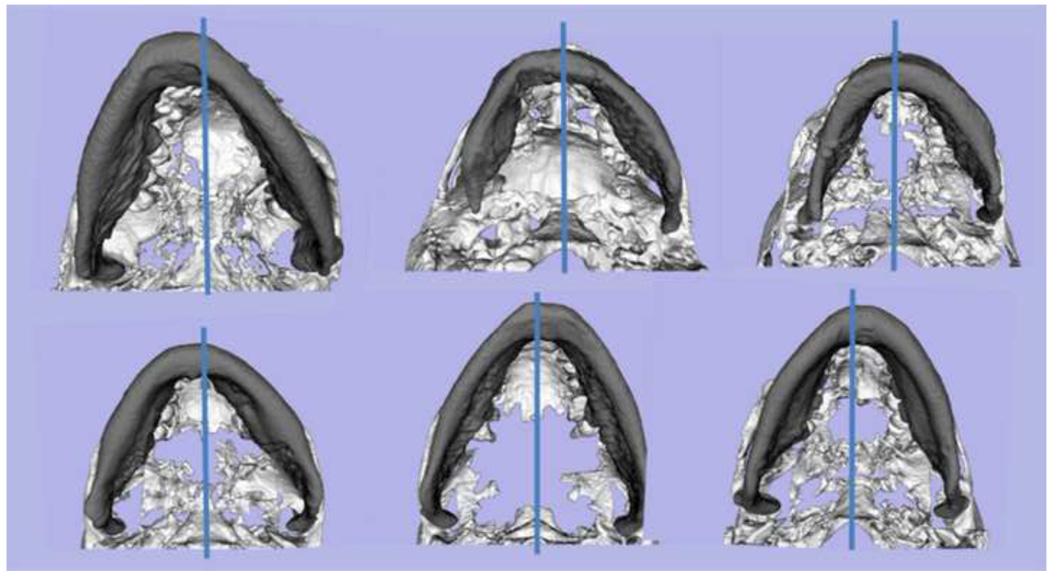
Figure 8. Examples of yaw in mandibular asymmetry.
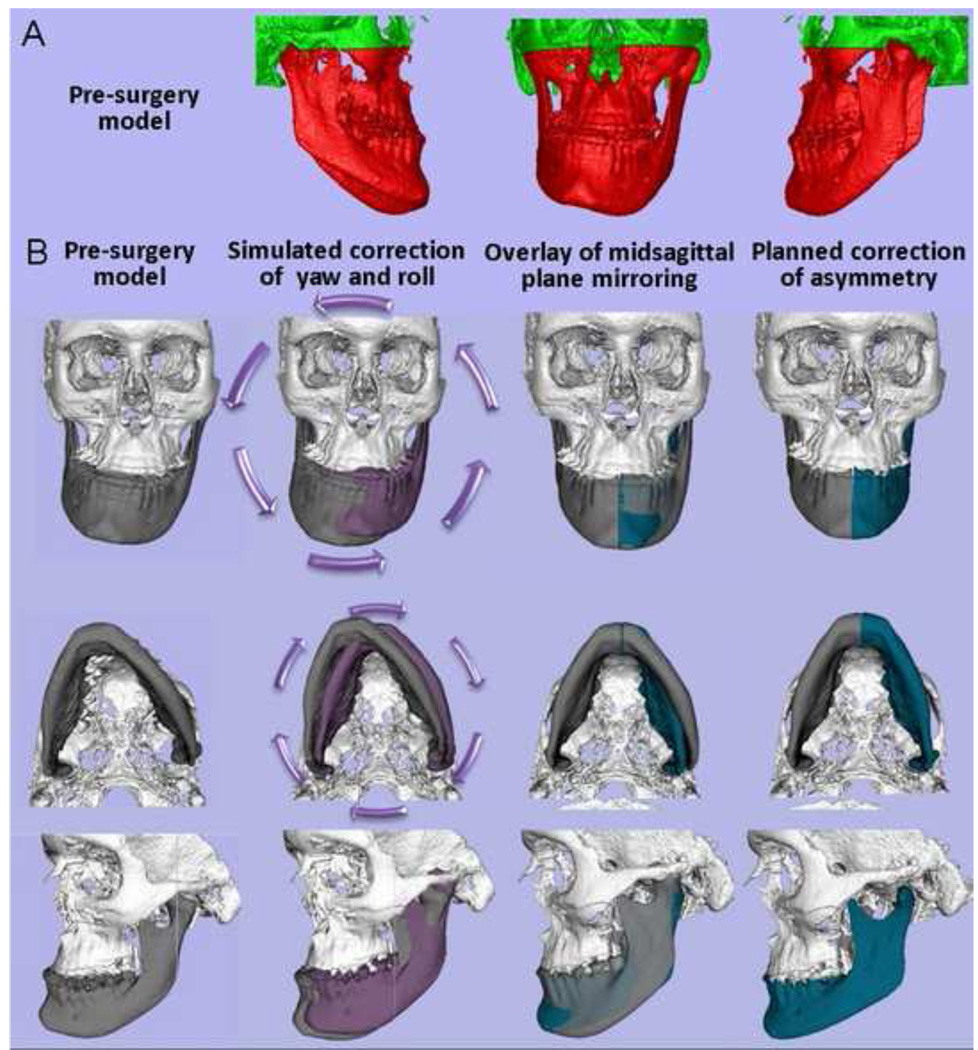
Inferior view of mandibular models for 6 patients with the blue line marking the midsagittal plane location. Note the various degrees and direction of rotational asymmetry in the yaw of the mandible. If the asymmetric yaw of the mandible is not taken into account and virtually corrected prior to the use of mirroring techniques, mirroring techniques will yield misleading diagnosis of asymmetry. Asymmetry in the yaw orientation of the mandible would lead to undesirable results if surgical correction corrects chin position with genioplasty but does not properly correct asymmetry in the mandibular corpus and rami.
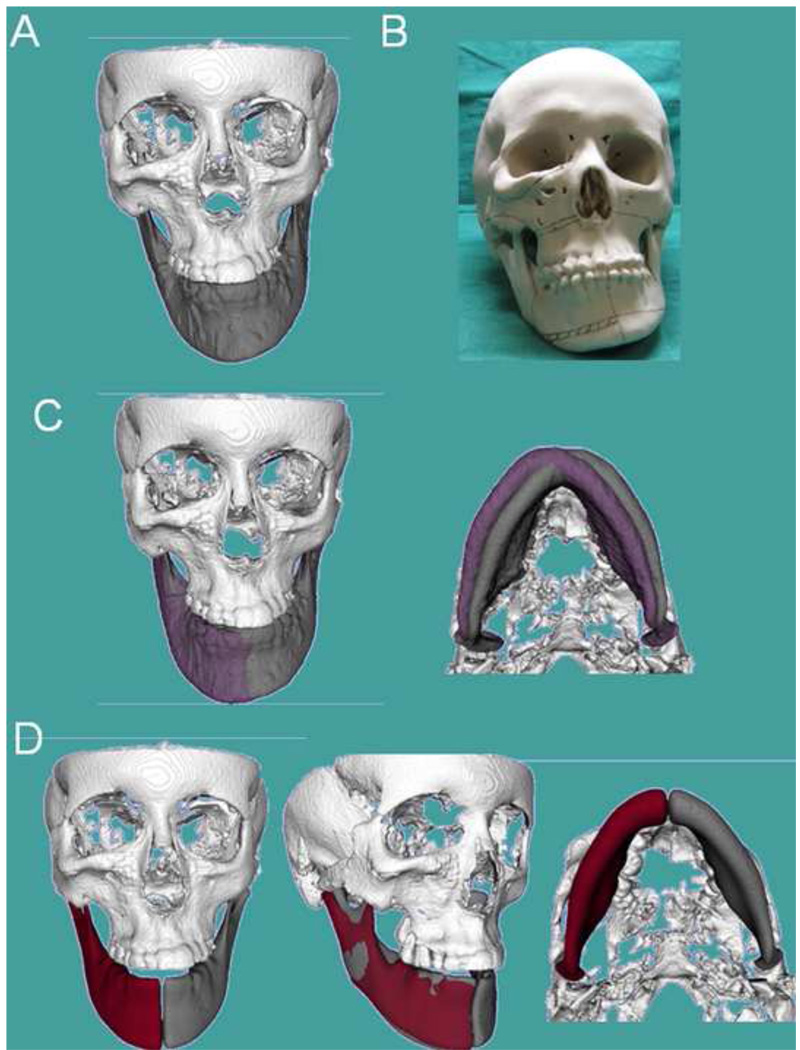
Figure 12. Clinical case 3.
Patient who had been diagnosed with mandibular hypertrophy. However, the CBCT revealed components of maxillary and mandibular asymmetry (A) Frontal frontal view of 3D virtual surface models of the hard tissues of the face; (B) Stereolytographic models were built for treatment planning for this patient. The surgeon’s assessment of the sterolythographic models indicated the need to remove bone in the maxilla and mandibular corpus (marked lines), as the right mandibular corpus appeared to be longer vertically than the left side of the mandibular corpus. (C) However, virtual correction of mandibular yaw and roll (purple models) compared to the patient’s actual model (gray), shows that if the positional 3D cant of the mandible is corrected, the mirror images in (D) reveal that corpus vertical length is very similar in the left and right sides mirrors. The steps in (C) and (D) reveal that the mandible is less asymmetric than indicated by the clinical exam or visualized in the sterolythographic models.
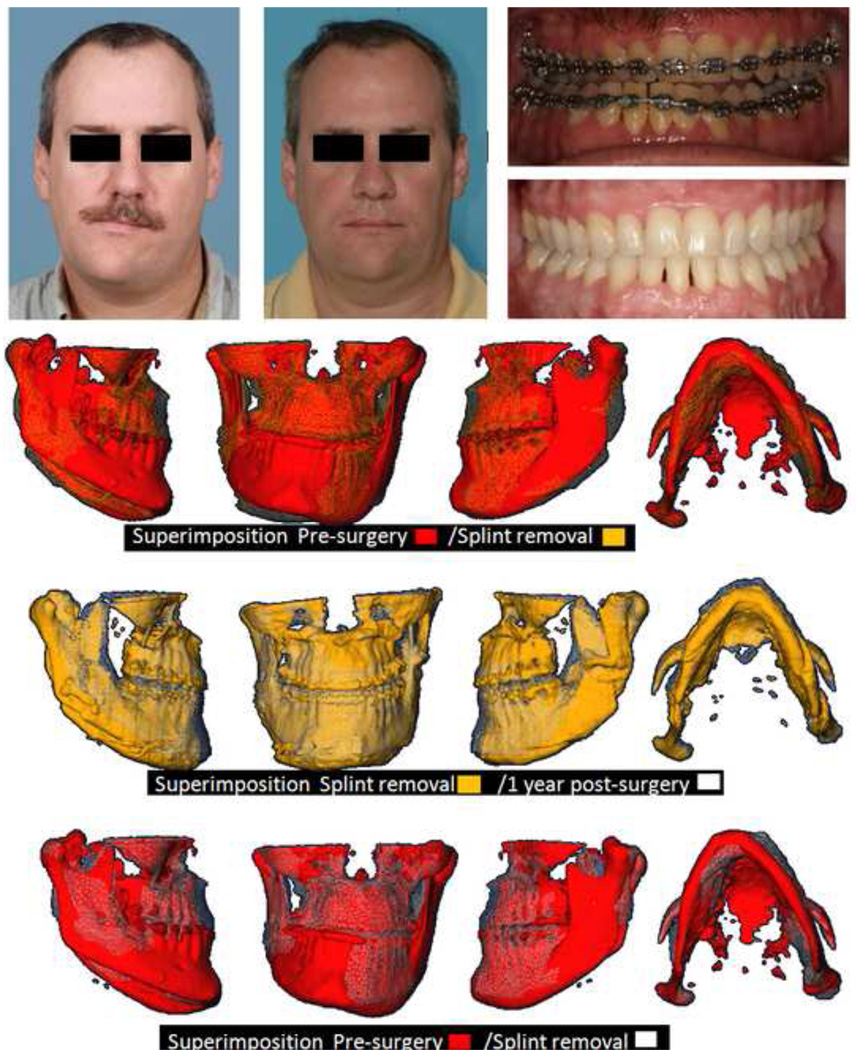
Figure 8 exemplifies the first step for surgeons to reach a "symmetric" result in the patient by correction of positional asymmetric yaw of the mandible in 6 surface models of pre-surgery patients. Figure 9 shows the computation of color maps to quantify mandibular morphological asymmetry of a patient at her surgical workup after virtual correction of the roll and yaw. Figure 10 (presurgery) and 11 (post-surgery follow up) show, respectively, the surgical planning and results for a challenging patient with hemi-mandibular hypertrophy in which the hypertrophic left condyle did not articulate inside the articular fossa in centric occlusion. Figure 12 shows another complex asymmetry case in which the use of stereolythographic models could be misleading to assess right and left mandibular differences, once cuts are made in the stereolythographic model.
Figure 9. Clinical case 1.
Example of diagnosis for a 23 y old female patient. Note that the mirroring techniques and measures of asymmetry were very similar regardless of the mirroring technique used. SPHARM-PDM 3D shape analysis localizes and quantifies areas of right and left differences.
Figure 10. Clinical case 2.
Application of the techniques validated in this study to aid surgical treatment planning. Presurgical 3D diagnosis of a patient with right hemi-mandibular hypertrophy that was not included in the validation study. (A) Patient’s pre-surgery virtual surface models. The mandible and maxilla are labeled in red and cranial base is labeled in green. Note that the patient’s hypertrophic left condyle did not articulate inside the articular fossa in centric occlusion. His left condyle articulated with the zygomatic arch in centric occlusion before projecting to maximum intercuspation. The 3D virtual diagnosis did not move the condyle out of the fossa. The actual surgery as shown in Figure 11 did not change his articulation on left side as he had a working condyle in that abnormal anatomical location. (B) Diagnostic steps where mandibular 3D rotational displacements are virtually corrected prior to the use of mirroring techniques. Such procedures allowed the assessment of true left and right shape differences. The white and gray models display the patient actual facial structures. The purple models are the virtually simulated correction of yaw and roll. In the virtual simulation, the mandible was reoriented with the left condyle as the center of rotation before mirroring to correct asymmetrical mandibular yaw and roll, in an attempt to place the chin in a clinically acceptable location while preserving the facial width. The mandible was rotated 6 degrees counter-clock wise in the frontal plane and 5 degrees clock-wise in the axial plane. After the virtual correction of yaw and roll of the mandible, the real model is the mirror model using the midsagittal plane. Note the overlays between the purple/gray and green/gray models to help plan surgical displacements.
DISCUSSION
In this study, the use of mirroring on the sagittal plane allowed precise and reproducible measurements of asymmetry as shown by the high probabilities and 95% CI and PIs that contain the known asymmetry values. However, the choice of landmarks used to determine the plane might have a marked impact on the asymmetry quantification. Manual selection of landmarks is time-consuming, as it requires great care and attention during the selection process. In addition, the result depends on availability and visibility of the anatomical landmarks and on the ability of the user to identify them. In a particular face, symmetry is often better described by several regional symmetry axes (e.g., symmetry between jaw and mid-face regions often differs), for which no defining landmark set exists.21 In severe asymmetries, as in craniofacial microsomia or cleft patients, entire regions of the anatomy might be missing or severely dislocated. In these cases, selection of landmarks could result in an incorrect quantification of asymmetry.
The measurements of asymmetry simulation calculated for arbitrary mirroring/cranial base registration in this study had slightly lower probabilities compared to mirroring in the midsagittal plane. However, arbitrary mirroring/cranial base registration also had acceptable precision and can be used as an alternative assessment method, particularly for patients with marked mandibular asymmetry, but relatively symmetric cranial base. This is made possible by subsequent voxel-wise rigid registration of the cranial base. We have validated this method in previous studies.9 It has been shown to be more accurate than traditional landmark methods for three-dimensional superimpositions.22,23 The larger the number of points used for superimposition, the more accurate it becomes. If the patient’s cranial base is symmetric, the use of a stable and symmetric facial structure has proven to be a reliable reference for diagnosing the roll and yaw components of mandibular asymmetry.
Interpretation of mandibular asymmetry by subjective visual assessment of right and left differences, even in 3D images, can lead to inadequate diagnosis and mislead treatment planning (Figure 11). Ackerman and Proffit have emphasized that valid and reliable quantification of changes in facial appearance continues to elude researchers.24 They suggested that a 3D natural head position (NHP) determined by soft tissues should be used in the evaluation of roll of the dentition.25 In the past, the inability to appreciate the interplay between maxillomandibular roll and yaw was a missing link in classification and diagnosis. When one sees a major midline shift, a Class II subdivision or Class III molar relationship, or a true unilateral crossbite, quantification of the mandibular roll and yaw is essential prior to the quantification of actual left and right differences25 (Figures 10–12). The extent of asymmetric yaw is a major determinant in whether treatment is limited to asymmetric mechanics or might extend to asymmetric extractions, unilateral bone anchors or surgery.25 For surgeons to reach a "symmetric" result in the patient: first, positional asymmetries in the roll and yaw need to be corrected; second, then the 3D shape asymmetry can be properly assessed and addressed.
Figure 11. Clinical case 2.
Actual outcome of asymmetric 2 jaw surgery of patient in Figure 10. Facial and intra-oral photographs of presurgery and 1 year post-surgery and overlayed virtual models, pre-surgery, splint removal and 1 year post-surgery. Note how the surgical correction addressed the right and left differences as diagnosed in Figure10, with favorable correction of the yaw and roll asymmetries as well as improvement of differences in right and left ramus morphology without the use of grafts in this patient.
In mandibular asymmetry, it is not always clear which side is the asymmetric side. In such cases, the mirroring techniques from each side will allow the surgeon to compare simulated results with mirrors for both sides to choose and plan which side to modify. Surgical navigation systems have been developed to help accurately transfer treatment plans to the operating room.26 Such surgical navigation systems can potentially be used to implement the tools validated in this study using tracking technology to follow anatomic bodies, instruments, or devices in the operative scenario. They provide an augmented view of the current operative situation. This can incorporate preoperatively or intraoperatively acquired images, operative plans, and real-time measurements to guide the surgeon in the realization of the surgical plan.
The assessments in this study were performed as a baseline diagnosis before orthodontic preparation. However, pretreatment diagnosis does not necessarily reflect the presurgical planning that might change depending on the orthodontic mechanics and correction of the dental midlines. The techniques validated in this study are generalizable and can be applied for presurgical assessment as in Figures 8–12.
There has been increased availability in recent years of commercial programs for three-dimensional virtual surgery and visualization programs.2–6,27 Studies using these programs demonstrate that computer aided surgical simulation (CASS) has several potential advantages over conventional treatment planning. These include lower material costs, decreased patient and surgeon time, comparable or better surgical outcomes, and better predictability of possible surgical complications so that the plan can mitigate potential difficulties. CASS has also been utilized to allow complex surgeries to be successfully performed in a single procedure rather than in multiple stages.28–33 The biggest drawback to these programs is the lack of validation of outcomes.
CONCLUSION
Our research, using simulated data and three clinical cases, demonstrates that mandibular asymmetry can be accurately quantified with 6 degrees of freedom. This validation of the virtual diagnosis of asymmetry demonstrates the potential for faster, cheaper and better outcomes through this emerging technology. This rapidly developing technology will have a significant impact on a surgeon’s future work.
ACKNOWLEDGEMENTS
Supported by NIH grants DE-017727, DE-018962 and DE-005215 from NIDCR, and grant UL1RR025747 from NCRR.
Footnotes
Publisher's Disclaimer: This is a PDF file of an unedited manuscript that has been accepted for publication. As a service to our customers we are providing this early version of the manuscript. The manuscript will undergo copyediting, typesetting, and review of the resulting proof before it is published in its final citable form. Please note that during the production process errors may be discovered which could affect the content, and all legal disclaimers that apply to the journal pertain.
REFERENCES
- 1.O’Grady K, Antonyshyn O. Facial asymmetry: three-dimensional analysis using laser surface scanning. Plast Reconstr Surg. 1999;104:928–937. doi: 10.1097/00006534-199909040-00006. [DOI] [PubMed] [Google Scholar]
- 2.De Momi E, Chapuis J, Pappas IP, Ferrigno G, Hallermann W, Schramm A, et al. Automatic extraction of the mid-facial plane for cranio-maxillofacial surgery planning. Int J Oral Maxillofac Surg. 2006;35(7):636–642. doi: 10.1016/j.ijom.2006.01.028. [DOI] [PubMed] [Google Scholar]
- 3.Gellrich N, Schramm A, Hammer B, Rojas S, Cufi D, Lagreze W, et al. Computer assisted secondary reconstruction of unilateral posttraumatic orbital deformity. Plast Reconstr Surg. 2002;110:1417–1429. doi: 10.1097/01.PRS.0000029807.35391.E5. [DOI] [PubMed] [Google Scholar]
- 4.Hassfeld S, Muhling J. Computer assisted oral and maxillofacial surgery a review and an assessment of technology. Int J Oral Maxillofac Surg. 2001;30:2–13. doi: 10.1054/ijom.2000.0024. [DOI] [PubMed] [Google Scholar]
- 5.Junck L, Moen JG, Hutchins GD, Brown MB, Kuhl DE. Correlation methods for the centering, rotation and alignment of functional brain images. J Nuclear Med. 1990;3:1220–1226. [PubMed] [Google Scholar]
- 6.Liu Y, Collins RT, Rothfus WE. Robust midsagittal plane extraction from normal and pathological 3-D neuroradiology images. IEEE Trans Med Imaging. 2001;20:175–192. doi: 10.1109/42.918469. [DOI] [PubMed] [Google Scholar]
- 7.Alhadidi A, Cevidanes LHS, Mol A, Ludlow J, Styner MA. 3D Analysis of based on Midsaggital Plane Computation. J Dent Res. 2009;88(Spec Issue A):311. [Google Scholar]
- 8.Cevidanes LH, Styner MA, Proffit WR. Image analysis and superimposition of 3-dimensional cone-beam computed tomography models. Am J Orthod Dentofac Orthop. 2006;129(5):611–618. doi: 10.1016/j.ajodo.2005.12.008. [DOI] [PMC free article] [PubMed] [Google Scholar]
- 9.Cevidanes LH, Bailey LJ, Tucker GR, Jr, Styner MA, Mol A, Phillips CL, et al. Superimposition of 3D cone-beam CT models of orthognathic surgery patients. Dentomaxillofac Radiol. 2005;34(6):369–375. doi: 10.1259/dmfr/17102411. [DOI] [PMC free article] [PubMed] [Google Scholar]
- 10.Yushkevich PA, Piven J, Hazlett HC, Smith RG, Ho S, Gee JC, et al. User-guided 3D active contour segmentation of anatomical structures: significantly improved efficiency and reliability. Neuroimage. 2006;31(3):1116–1128. doi: 10.1016/j.neuroimage.2006.01.015. [DOI] [PubMed] [Google Scholar]
- 11.ITK-SNAP. [accessed on 11-9-10]; http://www.itksnap.org.
- 12.IMAGINE software. [accessed on 11-9-10]; http://www.ia.unc.edu/dev/download.
- 13.Cevidanes LH, Motta A, Proffit WR, Ackerman JL, Styner M. Cranial base superimpostioin for 3-dimensional evaluation of soft tissue changes. Am J Orthod Dentofac Orthop. 2010;137(4 Suppl):S120–S129. doi: 10.1016/j.ajodo.2009.04.021. [DOI] [PMC free article] [PubMed] [Google Scholar]
- 14.Chapuis J, Schramm A, Pappas I, Hallermann W, Schwenzer-Zimmerer K, Langlotz F, et al. A new system for computer-aided preoperative planning and Intraoperative navigation during corrective jaw surgery. IEEE Trans Inf Technol Biomed. 2007;11(3):274–287. doi: 10.1109/titb.2006.884372. [DOI] [PubMed] [Google Scholar]
- 15.Co-Me network. [accessed on 11-9-10]; http://co-me.ch/
- 16. [accessed on 11-9-10];SPHARM-PDM toolbox. http://www.ia.unc.edu/dev/download.
- 17.Cevidanes LH, Bailey LJ, Tucker SF, Styner MA, Mol A, Phillips CL, et al. Three-dimensional cone-beam computed tomography for assessment of mandibular changes after orthognathic surgery. Am J Orthod Dentofac Orthop. 2007;131(1):44–50. doi: 10.1016/j.ajodo.2005.03.029. [DOI] [PMC free article] [PubMed] [Google Scholar]
- 18.Styner M, Oguz I, Xu S, Brechbuhler C, Pantazis D, Levitt J, et al. Framework for the statistical shape analysis of brain structures using Spharm-PDM. Special edition open science workshop at MICCAI. Insight J. 2006:1–7. [PMC free article] [PubMed] [Google Scholar]
- 19.Styner M, Jomier M, Gerig G. Closed and open source neuroimage analysis tools and libraries at UNC. 3rd IEEE International Symposium on Biomedical Imaging: Nano to Macro; 6–9 April 2006; Arlington, VA. pp. 702–705. [Google Scholar]
- 20.Gerig G, Styner M, Jones D, Weinberger D, Lieberman J. Shape analysis of brain ventricles using Spharm; MMBIA Proceedings; IEEE; 2001. pp. 171–178. [Google Scholar]
- 21.Tung-Yui W, Jing-Jing F, Tung-Chin W. A Novel Method of Quantifying Facial Asymmetry. In: Lemke HU, Inamura K, Doi K, Vannier MW, Farman AG, editors. Computer Assisted Radiology and Surgery. Berlin, Germany: 2005. [Google Scholar]
- 22.Gliddon MJ, Xia JJ, Gateno J, Wong HT, Lasky RE, Teichgraeber JF, et al. The accuracy of cephalometric tracing superimposition. J Oral Maxillofac Surg. 2006;64(2):194–202. doi: 10.1016/j.joms.2005.10.028. [DOI] [PubMed] [Google Scholar]
- 23.Xia JJ. Accuracy of the computer-aided surgical simulation (CASS) system in the treatment of patients with complex craniomaxillofacial deformity: A pilot study. J Oral Maxillofac Surg. 2007;65(2):248–254. doi: 10.1016/j.joms.2006.10.005. [DOI] [PubMed] [Google Scholar]
- 24.Ackerman JL, Proffit WR. A not-so-tender trap. Am J Orthod Dentofac Orthop. 2009;136(5):619–620. doi: 10.1016/j.ajodo.2009.09.003. [DOI] [PubMed] [Google Scholar]
- 25.Ackerman JL, Proffit WR, Sarver DM, Ackerman MB, Kean MR. Pitch, roll, and yaw: describing the spatial orientation of dentofacial traits. Am J Orthod Dentofac Orthop. 2007;131(3):305–310. doi: 10.1016/j.ajodo.2006.05.032. [DOI] [PubMed] [Google Scholar]
- 26.Cevidanes LH, Tucker S, Styner M, Kim H, Chapuis J, Reyes M, Proffit W, Turvey T, Jaskolka M. Three-dimensional simulation. Am J Orthod Dentofac Orthop. 2010;138(5):577–581. doi: 10.1016/j.ajodo.2009.08.026. [DOI] [PMC free article] [PubMed] [Google Scholar]
- 27.Glerup N, Nielsen M, Sporring J, Kreiborg S. Asymmmetry quantization and application to human mandibles. Proceedings SPIE; 2004. pp. 274–282. [Google Scholar]
- 28.Xia J, Samman N, Yeung RW, Shen SG, Wang D, Ip HH, et al. Three-dimensional virtual reality surgical planning and simulation workbench for orthognathic surgery. Int J Adult Orthodon Orthognath Surg. 2000;15(4):265–282. [PubMed] [Google Scholar]
- 29.Gateno J, Teichgraeber JF, Xia JJ. Three-dimensional surgical planning for maxillary and midface distraction osteogenesis. J Craniofac Surg. 2003;14(6):833–839. doi: 10.1097/00001665-200311000-00004. [DOI] [PubMed] [Google Scholar]
- 30.Gateno J, Xia JJ, Teichgraeber JF, Christensen AM, Lemoine JJ, Liebschner MA, et al. Clinical feasibility of computer-aided surgical simulation (CASS) in the treatment of complex craniomaxillofacial deformities. J Oral Maxillofac Surg. 2007;65(4):728–734. doi: 10.1016/j.joms.2006.04.001. [DOI] [PubMed] [Google Scholar]
- 31.Xia J, Ip HH, Samman N, Wang D, Kot CS, Yeung RW, et al. Computer-assisted three-dimensional surgical planning and simulation: 3D virtual osteotomy. Int J Oral Maxillofac Surg. 2000;29(1):11–17. [PubMed] [Google Scholar]
- 32.Troulis MJ, Everett P, Seldin EB, Kikinis R, Kaban LB. Development of a three-dimensional treatment planning system based on computed tomographic data. Int J Oral Maxillofac Surg. 2002;31(4):349–357. doi: 10.1054/ijom.2002.0278. [DOI] [PubMed] [Google Scholar]
- 33.Hassfeld S, Muhling J. Computer assisted oral and maxillofacial surgery--a review and an assessment of technology. Int J Oral Maxillofac Surg. 2001;30(1):2–13. doi: 10.1054/ijom.2000.0024. [DOI] [PubMed] [Google Scholar]


