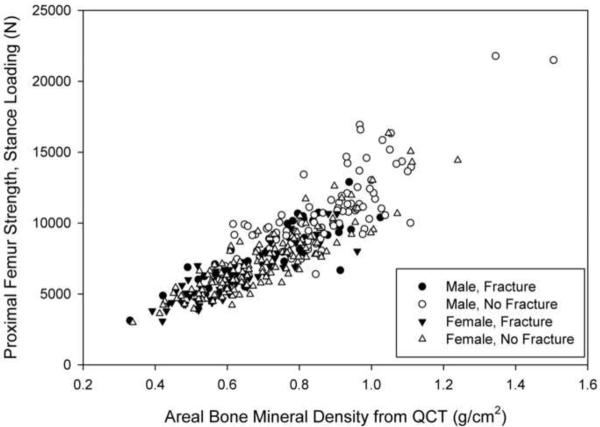
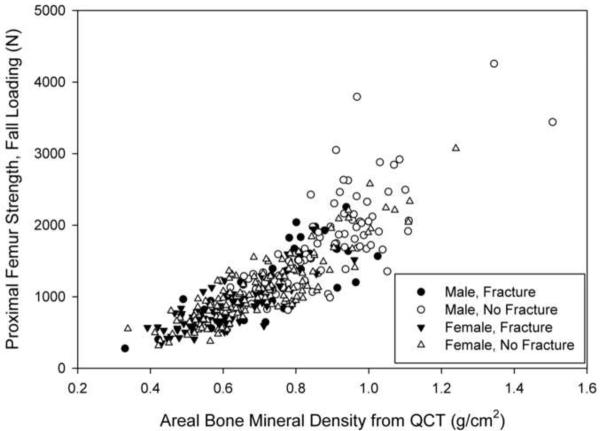
Figure 2.
Finite element-computed hip bone strength for loading during single-limb stance (a) and from a fall onto the posterolateral aspect of the greater trochanter (b) versus areal bone mineral density (aBMD) computed from QCT for male (filled symbols) and female (open symbols) fracture (circles) and control (squares) subjects. These data have not been adjusted for covariates, so this graph does not reflect the results of the regression analysis. Omitting the two points with greatest aBMD and strength in (a) did not significantly change the regression results.


