

Abstract
Background
The purpose of our study was to compare ankle range of motion and stiffness in individuals with and without diabetes mellitus using a reliable and valid technique and to document the effect of knee flexion and severity of pathology on ankle range of motion and stiffness.
Methods
Twenty-five individuals with diabetes mellitus and 64 nondiabetic individuals, similar in age and gender profile, participated in this study.
Results
Results revealed that individuals with diabetes mellitus had both significantly lower peak dorsiflexion range of motion (5.1 and 11.5 degrees, p < 0.001) and higher passive ankle stiffness (0.016 and 0.008 Nm/kg/degree, p < 0.01) than non-diabetic individuals. In individuals with diabetes mellitus, a positive relationship between glycemic control and duration of diabetes mellitus and ankle stiffness ((r2 = 0.48 and 0.24 respectively, p < 0.01 for both) was found.
Conclusion
While decreased range of motion and increased stiffness in the diabetes mellitus population seem clinically intuitive, as far as we know this is the first study to confirm the concurrent existence of both these findings in the plantarflexors in individuals with diabetes mellitus. We applied a reliable and valid technique, one that allowed control of confounding factors such as knee flexion position and differences in determination of end range of motion, and documented a mean 41% loss in dorsiflexion excursion. Changes in the muscle, stemming from underlying pathology, are hypothesized to account for a significant part of the lost range of motion. Changes in ankle range of motion and stiffness may have important implications in plantar loading and ulcer formation.
Keywords: Ankle Stiffness, Diabetes, Dorsiflexion, Range of Motion
Introduction
Just over 6% (18.2 million) of people in the United States are affected by diabetes mellitus.15 The disease impacts many organ systems and often has dire consequences associated with substantial morbidity and mortality.17 Involvement of the lower extremity typically starts in the plantar sole of the foot where ulcers develop in an estimated 15% of patients.5 The inability to effectively treat foot ulcers contributes substantially to the high rate of amputations seen in this population.19
Foot ulcers have been hypothesized to result from repetitive mechanical stress imposed on insensitive and often morphologically changed feet. Repetitive, abnormally high loading may overwhelm the ability of the soft tissue to respond and may culminate in ulceration.2,20 Understanding factors contributing to excessive loads on the plantar aspect of the foot is therefore of considerable interest.
Loss of dorsiflexion range of motion at the ankle and increased stiffness in the triceps surae musculature have been implicated as potential factors contributing to increased loading of the forefoot.3 According to this theory, changes in muscle characteristics limit forward progression of the tibia over the fixed foot during the stance phase of gait, resulting in early heel rise and increased loading on the metatarsal heads.26 Attempts to document changes in soft tissue associated with diabetes mellitus have had mixed results. Limitations in dorsiflexion range of motion23 and increased ankle stiffness25 have been reported in individuals with diabetes mellitus. However, technical differences in the methods used to quantify stiffness, differences in criteria for determining passive end range of motion, and natural variations in the extent of pathology in individuals with diabetes mellitus may account for differences in the reported results.23–25
An additional confounding factor that likely influences ankle range of motion and stiffness is knee position at the time of measurement. Salsich et al.23 measured ankle characteristics with the knee in 10 degrees of flexion while Trevino et al.25 held the knee in 20 to 25 degrees of flexion. With the knee fully extended, the biarticular gastrocnemius contributes maximally to end range control of passive dorsiflexion. However, as the knee flexes, the contribution of the gastrocnemius muscle is reduced and the passive contribution of the soleus muscle increases.22 Varying degrees of knee flexion produces varying combinations of gastrocnemius and soleus contributions to ankle stiffness.
The purpose of our study was to compare ankle range of motion and stiffness, in individuals with and without diabetes mellitus, and to document the effect of knee flexion and the severity of the pathology on ankle range of motion and stiffness. Examining ankle motion in light of some of the factors that may confound the interpretation of muscle function will enable us to obtain a clearer impression of mechanical changes that are associated with diabetes mellitus.
Materials and Methods
Subjects
In accordance with Institutional Review Board and HIPAA guidelines, Informed Consent was sought and study procedures were instituted. Twenty-five individuals with diabetes mellitus and 64 nondiabetic individuals with similar age and gender profiles participated in this study (Table 1). Inclusion criteria for the diabetes mellitus group were a diagnosis of diabetes mellitus, no current or previous ipsilateral foot ulcer, no great toe or transmetatarsal amputation, and absence of ipsilateral or contralateral Charcot neuroarthropathy. Inclusion criteria for the control group were no diagnosis of diabetes, no lower extremity pain, and no musculoskeletal pathology or history thereof in the last 6 months. Subject characteristics are summarized in Table 1.
Table 1. Demographic data from study and control groups.
| DM | Control | |
|---|---|---|
| Mean ± SD | Mean ± SD | |
| N | 25 | 64 |
| Age | 54 ± 11 | 53 ± 9 |
| Gender F:M | 10:15 | 26:38 |
| Height (m) | 1.71 ± 0.09 | 1.71 ± 0.11 |
| Mass (kg) | 96.4 ± 26.0 | 86.6 ± 15.2 |
| HbA1C | 8.2 ± 1.8 | |
| Type 2 | 20 (80%) | |
| Duration (yrs) | 13 ± 11 | |
The groups did not differ in age (p = 0.93), body mass (p = 0.09), or height (p = 0.69).
Ankle Range of Motion and Stiffness Testing
Passive ankle range of motion was measured at specific torque levels with the Iowa Ankle Range of Motion Device (IAROM).27 This device has been shown to be valid and reliable. Detailed description of the device and methods are provided in Wilken et al.27 Briefly, subjects were positioned supine with the knee extended; the leg was supported by a base plate and a foam block and secured by Velcro straps. The sole of their foot was positioned so contact was maintained to a translucent plexiglass footplate throughout testing. The axis of rotation of the device was then adjusted in the anteroposterior and superoinferior directions to approximate the ankle axis of rotation determined by palpation of the distal tips of the medial and lateral malleoli.7
Torques of 15, 20 and 25 Nm were applied using a hand-held force gauge (FDK 40, Wagner Instruments, Greenwich, CT) and resultant angular kinematics were measured using a digital inclinometer (Checkpoint Inc., Torrance, CA) (Figure 1). The inclinometer was referenced to the tibial crest and then mounted on the footplate that was parallel to the sole of the foot. Three cycles of testing were performed in ascending order of force application and resultant peak dorsiflexion range of motion was recorded at each force level. Next, the knee was flexed to approximately 20 degrees by raising the leg plate by about 3 inches. This inclined position of the leg plate was maintained and range of motion testing was repeated at the three force levels. Knee flexion to about 20 degrees was selected since it represents the magnitude of knee flexion used during walking.28 Ankle stiffness was calculated as the slope of the resultant curves over the 15 to 25 Nm intervals.
Fig. 1.
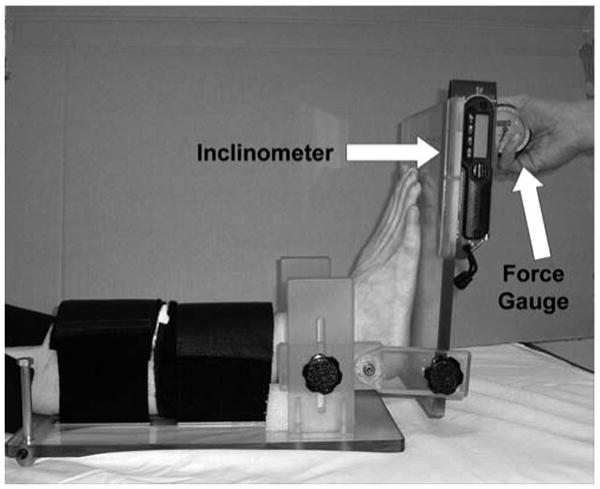
Apparatus and setup for ankle range of motion testing.
Statistical Testing
A two sample t test was used to assess differences between the two groups (α = 0.05). Pearson product moment correlation was used to assess the relationship between variables of interest. Statistical significance (Ho : ρ = 0) and equality of correlations (Ho : ρ1 = ρ2) were assessed using approximate tests based on Fisher's Z transformation (α = 0.05).
Results
The individuals with diabetes mellitus had attained considerably lower peak dorsiflexion range of motion and higher passive ankle stiffness than nondiabetic controls. These results were seen at all three force levels and with the knee flexed as well as extended (p < 0.001) (Table 2).
Table 2. Between group comparison of peak dorsiflexion and passive ankle stiffness.
| DM | CTRL | p values | ||||
|---|---|---|---|---|---|---|
| Mean | SD | Mean | SD | |||
| Knee extended | ||||||
| Peak dorsiflexion | 15 Nm | 5.1 | 8.2 | 11.5 | 5.4 | <0.001 |
| 20 Nm | 9.8 | 8.1 | 17.5 | 6.2 | <0.001 | |
| 25 Nm | 13 | 8.3 | 20.8 | 5.7 | <0.001 | |
| Ankle stiffness | 1.505 | 0.388 | 1.012 | 0.138 | <0.001 | |
| Knee flexed | ||||||
| Peak dorsiflexion | 15 Nm | 11.6 | 8.1 | 18.3 | 6.3 | <0.001 |
| 20 Nm | 16.5 | 8.0 | 24 | 6.1 | <0.001 | |
| 25 Nm | 20 | 8.0 | 27.5 | 5.9 | <0.001 | |
| Ankle stiffness | 1.282 | 0.442 | 0.990 | 0.126 | <0.001 | |
Units: Peak dorsiflexion: degrees, Ankle stiffness: Nm/degree.
Within group analyses showed that women without diabetes mellitus had greater peak dorsiflexion than men without diabetes mellitus, and individuals with diabetes mellitus showed similar trends (p = 0.009 with knee extended) and (p = 0.001 with knee flexed). Ankle stiffness did not differ between genders in either group (p = 0.7) (Table 3).
Table 3. Within-group analysis of peak dorsiflexion and passive ankle stiffness in subjects with and without diabetes mellitus.
| Group | DM Female | DM Male | P value | CTRL Female | CTRL Male | P value | |
|---|---|---|---|---|---|---|---|
| Knee extended | |||||||
| Peak dorsiflexion | 15 Nm | 8.2 ± 9.0 | 2.1 ± 7.0 | 0.059 | 13.4 ± 4.6 | 10.2 ± 5.6 | <0.001 |
| 20 Nm | 12.8 ± 8.6 | 6.6 ± 7.3 | 0.064 | 18.7 ± 4.4 | 16.6 ± 7.1 | 0.009 | |
| 25 Nm | 16.0 ± 9.1 | 9.6 ± 7.2 | 0.07 | 22.8 ± 4.6 | 19.1 ± 6.1 | 0.004 | |
| Ankle stiffness | 1.599 ± 0.221 | 1.433 ± 0.516 | 0.319 | 1.011 ± 0.150 | 1.016 ± 0.132 | 0.909 | |
| Knee flexed | |||||||
| Peak dorsiflexion | 15 Nm | 15.4 ± 8.8 | 6.0 ± 6.6 | 0.026 | 20.7 ± 5.4 | 16.7 ± 6.4 | 0.001 |
| 20 Nm | 19.5 ± 9.1 | 11.3 ± 6.7 | 0.068 | 26.3 ± 5.6 | 22.5 ± 6.1 | 0.001 | |
| 25 Nm | 22.1 ± 9.0 | 14.6 ± 7.1 | 0.143 | 29.6 ± 5.5 | 26.2 ± 5.8 | 0.02 | |
| Ankle stiffness | 1.366 ± 0.331 | 1.216 ± 0.516 | 0.433 | 0.915 ± 0.110 | 0.900 ± 0.134 | 0.704 |
Units: Peak dorsiflexion: degrees, Ankle stiffness: Nm/degree.
Knee flexion in both groups was accompanied by a significant increase in peak dorsiflexion range of motion at all three force levels but not in stiffness (for individuals with diabetes mellitus: at 15, 20 and 25 Nm, p < 0.004, p < 0.003, p < 0.002, stiffness: p = 0.35. For non-diabetic individuals, at 15, 20 and 25 Nm, p < 0.001, p < 0.001, p < 0.001, stiffness: p = 0.642).
Ankle stiffness with the knee extended was significantly associated with ankle stiffness with the knee flexed in individuals with diabetes mellitus, as well as in nondiabetic individuals (r2 = 0.57 and 0.52 in those with and without diabetes, respectively, p < 0.01) (Figure 2). Considering that our subjects were not matched in physical or anthropometric variables, we thought it was noteworthy that approximately 50% of the variance in ankle stiffness in the knee extended position is accounted for by ankle stiffness in the knee flexed position. The number also points to the large amount of unexplained variance (close to 50%) that comes from variation in the contribution of the gastrocnemius relative to the soleus.
Fig. 2.
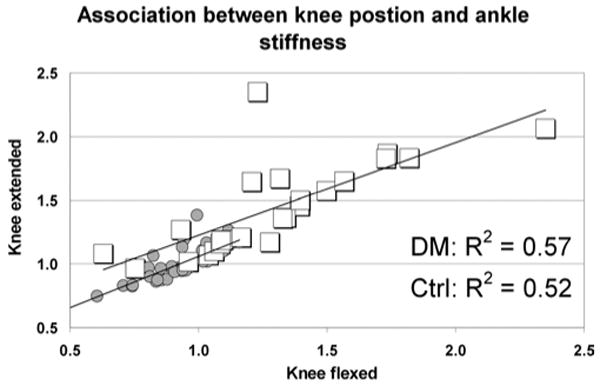
The association between passive ankle stiffness with the knee flexed and extended in subjects with diabetes mellitus (squares) and non-diabetic controls (circles).
Ankle stiffness in those with diabetes mellitus was not associated with body mass (r2 = 0.21 and 0.15 with knee extended and flexed, p = 0.45 and 0.38, respectively), age (r2 = 0.25 and 0.22 with knee extended and flexed, p = 0.52 and 0.48, respectively), or height (r2 = 0.13 and 0.23 with knee extended and flexed, p = 0.87 and 0.73, respectively). Similarly, in the nondiabetic controls, ankle stiffness was not associated with body mass (r2 = 0.06 and 0.01 with knee extended and flexed, p = 0.89 and 0.77, respectively), age (r2 = 0.01 and 0.00 with knee extended and flexed, p = 0.95 and 0.97, respectively) or height (r2 = 0.16 and 0.21 with knee extended and flexed, p = 0.65 and 0.78, respectively).
In the group with diabetes mellitus, HbA1c levels and duration of the diabetes showed fair association with ankle stiffness in the knee extended position (r2 = 0.48 and 0.24, respectively, p < 0.01 for both).
Discussion
The key findings of our study demonstrate that individuals with diabetes mellitus have both significantly lower peak dorsiflexion range of motion and higher passive ankle stiffness than non-diabetic individuals. While it might be speculated that there would be an association between decreased range of motion and increased stiffness in the diabetes mellitus population, as far as we know this study is the first to confirm this association. In those with diabetes mellitus, we also found a positive association between the extent of the pathology and the magnitude of changes in the mechanical characteristics of the plantarflexors. In both study groups, knee flexion was accompanied by an increase in peak dorsiflexion range of motion but not in ankle stiffness, highlighting the importance of controlling knee flexion when testing ankle range of motion.
Our results, demonstrating significant limitations in dorsiflexion range of motion in individuals with diabetes mellitus, are comparable with previous investigations.12,23,24 In addition, by using measures with established validity and inter-rater reliability, we believe we were better able to establish the strength of this relationship and minimize any potential risk caused by experimental bias.14 Salsich et al.23 documented peak dorsiflexion of 10 ± 5 and 17 ± 4 degrees in patients with and without diabetes mellitus, respectively. The limitations in range of motion distinguish the diabetes patient population as having many more individuals who are classified as hypomobile. Using a conventional clinical criterion of limitation of ankle range of motion to 10 degrees of dorsiflexion or less,21 12.5% of the control group and 56% of the diabetes mellitus group would be classified as hypomobile. Alternatively, using norm-referenced values of dorsiflexion,12 (collected at 12 Nm compared to our values collected at 15 Nm) indicates that our control group would be classified as follows: hypomobile (4 of 64, 6.25%), inflexible, 19 of 64, 30%), normal (39 of 64, 60.75%) and flexible (2 of 64, 3.0%) categories, while our patients with diabetes mellitus would be classified as: hypomobile (10 of 25, 40%), inflexible (11 of 25, 44%), normal (3 of 25, 12%), and flexible (1 of 25, 4%). This hypomoblity has potential functional consequences in gait where 10 degrees of dorsiflexion normally is required for normal gait.8
Given the mean 41% loss in dorsiflexion excursion documented in this study, it seems likely that changes in the muscle account for part, if not most, of the lost range of motion. Deficit in range of ankle motion has been explained as a consequence of shortened plantarflexors, with the gastrocnemius having a dominant role as the knee approaches full extension.23 Within the gastrocnemius muscle-tendon unit, sites of limited excursion could be either in the tendon or in the muscle belly. Estimating a muscle-tendon excursion of 2.3 cm through 25 degrees of angular ankle movement10,11 tendon elongation would contribute less than 30% of the total length change.14 Muscle changes are more likely the predominant cause of dorsiflexion limitation in diabetes mellitus. Individuals with diabetes mellitus may lose contractile protein from the protein catabolic effect of ineffective insulin action and diabetic neuropathy with subsequent muscle atrophy.16 Evidence for loss of sarcomeres in parallel comes from documented reduction of peak torque generating capacity of the plantarflexors in individuals with diabetes mellitus and a concomitant positive association between plantarflexor strength and stiffness.13 Reduction in the number of sarcomeres in parallel would tend to reduce passive stiffness but may be accompanied by a change in the ratio of connective to contractile tissue. The increase in the proportion of connective tissue is a quantitative change, which, accompanied by qualitative changes such as increased collagen cross-linking, may contribute to increased passive stiffness documented in our results. Individuals with diabetes mellitus often use less ankle motion during functional activities13 suggesting that their plantarflexors may function in a smaller range compared to nondiabetic individuals and that this may lead to associated muscle accommodations such as fiber shortening.
Our findings of increased stiffness at the ankle in those with diabetes mellitus are consistent with the findings of other studies that have measured foot and ankle stiffness in this patient population.1,4,25 The increased stiffness in our diabetes mellitus group as compared with Trevino et al.25 (0.016 versus 0.0118 Nm/kg.degree, units express ankle stiffness normalized to body mass to allow for comparison between studies) may reflect intrinsic differences in our study groups, where Trevino et al.25 were more exclusive, screening their subjects for vascular and neurological dysfunction, or may be due to differences in methodology.
Higher passive ankle stiffness in individuals with diabetes mellitus indicates that the plantarflexors are more resistant to elongation. Resistance to passive elongation is attributed to changes in the properties of the contractile and elastic elements of the plantarflexors. Increased fibril density has been documented in the series elastic element (Achilles tendon) and has been hypothesized to lead to increased tendon stiffness.6 A stiffer tendon will result in a greater proportion of the applied torque being taken up by the contractile and parallel elastic elements. Abnormal collagen cross-linking secondary to nonenzymatic glycosylation has been shown in individuals with diabetes mellitus18 and may manifest as increased stiffness.
Ankle stiffness appears influenced by diabetic control. We found that glycemic control and duration of diabetes accounted for 48% and 24% of the variance in ankle stiffness, respectively. These findings are consistent with the work of Lavery et al.9 who showed that the presence of equinus was positively associated with duration of diabetes.
Our results revealed that ankle stiffness with the knee extended explained 60% of the variance in ankle stiffness with the knee flexed. The gastrocnemius, therefore, emerges as the predominant factor influencing the mechanical behavior of the plantarflexors in the 0 to 20 degree range of knee flexion. Further studies examining the association between ankle stiffness with the knee extended and in varying degrees of knee flexion are needed, as well as studies to examine the relationship between passive range of motion and stiffness and the contribution of these variables to the formation of the plantar ulcers in patients with diabetes mellitus.
References
- 1.Birke JA, Franks BD, Foto JG. First ray joint limitation, pressure, and ulceration of the first metatarsal head in diabetes mellitus. Foot Ankle Int. 1995;16:277–284. doi: 10.1177/107110079501600506. [DOI] [PubMed] [Google Scholar]
- 2.Brand P. Insensitive Feet: A Practical Handbook on Foot Problems in Leprosy. Leprosy Mission; London: 1981. [Google Scholar]
- 3.Fernando D, Masson E, Veves A, Boulton A. Relationship of limited joint mobility to foot pressures and diabetic foot ulceration. Diabetes Care. 1991;14:8–11. doi: 10.2337/diacare.14.1.8. [DOI] [PubMed] [Google Scholar]
- 4.Glasoe WM, Allen MK, Ludewig PM, Saltzman CL. Dorsal mobility and first ray stiffness in patients with diabetes mellitus. Foot Ankle Int. 2004;25:550–555. doi: 10.1177/107110070402500807. [DOI] [PubMed] [Google Scholar]
- 5.Gordois A, Scuffham P, Shearer A, Oglesby A, Tobian JA. The health care costs of diabetic peripheral neuropathy in the US. Diabetes Care. 2003;26:1790–1795. doi: 10.2337/diacare.26.6.1790. [DOI] [PubMed] [Google Scholar]
- 6.Grant WP, Sullivan R, Sonenshine DE, et al. Electron microscopic investigation of the effects of diabetes mellitus on the Achilles tendon. J Foot Ankle Surg. 1997;36:272–278. doi: 10.1016/s1067-2516(97)80072-5. discussion 330. [DOI] [PubMed] [Google Scholar]
- 7.Hicks JH. The mechanics of the foot. I. The joints. J Anat. 1953;87:345–357. [PMC free article] [PubMed] [Google Scholar]
- 8.Inman V, Ralston H, Todd F. Human Walking. Williams and Wilkins; Baltimore: 1981. [Google Scholar]
- 9.Lavery LA, Armstrong DG, Boulton AJ Diabetex Research, G. Ankle equinus deformity and its relationship to high plantar pressure in a large population with diabetes mellitus. J Am Pod Med Assoc. 2002;92:479–482. doi: 10.7547/87507315-92-9-479. [DOI] [PubMed] [Google Scholar]
- 10.Maganaris CN. Imaging-based estimates of moment arm length in intact human muscle-tendons. Eur J Appl Physiol. 2004;91:130–139. doi: 10.1007/s00421-003-1033-x. [DOI] [PubMed] [Google Scholar]
- 11.Maganaris CN, Baltzopoulos V, Sargeant AJ. In vivo measurement-based estimations of the human Achilles tendon moment arm. Eur J Appl Physiol. 2000;83:363–369. doi: 10.1007/s004210000247. [DOI] [PubMed] [Google Scholar]
- 12.Moseley AM, Crosbie J, Adams R. Normative data for passive ankle plantarflexion – dorsiflexion flexibility. Clin Biomech (Bristol, Avon) 2001;16:514–521. doi: 10.1016/s0268-0033(01)00030-4. [DOI] [PubMed] [Google Scholar]
- 13.Mueller MJ, Minor SD, Sahrmann SA, Schaaf JA, Strube MJ. Differences in the gait characteristics of patients with diabetes and peripheral neuropathy compared with age-matched controls. Phys Ther. 1994;74:299–308. doi: 10.1093/ptj/74.4.299. discussion 309 – 13. [DOI] [PubMed] [Google Scholar]
- 14.Muraoka T, Muramatsu T, Takeshita D, Kawakami Y, Fukunaga T. Length change of human gastrocnemius aponeurosis and tendon during passive joint motion. Cells Tissues Organs. 2002;171:260–268. doi: 10.1159/000063128. [DOI] [PubMed] [Google Scholar]
- 15.National Institute of Diabetes and Digestive and Kidney Diseases. National Diabetes Statistics fact sheet: general information and national estimates on diabetes in the United States, 2003. Bethesda, MD: U.S. Department of Health and Human Services, National Institutes of Health; 2003. Rev. ed. U.S. Department of Health and Human Services, National Institutes of Health, 2004. Edited, Bethesda, MD, 2004. [Google Scholar]
- 16.Powers A. Diabetes Mellitus. In: Isselbacher K, editor. Harrison's Principles of Internal Medicine. McGraw-Hill; 2004. [Google Scholar]
- 17.Price P. The diabetic foot: quality of life. Clin Infect Dis. 2004;39:S129–131. doi: 10.1086/383274. [DOI] [PubMed] [Google Scholar]
- 18.Reddy KG. Glucose-mediated in vitro glycation modulates biomechanical integrity of the soft tissues but not hard tissues. J Orthop Res. 2003;21:738–743. doi: 10.1016/S0736-0266(03)00006-8. [DOI] [PubMed] [Google Scholar]
- 19.Reiber GE, Lipsky BA, Gibbons GW. The burden of diabetic foot ulcers. Am J Surg. 1998;176:5S–10S. doi: 10.1016/s0002-9610(98)00181-0. [DOI] [PubMed] [Google Scholar]
- 20.Reiber GE, Vileikyte L, Boyko EJ, et al. Causal pathways for incident lower-extremity ulcers in patients with diabetes from two settings. Diabetes Care. 1999;22:157–162. doi: 10.2337/diacare.22.1.157. [DOI] [PubMed] [Google Scholar]
- 21.Riddle D. Foot and ankle. In: Iglarsh Z, editor. Orthopedic Physical Therapy. WB Saunders Company; Philadelphia: 1994. pp. 483–562. [Google Scholar]
- 22.Sale D, Quinlan J, Marsh E, McComas AJ, Belanger AY. Influence of joint position on ankle plantarflexion in humans. J Appl Physiol. 1982;52:1636–1642. doi: 10.1152/jappl.1982.52.6.1636. [DOI] [PubMed] [Google Scholar]
- 23.Salsich GB, Mueller MJ, Sahrmann SA. Passive ankle stiffness in subjects with diabetes and peripheral neuropathy versus an age-matched comparison group. Physical Therapy. 2000;80:352–362. doi: 10.1093/ptj/80.4.352. [DOI] [PubMed] [Google Scholar]
- 24.Sauseng S, Kastenbauer T, Sokol G, Irsigler K. Estimation of risk for plantar foot ulceration in diabetic patients with neuropathy. Diabetes Nutr Metab. 1999;12:189–193. [PubMed] [Google Scholar]
- 25.Trevino SG, Buford WL, Jr, Nakamura T, John Wright A, Patterson RM. Use of a torque-range-of-motion device for objective differentiation of diabetic from normal feet in adults. Foot Ankle Int. 2004;25:561–567. doi: 10.1177/107110070402500809. [DOI] [PubMed] [Google Scholar]
- 26.Van Gils CC, Roeder B. The effect of ankle equinus upon the diabetic foot. Clin Pod Med Surg. 2002;19:391–409. doi: 10.1016/s0891-8422(02)00010-1. [DOI] [PubMed] [Google Scholar]
- 27.Wilken J, Saltzman C, Yack H. Reliability and validity of Iowa ankle range-of-motion device. J Orthop Sports Phys Ther. 2004;34:A17–A18. doi: 10.2519/jospt.2011.3397. [DOI] [PubMed] [Google Scholar]
- 28.Winter D. Kinematic and kinetic patterns in human gait: variability and compensating effects. Human Movement Science. 1984;3:51–76. [Google Scholar]