Abstract
Protein S-glutathionylation (PSSG), a reversible posttranslational modification of reactive cysteines, recently emerged as a regulatory mechanism that affects diverse cell-signaling cascades. The extent of cellular PSSG is controlled by the oxidoreductase glutaredoxin-1 (Grx1), a cytosolic enzyme that specifically de-glutathionylates proteins. Here, we sought to evaluate the impact of the genetic ablation of Grx1 on PSSG and on LPS-induced lung inflammation. In response to LPS, Grx1 activity increased in lung tissue and bronchoalveolar lavage (BAL) fluid in WT (WT) mice compared with PBS control mice. Glrx1−/− mice consistently showed slight but statistically insignificant decreases in total numbers of inflammatory cells recovered by BAL. However, LPS-induced concentrations of IL-1β, TNF-α, IL-6, and Granulocyte/Monocyte Colony–Stimulating Factor (GM-CSF) in BAL were significantly decreased in Glrx1−/− mice compared with WT mice. An in situ assessment of PSSG reactivity and a biochemical evaluation of PSSG content demonstrated increases in the lung tissue of Glrx1−/− animals in response to LPS, compared with WT mice or PBS control mice. We also demonstrated that PSSG reactivity was prominent in alveolar macrophages (AMs). Comparative BAL analyses from WT and Glrx1−/− mice revealed fewer and smaller AMs in Glrx1−/− mice, which showed a significantly decreased expression of NF-κB family members, impaired nuclear translocation of RelA, and lower levels of NF-κB–dependent cytokines after exposure to LPS, compared with WT cells. Taken together, these results indicate that Grx1 regulates the production of inflammatory mediators through control of S-glutathionylation–sensitive signaling pathways such as NF-κB, and that Grx1 expression is critical to the activation of AMs.
Keywords: lipopolysaccharide, glutaredoxin-1, protein S-glutathionylation, nuclear factor-κB
CLINICAL RELEVANCE.
This work highlights the relationship between protein S-glutathionylation and LPS-induced lung inflammation through the low molecular weight thiol transferase enzyme glutaredoxin-1.
Pulmonary inflammation is associated with significant increases in redox-active molecules, including hydrogen peroxide and nitric oxide. The sources of these oxidants include resident macrophages, infiltrating neutrophils and eosinophils, and airway epithelial cells, through the induction of enzymes such as the nonphagocytic nicotinamide adenine dinucleotide reduced (NADPH) oxidases and inducible nitric oxide synthase (1–3). Because oxidative events can influence both the structure and function of cellular macromolecules such as proteins and DNA, the lung has developed a diverse repertoire of antioxidant molecules and enzymes. Included among these is the low molecular weight tripeptide glutathione (GSH), which is present within lung-lining fluid at micromolar concentrations (4). In addition to its ability to quench oxidants directly, glutathione has the capacity to conjugate to oxidized cysteine residues within proteins, a process known as protein S-glutathionylation (PSSG). PSSG has the potential to alter the structure and function of proteins significantly, and this posttranslational modification was shown to occur in a targeted manner, and to be tightly regulated (5, 6). The specificity of PSSG formation is dictated by the regional chemistry of a sulfhydryl group within a protein's overall structure. Low pKa cysteines in the thiolate state are significantly more reactive to PSSG formation (7). The regulation of PSSG content falls primarily to the glutaredoxin (Grx) family of oxidoreductases, of which there are three members. Grx1 is described as ubiquitously present within the cell, whereas Grx2 and Grx5 were shown to be localized to mitochondria (8). Under physiologic conditions, Grx acts specifically to remove conjugated glutathione from proteins, a process known as de-glutathionylation. Given the specificity and regulation of PSSG content, this posttranslational modification has the ability to regulate cell-signaling cascades. Recent studies from our laboratory and others demonstrated that the NF-κB pathway is inhibited by PSSG (9–11). Using LPS as a stimulus, we demonstrated that primary cultures of tracheal epithelial cells derived from Glrx1−/− mice were refractory to the LPS-induced activation of NF-κB and the production of inflammatory mediators, compared with wild-type (WT) cells (9). To date, studies on the impact of Grx manipulation on pulmonary inflammation remain scant. The goal of the present study was to evaluate the impact of Grx1 deficiency on LPS-induced PSSG content and on pulmonary inflammation. Some of the work described here was previously reported as abstracts (12, 13).
MATERIALS AND METHODS
Mice
Glrx1−/− mice were backcrossed more than 10 generations onto a C57B/6 background (14). For all experiments, 2-month-old Glrx1−/− and littermate WT C57B/6 control mice were used. Mice were housed in a barrier facility, and all studies were approved by the Institutional Animal Care and Use Committee at the University of Vermont. When referring to the glutaredoxin-1 gene, the nomenclature Glrx1 is used throughout, whereas glutaredoxin-1 protein is abbreviated as Grx1.
Alveolar Macrophage Isolation and Culture
WT C57B/6 or Glrx1−/− mice were killed by lethal pentobarbital injection, and their tracheas were immediately cannulated with a blunted 18-gauge needle. Lungs were then lavaged six times with 1-ml aliquots of sterile PBS containing 0.2 mM EGTA. Aliquots were pooled, and cells were pelleted by centrifugation (600 × g, 10 minutes). Pellets were resuspended in growth medium (Eagle's minimum essential medium [Gibco, Grand Island, NY], 1% penicillin/streptomycin, and 10% FCS), and cells were enumerated with a hemocytometer. For culture, cells were plated onto 12-well plastic culture plates (2 × 10⁵ cells/well) and incubated for 1 hour at 37°C. Nonadherent cells were removed by aspiration of the medium. For determinations of surface area, 5 × 10⁴ cells per mouse were sedimented onto glass slides and stained using a Hema3 kit (Fischer Scientific, LLC, Kalamazoo, MI). Purity was confirmed at greater than 98% according to differential microscopy. Measurements were performed on 300 cells per animal, using *.tif images of cells, taken with a MagnaFire (Indigo Scientific, Niagra Falls, NY) digital camera and the Metamorph 7.5 software package (Molecular Devices, Sunnyvale, CA), according to the manufacturers' instructions.
LPS-Induced Pulmonary Inflammation
Mice were anesthetized using 5% halothane in oxygen to induce deep sedation and mild bradypnea. After sedation, mice were placed on an inclined board, their tongues were extended to expose the oropharynx, and 5 μg of Escherichia coli LPS (List Biological Laboratories, Inc., Campbell, CA) were dissolved in 50 μl of sterile PBS and pipetted into the posterior oropharynx. PBS alone was administered as a control. At 1, 4, 16, 24, and 72 hours, mice were killed by lethal pentobarbital injection, and bronchoalveolar lavage (BAL) was performed as described elsewhere (15). BAL cells were centrifuged (600 × g, 10 minutes, 4°C), and the supernatants were decanted and stored at −80°C. Cells were resuspended in PBS and enumerated using an Advia 120 Hematology Analyzer (Bayer, Pittsburgh, PA). For differential cytology, 5 × 10⁴ cells were centrifuged onto glass slides and stained using the Hema3 kit (Fischer Scientific, LLC). In selected experiments, 24 hours after the instillation of LPS, mice were killed and the BAL fluid was collected. Macrophages were purified via Percoll (GE Healthcare Life Sciences, Piscataway, NJ) gradient centrifugation, and the Grx1 content was assessed via Western blot analysis.
Grx1 Activity Assay
Activity assays were performed as previously described (16). Briefly, after dissection, lungs were snap-frozen in liquid nitrogen and pulverized using a mortar and pestle. Pulverized lung tissue was lysed in 137 mM Tris-HCl, pH 8.0, 130 mM NaCl, and 1% Nonidet P-40 (NP-40). Lysates were then cleared by centrifugation, and 100 μg were incubated with reaction buffer (137 mM Tris–HCl, pH 8.0, 0.5 mM glutathione [Sigma-Aldrich, St. Louis, MO], 1.2 U glutathione disulfide reductase [Roche, Indianapolis, IN], 0.35 mM NADPH [Sigma Aldrich], 1.5 mM EDTA, pH 8.0, and 2.5 mM cysteine–SO3 [Sigma Aldrich]) at room temperature. The consumption of NAPDH was followed spectrophotometrically at 340 nm. Alternately, 100 μl of cell-free BAL fluid (BALF) were incubated with reaction buffer. As a control, samples were incubated in reaction buffer lacking cysteine–SO3 substrate, and in each sample, the spontaneous consumption of NADPH was subtracted. Values are expressed in units (U) in which 1 U equals the oxidation of 1 μmol NADPH/minute/mg protein for lung homogenates, and per 100 μl for BALF.
Enzyme-Linked Immunoadsorbent Assay
Frozen BALF samples were thawed and assayed for IL-1β, IL-6, Granulocyte/Monocyte Colony–Stimulating Factor (GM-CSF), Keratinocyte derived Chemokine (KC), and TNF-α protein concentrations by ELISA (Duoset ELISA; R&D Systems, Minneapolis, MN), according to the manufacturer's instructions. Cytokine release by LPS-stimulated alveolar macrophages in culture was also quantified by ELISA. Alveolar macrophages were cultured with LPS (1 μg/ml) for 24 and 48 hours, at which times the cells were centrifuged (600 × g, 10 minutes, 4°C). The supernatants were then analyzed by ELISA for IL-6 and TNF-α.
In Situ Determination of PSSG
After dissection, the left lobes of lungs were instilled with 4% paraformaldehyde (PFA) in PBS at a pressure of 25 cm H2O, and placed into 4% PFA at 4°C overnight. Fixed lungs were then mounted in paraffin, and 5-μm sections were prepared on glass microscope slides. Lung sections were then cleared of paraffin with xylene, and rehydrated through a series of ethanol into PBS. For the analysis of BALF, 5 × 10⁵ cells were centrifuged onto glass slides and fixed with 4% PFA in PBS. PSSG staining was performed as described previously (17). Briefly, thiol groups were blocked using a buffer that contained 25 mM Hepes, pH 7.4, 0.1 mM EDTA, pH 8.0, 0.01 mM neocuproine, 40 mM N-ethylmaleimide (Sigma, St. Louis, MO), and 1% Triton (Sigma). After washing, S-glutathionylated cysteine groups were reduced by incubation with 13.5 μg/ml human Grx1 (Lab Frontiers, Seoul, Korea), 35 μg/mL glutathione disulfide (GSSG) reductase (Roche), 1 mM GSH (Sigma), 1 mM NADPH (Sigma), 18 μmol EDTA, and 137 mM Tris · HCl, pH 8.0. After washing, reduced cysteines were labeled with 1 mM N-(3-maleimidylpropionyl) biocytin (MPB) (Roche). Excess MPB was removed, and tissue samples were incubated with streptavidin-conjugated Alexafluor-568. Nuclei were stained with Sytox Green (Molecular Probes, Carlsbad, CA). Slides were analyzed by confocal microscopy, using an Olympus BX50 microscope (Olympus, Center Valley, PA) coupled to a Bio-Rad MRC 1024 confocal laser scanning microscope (Zeiss, Thornwood, NY). As a negative control, Grx1 was omitted from the reaction mix. PSSG was evaluated in terms of alveolar macrophages (AMs), and affixed to glass slides using identical procedures. The relative fluorescence intensity (RFI) for PSSG was analyzed from *.tif images, using the Metamorph 7.5 software package (Molecular Devices), and average RFI values were calculated from 25 AMs per group.
Biochemical Analysis of Protein S-Glutathionylation in Lung Tissue
Protein S-glutathionylation in lung tissue was determined using the glutathione/glutathione reductase/NADPH/5,5′-dithiobis (2-nitrobenzoic acid) recycling assay, according to procedures described elsewhere (18). Briefly, lung tissues were homogenized in 137 mM Tris–HCl, pH 8.0, 130 mM NaCl, and 1% NP-40. The protein content was determined, and samples were equalized for protein content. Two hundred micrograms of protein were precipitated with acetone. The pellet was resuspended in 0.1% Triton-X100 and 0.6% sulfosalicylic acid containing buffer, and was freeze–thawed twice. Protein-associated glutathione was released with sodium borohydride, and the GSH was determined. The sodium borohydride–sensitive fraction of GSH was calculated (expressed as nmol GSH/mg of protein).
In Situ Analysis of Lung Grx1 Expression
Rehydrated lung sections (5 μm) from paraffin- embedded blocks were incubated in buffer containing 0.1 mM EDTA at 95°C for 10 minutes, and cooled to room temperature. For the analysis of BALF, 5 × 10⁵ cells were centrifuged onto glass slides and fixed with 4% PFA in PBS. Slides were then blocked for 1 hour with Tris · HCl buffered saline (TBS) containing 5% BSA and 0.5% Tween (Sigma). Slides were then incubated with and without Grx1 primary antibody (American Diagnostica, Inc, Stamford, CT) or phyco erythrin (PE)-conjugated Gr-1 antibody (BD Biosciences) in blocking buffer at 4°C overnight. Slides were washed with TBS and incubated for 1 hour with fluorophore-conjugated secondary antibody in blocking buffer. Slides were washed with TBS, and nuclei were stained with Sytox Green or 4′,6-diamidino-2-phenylindole (DAPI) (Molecular Probes, Sparks, MD). Slides were analyzed by confocal microscopy, as already described.
Analysis of RelA Nuclear Translocation in AMs by Immunofluorescence
AMs (5 × 10⁴ cells/well) were plated on tissue culture–ready chamber slides (BD Biosciences) and incubated for 1 hour at 37°C, and nonadherent cells were removed by aspiration. Medium containing LPS (1 μg/ml) was added, and the cells were incubated for 1 hour at 37°C. Cells were washed with PBS and fixed with 4% PFA in PBS. Cells were permeabilized with 0.2% Triton in PBS, and subsequently blocked with 1% BSA in PBS. Cells were then incubated with primary antibody recognizing the RelA subunit of NF-κB (catalogue number SC372; Santa Cruz Biotechnology, Santa Cruz, CA). Controls were performed with an isotype-matched nonspecific antibody to ensure specificity. Slides were then washed and incubated with Alexafluor-568–conjugated secondary antibody. Nuclei were counterstained with Sytox Green, and the slides visualized by laser scanning confocal microscopy, as already described.
Assessment of Nitrite
Nitrite concentrations were determined as described previously (19). Medium from AMs grown in the presence of LPS for 24 and 48 hours was combined with equal volumes of Griess Reagent (Sigma), and the absorbance was read at 540 nm. Sodium nitrite (Sigma) was used to generate a standard curve.
Phagocytosis Assay
AMs (5 × 10⁴ cells/well) were plated on tissue culture–ready chamber slides (BD Biosciences) and incubated for 1 hour at 37°C, and nonadherent cells were removed by medium aspiration. Medium containing fluorescent Fluoresbrite polychromatic red latex microspheres (1 μm) (Polysciences, Inc.) at a ratio of 50:1 (microspheres/AM) and LPS (1 μg/ml) was then added. Cells were incubated at 37°C for 1 hour. Cells were washed with PBS and stained with a Hema3 kit (Fischer Scientific, LLC). Slides were mounted and examined according to wide-field fluorescent microscopy. For each group, macrophages containing two or more beads were considered positive. Three hundred cells per animal were evaluated in each experimental group.
Immunoblotting
Pulverized lung tissue and alveolar macrophages (2 × 10⁵ cells) were lysed in buffer containing 137 mM Tris · HCl (pH 8.0), 130 mM NaCl, and 1% NP-40. For BALF, 200 μl of cell-free BALF were mixed with 800 μl of cold (−20°C) acetone and incubated overnight at −20°C. Precipitated proteins were pelleted by centrifugation and resuspended in loading buffer. All samples were resolved by SDS-PAGE and blotted to polyvinylidene fluoride (PVDF) membranes (Millipore, Billerica, MA) before immunoblotting. Antibodies in this study included Grx1 (American Diagnostica, Inc.), RelA, RelB, the inhibitor of kappa B α (IκBα; Santa Cruz Biotechnology, Inc.), PU.1 (Cell Signaling Technology, Danvers, MA), the inhibitor of kappa B kinase α (IKKα; Millipore), and β-actin (Sigma Aldrich).
Statistical Analyses
Statistical analyses of all data were performed using GraphPad Prism software (GraphPad, Inc., San Diego, CA) with ANOVA, using the Tukey test to adjust for multiple comparisons or the Student t test where appropriate. Data from each experiment are presented as mean plus standard error of the mean values. Results with P < 0.05 were considered statistically significant.
RESULTS
Grx1 Activity and Expression Are Induced in the Lungs of Mice after Administration of LPS
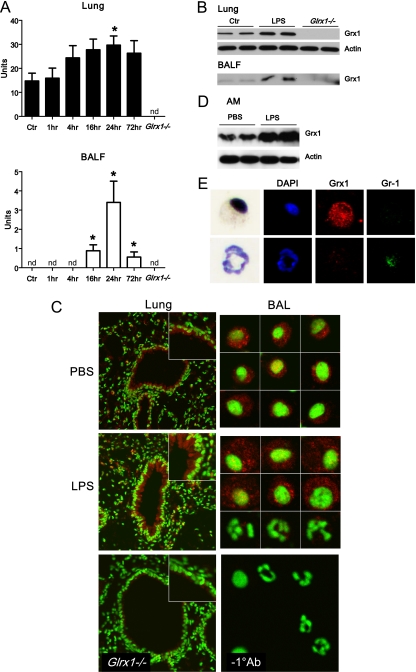
Our laboratory previously demonstrated increases in Grx1 activity in the lung tissue of mice with ovalbumin-induced allergic inflammation (16). We therefore investigated whether similar increases in Grx1 activity were evident in LPS-induced inflammation. The results in Figure 1A demonstrate increases in Grx1 activity in lung homogenates and BAL fluid from mice after the administration of LPS, compared with PBS controls. In whole-lung homogenates, increases in Grx1 activity were detectable by 4 hours and persisted 72 hours after administration (Figure 1A). In cell-free BAL fluid, increases in Grx1 activity were detectable by 16 hours and persisted 72 hours after administration (Figure 1A). Elevated Grx1 protein content was also detectable in homogenized lung tissue and BAL fluid (Figure 1B). As expected, lung homogenates and BAL fluid from Glrx1−/− animals demonstrated an absence of Grx1 enzymatic activity or immunoreactivity (Figures 1A and 1B). The in situ evaluation of Grx1 demonstrated marked immunofluorescence in the bronchial epithelium in PBS control mice and in response to LPS (Figure 1C). Given that the increases in Grx1 activity corresponded with the timing of neutrophil influx into the airways (see below), we next determined Grx1 immunofluorescence in cells recovered from BAL. The results in Figure 1C (right) demonstrate that Grx1 immunofluorescence is present in cells with a morphology consistent with AMs. In contrast, Grx1 expression in cells that morphologically resemble neutrophils is markedly lower (Figure 1C, right middle, bottom row). The purification of AMs via Percoll gradient centrifugation, and the subsequent assessment of Grx1 content via Western blot analysis, confirmed increases in Grx1 content in AMs, 24 hours after the instillation of LPS into airways (Figure 1D). Furthermore, the dual staining of BAL cells with antibodies directed against Grx1 and the granulocyte marker Gr-1 demonstrated that Grx1 immunoreactivity occurred primarily within Gr-1–negative cells, consistent with immune localization of Grx1 within macrophages (Figure 1E). In aggregate, these results demonstrate that during acute LPS-induced inflammation, Grx1 is induced in lung tissue, with prominent reactivity occurring in the bronchial epithelium and AMs.
Figure 1.
Assessment of Grx1 activity and expression after oropharyngeal aspiration of LPS. (A) Whole-lung homogenates or cell-free BAL fluid (BALF) were collected from wild-type (WT) C57B/6 mice after PBS (Ctr) or LPS aspiration (5 μg). At the time points indicated, Grx1 activity was evaluated. As negative controls, lung homogenates and cell-free BALF from Glrx1−/− mice were included. Data are expressed as mean units of four mice per group (± SEM). *P < 0.05. nd, = not detected. (B) Protein was extracted from whole-lung homogenates or cell-free BALF of WT C57B/6 mice after PBS (Ctr) or LPS aspiration at 24 hours, and analyzed for Grx1 by immunoblot. As negative controls, lung homogenates and cell-free BALF from Glrx1−/− mice were included. Average mean (± SEM) densitometric values for Grx1 on two independent pooled experiments (n = 4 mice/group) include, for lung tissue, Ctr, 4.7 (1.5); LPS, 9.3 (0.0);* and Glrx1−/−, 0.0 (0.0); and for BALF, Ctr, 3.6 (0.4); LPS, 7.2 (2.0);* and Glrx1−/−, 0.0 (0.0). *P < 0.05 (ANOVA), compared with the PBS group. (C) In situ evaluation of Grx1 content in lung tissue (left) from WT mice exposed to PBS (Ctr) or LPS for 24 hours. As a control, Grx1 staining was performed, using a lung isolated from a Glrx1−/− mouse. Results were evaluated by confocal laser scanning microscopy. Original magnification, ×200. Insets: Twofold enlargement of bronchial epithelium. Grx1, red; DNA, green. Right: Assessment of Grx1 immunoreactivity in cells recovered from BALF. WT mice were exposed to PBS or LPS, and were lavaged 24 hours later. Cytospins were prepared for the evaluation of Grx1 content via confocal laser scanning microscopy. Individual cells are shown. Right middle: Top two rows of cells represent cells with morphology consistent with alveolar macrophages (Ams), whereas bottom row represents cells with morphology consistent with neutrophils. Images are representative of more than 50 cells evaluated per group. Mean relative fluorescence intensity (RFI) values (SEM; n = 25) for Grx1 content in macrophages include 0.9 (0.1) for PBS, and 1.4 (0.3)* for LPS. Right bottom: As a control, the primary antibody was omitted from the staining protocol. Original magnification, ×400. Grx1, red; DNA, green. *P < 0.05 (ANOVA), compared with PBS group. (D) Assessment of Grx1 content in AMs isolated from BALF 24 hours after instillation of LPS or PBS. Macrophages were isolated via Percoll gradient centrifugation, and Grx1 content was assessed via Western blot analysis. (E) Evaluation of Grx1 and Gr-1 expression in BAL cells. Twenty-four hours after instillation with LPS, BAL was performed, and cells were stained with anti-Grx1 and Gr-1 antibodies. Expression of Grx1 (red) and Gr-1 (green) was examined via confocal laser scanning microscopy. Nuclei were counterstained with 4′,6-diamidino-2-phenylindole (DAPI) (blue). After confocal analysis, coverslips were removed and cells were stained using a Hema3 kit. Note the strong immunoreactivity of Grx1 in AMs, which do not react with Gr-1 antibody, whereas neutrophils that react with anti-Gr-1 show low levels of Grx1.
Grx1 Deficiency Does Not Affect Cell Counts, but Attenuates Cytokine Levels in BAL, after the Oropharyngeal Administration of LPS
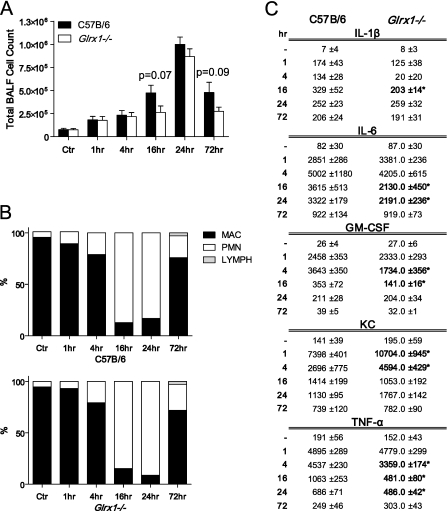
Given that Grx1 content was increased in lung tissue in response to LPS-induced acute lung inflammation, we next examined the effects of Grx1 ablation. A comparative evaluation of Glrx1−/− mice and C57B/6 littermates showed a robust inflammatory response, manifested by increases in total cell counts (mainly neutrophils in BAL), that occurred as early as 1 hour and persisted 72 hours after the administration of LPS (Figures 2A and 2B). Although the extent of inflammation tended to be decreased in Glrx1−/− mice, the differences were not statistically significant. However, the assessment of cytokine levels in cell-free BAL fluid demonstrated significant decreases in the BAL content of IL-1β, IL-6, GM-CSF, and TNF-α in Glrx1−/− mice compared with C57B/6 control mice. In contrast, KC levels in BAL were increased in Glrx1−/− mice at 1 and 4 hours after the administration of LPS, compared with control mice (Figure 2C).
Figure 2.
Comparative assessment of pulmonary inflammation in C57B/6 WT and Glrx1−/− mice after oropharyngeal aspiration of LPS. (A) BALF was collected from WT C57B/6 or Glrx1−/− mice at time points indicated. Cells were enumerated using an automated cytometer. Data are expressed as mean (± SEM) total cell counts (n = 4–8 mice/group/time point). Actual P values for differences between Glrx1−/− and WT mice at 16-hour and 24-hour time points are indicated. (B) Cellular differentials in BAL reflect percentages of macrophages (MAC), lymphocytes (LYMPH), and neutrophils (PMN). No statistically significant differences were apparent between WT and Glrx1−/− groups. (C) Evaluation of cytokines in cell-free BALF via ELISA. Data are expressed as mean pg/ml (± SEM) (n = 4–8 mice/group/time point). *P < 0.05, compared with WT mice (ANOVA).
Grx1 Deficiency Enhances Pulmonary PSSG In Situ after the Administration of LPS
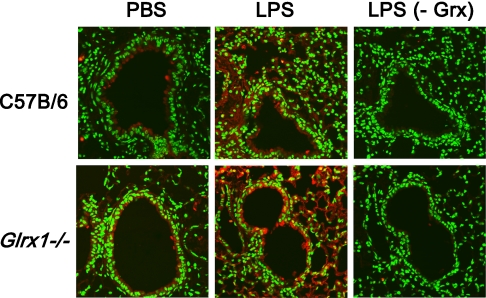
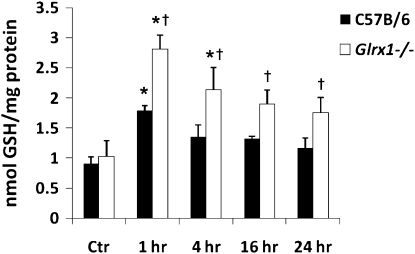
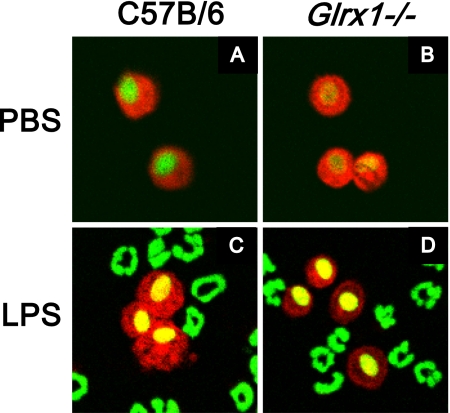
Given that the primary function of glutaredoxins under physiologic conditions is to de-glutathionylate proteins, we sought to determine the impact of Grx1 deficiency on the formation of pulmonary PSSG in situ. The results in Figure 3 (top) demonstrate slight increases in PSSG reactivity in lung tissue 4 hours after the administration of LPS, compared with PBS control tissue. Although we failed to demonstrate robust increases in PSSG reactivity in Glrx1−/− mice that received PBS compared with C57B/6 control mice (Figure 3, top left and bottom left), the Glrx1−/− mice exhibited enhanced PSSG content after the administration of LPS, with prominent reactivity in the bronchial epithelium and parenchymal regions (Figure 3, top and bottom middle). As control tissue, serial lung sections from LPS-exposed mice were subjected to the same procedure, with the exception that Grx1 was omitted from the reaction mix. As shown in Figure 3 (right), the omission of Grx1 from the reaction mix resulted in a loss of labeling, demonstrating that the observed reactivity observed in lung tissue was attributable to Grx1-catalyzed cysteine derivatization. To corroborate the alterations in PSSG content in lung tissue from mice lacking Glrx1 in response to LPS, we evaluated PSSG content biochemically. The results in Figure 4 demonstrate an approximately twofold increase in PSSG content in the lung tissue of WT mice exposed to LPS compared with PBS control tissue. Increases in PSSG were maximal at 1 hour after administration, and decreased subsequently. In contrast, in Glrx1−/− mice exposed to LPS, the PSSG content increased more robustly, and remained significantly elevated compared with PBS control mice throughout the 24-hour time course. Our previous work also demonstrated that PSSG reactivity was highest in AMs, and could be further increased by LPS (17). We therefore examined the impact of Glrx1 ablation on PSSG reactivity in AMs. Consistent with our previous results, in AMs recovered from both WT C57B/6 mice and Glrx1−/− mice, significant baseline PSSG reactivity was detected, which was also apparent in response to LPS (Figure 5). We did not detect statistically significant differences in the RFIs of PSSG in AMs between any of the treatment groups. No apparent PSSG staining was detected in cells that morphologically resembled neutrophils recovered from WT C57B/6 mice or Glrx1−/− mice after the administration of LPS (Figure 5), consistent with our previous results in WT mice (17). In aggregate, our results suggest that the absence of Grx1 does not appear to affect PSSG reactivity in lung tissue under basal conditions, but results in a robust increase in PSSG content in lung tissue in response to exposure to LPS.
Figure 3.
In situ analysis of protein S-glutathionylation in WT C57B/6 and Glrx1−/− mice, 4 hours after oropharyngeal aspiration of LPS. Paraffin-embedded lung sections were stained for S-glutathionylated proteins (red) by Grx1-catalyzed derivatization, and nuclei were counterstained with Sytox Green. Images were captured by laser scanning confocal microscopy, using identical instrument settings. Images are representative results of four animals/group. Right: As a negative control, Grx1 was omitted (−Grx) from the staining reaction conducted on a serial lung section. Original magnification, ×200. PSSG, red; DNA, green.
Figure 4.
Biochemical analysis of protein S-glutathionylation in homogenized lung tissues of C57B/6 and Glrx1−/− mice exposed to LPS. Mice were exposed to LPS oropharyngeally, and at the indicated times, homogenized lung tissue was prepared, proteins were precipitated, and glutathione was released using Na–borohydride and quantified using the glutathione disulfide (GSSG) reductase recycling assay, with 5 ,5′ -dithio-bis-(2-nitrobenzoic acid) (DTNB) as substrate. Na–borohydride–dependent formation of 5′-thio-2-nitrobenzoic acid was calculated and normalized to protein content. Data are expressed as nmol tripeptide glutathione (GSH)/mg protein. *P < 0.05 (ANOVA), compared with respective control (Ctr) groups. †P < 0.05 (ANOVA), compared with respective C57B/6 groups exposed to LPS.
Figure 5.
Assessment of S-glutathionylation (PSSG) in BAL cells. C57B/6 WT mice and Glrx1−/− mice were exposed to PBS, or LPS via oropharyngeal aspiration, for 16 hours. Mice were lavaged, and 5 × 10⁴ BAL cells were centrifuged onto glass microscope slides before being stained for S-glutathionylated proteins (red), using Grx1-catalyzed cysteine derivatization. Nuclei were counterstained with Sytox Green (green), and images were captured using laser scanning confocal microscopy. Images are representative results of four animals/group. Original magnification, ×200. Mean (SEM, n = 25) RFI values for PSSG content in AMs include, for C57Bl\6 mice, PBS, 1.4 (0.1); for Glrx1−/− mice, PBS, 1.4 (0.1); for C57Bl\6 mice, LPS, 1.5 (0.1); for Glrx1−/− mice, LPS, 1.2 (0.1). No statistically significant differences were apparent between different treatment groups.
Grx1 Deficiency Alters AM Morphology and Activation after Stimulation with LPS
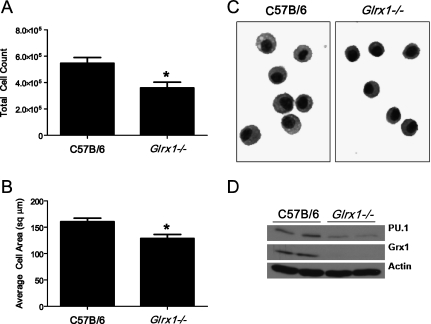
Grx1 expression was reported to increase significantly during the differentiation of monocytic cell lines into macrophage-like cells (20), yet the function of Grx1 remains unknown. We therefore sought a further characterization of AMs recovered from Glrx1−/− mice. After the serial lavage of naive mice, the number of AMs recovered was significantly lower in Glrx1−/− mice compared with WT C57B/6 mice (Figure 6A). Furthermore, a two-dimensional analysis of cell area revealed that AMs recovered from Glrx1−/− mice were slightly but statistically significantly smaller than those recovered from WT C57B/6 mice (Figures 6B and 6C). An immunoblot analysis of whole-cell lysates for the hematopoietic cell–specific transcription factor PU.1, a marker of macrophage differentiation and maturity (21), showed significantly less expression in Glrx1−/− –derived AMs compared with AMs derived from WT C57B/6 mice (Figure 6D).
Figure 6.
Evaluation of AMs from WT or Glrx1−/− mice. (A) Control C57B/6 WT or Glrx1−/− mice were lavaged, and total cells recovered were enumerated. Data represent mean values (± SEM) of total cells recovered from 15 mice/group. *P < 0.05 (ANOVA). (B) Recovered BAL cells were centrifuged onto glass microscope slides and stained, and their two-dimensional areas were calculated using digital image analysis software. Data represent mean area (± SEM) of 300 cells from three mice/group. *P < 0.05 (ANOVA). (C) Representative micrograph of cells highlights morphologic differences between AMs derived from WT C57B/6 and Glrx1−/− mice. Original magnification, ×200. (D) Immunoblot analysis of AMs for the E-twenty-six transcription factor and marker of macrophage maturity PU.1, Grx1, and actin as genotype and loading controls, respectively. BAL cells were derived from control mice and consisted of > 99% AMs. Data are representative of blots obtained from three independent experiments. Average mean (± SEM) densitometric values for PU.1 (n = 4, two pooled experiments) include, for C57B/6 mice, 3.0 (1.6); for Glrx1−/− mice, 1.0 (0.3).* Average mean (± SD) densitometric values for Grx1 (n = 4, two pooled experiments) include, for C57B/6 mice, 2.9 (0.1); for Glrx1−/− mice, 0.0 (0.4). *P < 0.05 (ANOVA), compared with C57Bl\6 group.
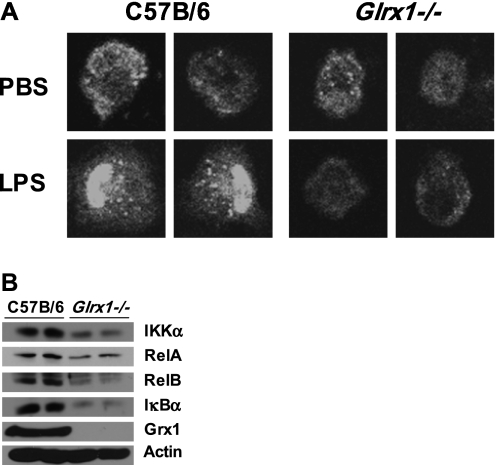
To examine the AM phenotype of Glrx1−/− mice further, we isolated cells from naive WT and Glrx1−/− mice, and stimulated them in vitro with LPS to evaluate the activation of NF-κB. After stimulation with LPS, AMs from WT C57B/6 mice showed robust evidence of activation of the NF-κB pathway, as measured by nuclear translocation of the RelA subunit of NF-κB (Figure 7A, left). In contrast, AMs from Glrx1−/− showed no nuclear translocation of RelA after exposure to LPS, and the overall immunoreactivity for RelA appeared to decrease in Glrx1−/− AMs (Figure 7A, right). Indeed, an immunoblot analysis of whole-cell lysates confirmed the decreased cellular content of RelA, in addition to the decreased content of several NF-κB pathway components, including RelB, IκBα, and IKKα (Figure 7B). These results demonstrate that the LPS-induced activation of NF-κB is impaired in AMs lacking Glrx1, consistent with previous findings in tracheal epithelial cells isolated from Glrx1−/− mice (9). The results also suggest a putative role for Grx1 in regulating the expression of multiple NF-κB family members.
Figure 7.
Analysis of LPS-induced RelA nuclear translocation and expression of NF-κB pathway components in AM derived from C57B/6 mice and Glrx1−/− mice. (A) Nuclear translocation of RelA (p65) (white) after LPS stimulation of AMs from WT C57B/6 mice and Glrx1−/− mice. Images were captured by laser scanning confocal microscopy, and are representative of three independent experiments. Original magnification, ×400. (B) Expression of NF-κB pathway components assessed by immunoblot of whole-cell lysates of AMs obtained via BAL from untreated WT C57B/6 or Glrx1−/− mice. Data are representative of blots obtained from three independent experiments. Average mean (± SEM) densitometric values (n = 4, two pooled experiments) include for IKKα, C57B/6 mice, 8.5 (1.2); Glrx1−/− mice, 5.0 (0.0)*; for RelA, C57B/6 mice, 4.7 (0.3); Glrx1−/− mice, 3.1 (1.9);* RelB, for C57B/6 mice, 5.5 (1.1); Glrx1−/− mice, 2.5 (2.1);* IκBα, for C57B/6 mice, 9.1 (1.9); Glrx1−/− mice, 4.2 (0.2);* and Grx1, for C57B/6 mice, 13.1 (0.7); Glrx1−/− mice, 0.0 (0.0).* *P < 0.05 (ANOVA), compared with C57Bl/6 group.
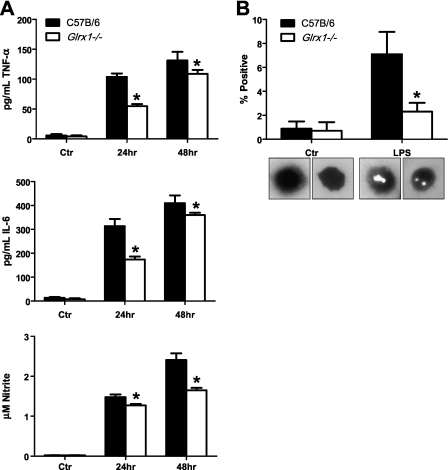
To determine the functional consequences of failure to activate NF-κB in Glrx1-deficient AMs in response to LPS, we evaluated the content of NF-κB–regulated cytokines levels in medium. Compared with WT AMs, Glrx1−/− AMs produced significantly less TNF-α and IL-6 in response to stimulation with LPS. Furthermore, as an indirect measure of inducible nitric oxide synthase activity, nitrite content was measured and found to be significantly lower in Glrx1−/− AMs compared with WT counterparts stimulated with LPS (Figure 8A). Finally, WT or Glrx1−/− AM phagocytosis was analyzed by latex bead incorporation. The results in Figure 8B demonstrate that after stimulation with LPS, Glrx1−/− AMs demonstrated significantly less bead incorporation compared with WT AMs. Collectively, these results suggest that Grx1 may be important in the differentiation or maturation and phagocytic function of AMs, and that Grx1 may promote their ability to activate NF-κB and induce the expression of proinflammatory mediators.
Figure 8.
Assessment of activation of WT or Glrx1−/− AMs after stimulation with LPS in culture. (A) AMs were isolated from control C57Bl/6 and Glrx1−/− mice. Cells were plated and stimulated with LPS for assessment of secretion of IL-6 and TNF-α by ELISA. Bottom: Evaluation of nitrite content via Griess assay as an indicator of nitric oxide synthase 2 (NOS2) activation. Data represent mean (± SEM) values, and are representative of three independent experiments *P < 0.05 (ANOVA). (B) Phagocytosis was analyzed by latex bead incorporation. Cells containing two or more beads were considered positive. Data are expressed as percent positive (± SEM) after scoring 300 cells/animal. Original magnification, ×200. *P < 0.05 (ANOVA).
DISCUSSION
PSSG has emerged as a prototypic redox-dependent posttranslational modification of target cysteines that regulate protein function. The functional impact of S-glutathionylation depends on the target protein. For example, S-glutathionylation enhances the proapoptotic function of Fas (6), and enhances the activation of sarcoplasmic reticulum Ca2+-ATPase (SERCA) SERCA (22) and p21 Ras (23). In contrast, we recently demonstrated that the NF-κB pathway is inhibited via the S-glutathionylation of cysteine 179 of IKKβ. We showed that the S-glutathionylation of IKKβ was enhanced in cells lacking Grx1, and that after the overexpression of Grx1, the S-glutathionylation of IKKβ was decreased, whereas the activation of NF-κB was enhanced (9). Furthermore, tracheal epithelial cells derived from Glrx1−/− mice did not undergo nuclear translocation of RelA or an increase in NF-κB DNA binding activity, and failed to express macrophage inflammatory protein 2 (MIP2) and KC in response to LPS, in contrast to WT counterparts that displayed robust proinflammatory responses (9). Moreover, other reports documented that the S-glutathionylation of the RelA (11) and p50 (10) subunits of NF-κB inhibited their function.
Based on these observations that demonstrate an inhibition of NF-κB via S-glutathionylation, and on our previous data demonstrating the functional importance of NF-κB activation in airway epithelium in LPS-driven proinflammatory responses (15), we predicted that Glrx1−/− mice would display decreased inflammatory responses in response to LPS. In contrast to those expectations, the extent of airway inflammation was only marginally affected, although levels of proinflammatory cytokines were markedly decreased in Glrx1−/− mice after the administration of LPS, compared with control mice. As expected, PSSG reactivity increased in Glrx1−/− mice after the administration of LPS, compared with WT control mice. It was beyond the scope of this study to confirm whether the S-glutathionylation of NF-κB pathway components occurred in the airway epithelium from Glrx1−/− mice in response to LPS administration in vivo, which would require the isolation of the bronchial epithelial compartment followed by an assessment of the S-glutathionylation of target proteins. Plausibly, in the LPS model of acute lung inflammation, the extent of increases in S-glutathionylation of NF-κB in Glrx1−/− mice was insufficient to block the NF-κB pathway effectively, which would have permitted the observed influx of neutrophils. Alternately, we cannot rule out the possibility that pathways other than NF-κB activation contributed to the LPS-induced inflammatory response triggered in Glrx1−/− mice. In addition, the systemic ablation of Glrx1 may target cell types other than bronchial epithelial cells and AMs, and those other cell types may have contributed to the observed inflammatory response. The compensation of various antioxidant enzymes or Grx2 content was not evident in lungs from Glrx1−/− mice. Glrx1−/− mice also showed a lack of detectable deglutathionylase activity in homogenates of brain, heart, lung, liver, and kidney tissue (14). Despite these observations, changes in other components within the repertoire of redox factors may have occurred in Glrx1−/− mice, and may have obscured some of the effects of Glrx1 ablation on the inflammatory response. Although PSSG content was increased in response to LPS in Glrx1−/− mice, decreases in PSSG concentrations occurred over time (Figure 4). These data indicate other potential de-glutathionylating events, or mechanisms to decrease the PSSG content in lungs from Glrx1−/− mice exposed to LPS, such as the oxidoreductase, thioredoxin (24), or the removal of S-glutathionylated proteins via other mechanisms. Unraveling those various scenarios will require additional experimentation and the implementation of other models wherein Glrx1 is ablated conditionally within specific cell types of the lung.
The assessment of PSSG in situ using Grx1-based cysteine derivatization did not reveal apparent increases in reactivity in control WT or Glrx1−/− lung tissues or AMs. Only in response to the administration of LPS did we observe increases in PSSG reactivity in the lung tissue of Glrx1−/− mice, compared with WT animals. These findings suggest that a systemic lack of Glrx1 does not affect baseline PSSG, but allows increases in reactivity in response to a stimulus (e.g., LPS). Indeed, a previous study using Glrx1−/− murine embryonic fibroblasts also failed to demonstrate differences in the baseline content of PSSG (14). The present findings are in contrast with results from in vitro cell cultures, wherein the ablation of Grx1 was sufficient to increase PSSG in the absence of additional stimuli (9, 25). These disparate findings that remain to be further unraveled reflect potential differences in the redox environment between various cell-culture and animal models.
Our present findings demonstrate that the expression of Grx1 is increased in lung tissue in response to LPS, notably in the bronchial epithelium. Of particular relevance, the substantial enzymatic activity of Grx1 was also measured in BAL after the administration of LPS, the timing of which mirrored the influx of neutrophils. However, the assessment of Grx1 content in neutrophils revealed low reactivity relative to AMs, indicating substantial Grx1 immunoreactivity (Figure 1C), consistent with other observations (26). Thus, neutrophils may not abundantly express Grx1, or else Grx1 is lost from neutrophils after their degranulation. These scenarios will need to undergo further testing. Alternately, AMs or epithelial cells may have released Grx1, through mechanisms as yet unknown. The biological role or extracellular Grx1 also remains to be unraveled. However, others demonstrated that the related oxidoreductase, thioredoxin1 (Trx1), can be released from cells, and after its leaderless export (27), Trx1 acts as a potent chemoattractant (28) and mitogen (29), and interacts with TNF receptor superfamily member 8, also known as CD30 (30). Whether any of these properties are shared between Grx1 and Trx1 remains to be determined.
Neutrophils, which have a high oxidant-generating capacity, contained no detectable PSSG, based on our assay that used Grx1-based cysteine derivatization to reveal PSSG, and Grx1 immunoreactivity in neutrophils was also low. These initial observations require confirmation through additional biochemical assays performed on isolated neutrophils, but these assays were beyond the scope of this study. Neutrophils, with low Grx1 and PSSG content, may exist in an overoxidized environment, such that cysteines would be unavailable for normal redox regulation, a possibility that needs further testing.
One of the most striking features of Glrx1−/− mice involves their phenotype of AMs. Compared with WT AMs, Glrx1−/− AMs appeared immature in appearance and function, based on their smaller size, lower expression of PU.1, decreased phagocytosis, and production of inflammatory mediator. Consistent with our previous observations in Glrx1−/− epithelial cells (9), in response to LPS, Glrx1−/− AMs showed no apparent translocation of RelA into the nucleus. Surprisingly, the expression of various proteins of the NF-κB pathway was decreased in Glrx1−/− AMs, compared with WT cells. These results, which need to be corroborated with additional markers of macrophage maturation or differentiation, suggest that Grx1 is critical not only for AM function, but also for the expression of NF-κB pathway members, events that are perhaps linked. Indeed, a previous report demonstrated that in monocyte-like cell lines, Grx1 was associated with differentiation along a macrophage lineage (20). Similarly, concentrations of the NF-κB family members c-Rel, p50, p52, and RelB increased after the cytokine-induced maturation of dendritic cells (31). RelB upregulation and nuclear translocation are considered hallmarks of human myeloid dendritic cell maturation, and were shown to regulate the development of a subset of monocyte-derived dendritic cells (32). Increases in RelA and RelB DNA binding were also detected in macrophages compared with their monocyte precursors (33). The role of Grx1 therein, and the intricacies whereby Grx1 and potentially PSSG regulate the expression of NF-κB family member proteins, awaits further investigation.
In conclusion, the present study demonstrates that a systemic lack of Glrx1 attenuates LPS-induced proinflammatory responses, in association with increases in PSSG. Our results also suggest that Glrx1 may be required for the functional maturation/differentiation and activation of alveolar macrophages. In aggregate, these findings highlight the functional importance of the Grx1/PSSG redox module in the maturation and function of AMs and in the regulation of the NF-κB pathway, findings that hold clinical relevance and offer potential therapeutic opportunities.
This work was supported by National Institutes of Health grants RO1 HL60014 and NIH RO1 HL079331 (Y.M.W.J.-H.).
Originally Published in Press as DOI: 10.1165/rcmb.2009-0136OC on August 27, 2010
Author Disclosure: Y.M.W.J.-H. has a patent application related to the contents of this manuscript, and received three sponsored grants from the National Institutes of Health for more than $100,001, and one for $10,001–$50,000. S.W.A. does not have a financial relationship with a commercial entity that has an interest in the subject of this manuscript. I.K. does not have a financial relationship with a commercial entity that has an interest in the subject of this manuscript. V.A. does not have a financial relationship with a commercial entity that has an interest in the subject of this manuscript. J.N.R. does not have a financial relationship with a commercial entity that has an interest in the subject of this manuscript. Y.-S.H. does not have a financial relationship with a commercial entity that has an interest in the subject of this manuscript.
References
- 1.Reynaert NL, Ckless K, Wouters EF, van der Vliet A, Janssen-Heininger YM. Nitric oxide and redox signaling in allergic airway inflammation. Antioxid Redox Signal 2005;7:129–143. [DOI] [PubMed] [Google Scholar]
- 2.Rahman I, Biswas SK, Jimenez LA, Torres M, Forman HJ. Glutathione, stress responses, and redox signaling in lung inflammation. Antioxid Redox Signal 2005;7:42–59. [DOI] [PubMed] [Google Scholar]
- 3.Andreadis AA, Hazen SL, Comhair SA, Erzurum SC. Oxidative and nitrosative events in asthma. Free Radic Biol Med 2003;35:213–225. [DOI] [PubMed] [Google Scholar]
- 4.Cantin AM, North SL, Hubbard RC, Crystal RG. Normal alveolar epithelial lining fluid contains high levels of glutathione. J Appl Physiol 1987;63:152–157. [DOI] [PubMed] [Google Scholar]
- 5.Janssen-Heininger YM, Mossman BT, Heintz NH, Forman HJ, Kalyanaraman B, Finkel T, Stamler JS, Rhee SG, van der Vliet A. Redox-based regulation of signal transduction: principles, pitfalls, and promises. Free Radic Biol Med 2008;45:1–17. [DOI] [PMC free article] [PubMed] [Google Scholar]
- 6.Anathy V, Aesif SW, Guala AS, Havermans M, Reynaert NL, Ho YS, Budd RC, Janssen-Heininger YM. Redox amplification of apoptosis by caspase-dependent cleavage of glutaredoxin 1 and S-glutathionylation of Fas. J Cell Biol 2009;184:241–252. [DOI] [PMC free article] [PubMed] [Google Scholar]
- 7.Forman HJ, Fukuto JM, Torres M. Redox signaling: thiol chemistry defines which reactive oxygen and nitrogen species can act as second messengers. Am J Physiol Cell Physiol 2004;287:C246–C256. [DOI] [PubMed] [Google Scholar]
- 8.Lillig CH, Berndt C, Holmgren A. Glutaredoxin systems. Biochim Biophys Acta 2008;1780:1304–1317. [DOI] [PubMed] [Google Scholar]
- 9.Reynaert NL, van der Vliet A, Guala AS, McGovern T, Hristova M, Pantano C, Heintz NH, Heim J, Ho YS, Matthews DE, et al. Dynamic redox control of NF-kappaB through glutaredoxin-regulated S-glutathionylation of inhibitory kappaB kinase beta. Proc Natl Acad Sci USA 2006;103:13086–13091. [DOI] [PMC free article] [PubMed] [Google Scholar]
- 10.Pineda-Molina E, Klatt P, Vazquez J, Marina A, Garcia de Lacoba M, Perez-Sala D, Lamas S. Glutathionylation of the p50 subunit of NF-kappaB: a mechanism for redox-induced inhibition of DNA binding. Biochemistry 2001;40:14134–14142. [DOI] [PubMed] [Google Scholar]
- 11.Qanungo S, Starke DW, Pai HV, Mieyal JJ, Nieminen AL. Glutathione supplementation potentiates hypoxic apoptosis by S-glutathionylation of P65-NFkappaB. J Biol Chem 2007;282:18427–18436. [DOI] [PubMed] [Google Scholar]
- 12.Aesif SW, Anathy V, Brown AL, Ho YS, Janssen-Heininger YMW. Genetic ablation of glutaredoxin-1 alters lipopolysaccharide induced lung inflammation [abstracts]. Am J Respir Crit Care Med 2008;177:A79. [Google Scholar]
- 13.Aesif SW, Ho YS, Janssen-Heininger YM. Genetic ablation of glutaredoxin-1 alters morphology and impairs activation of mouse alveolar macrophages in response to lipopolysaccharide. Am J Respir Crit Care Med 2008;177:A623. [Google Scholar]
- 14.Ho YS, Xiong Y, Ho DS, Gao J, Chua BH, Pai H, Mieyal JJ. Targeted disruption of the glutaredoxin 1 gene does not sensitize adult mice to tissue injury induced by ischemia/reperfusion and hyperoxia. Free Radic Biol Med 2007;43:1299–1312. [DOI] [PMC free article] [PubMed] [Google Scholar]
- 15.Poynter ME, Irvin CG, Janssen-Heininger YM. A prominent role for airway epithelial NF-kappa B activation in lipopolysaccharide-induced airway inflammation. J Immunol 2003;170:6257–6265. [DOI] [PubMed] [Google Scholar]
- 16.Reynaert NL, Wouters EF, Janssen-Heininger YM. Modulation of glutaredoxin-1 expression in a mouse model of allergic airway disease. Am J Respir Cell Mol Biol 2007;36:147–151. [DOI] [PMC free article] [PubMed] [Google Scholar]
- 17.Aesif SW, Anathy V, Havermans M, Guala AS, Ckless K, Taatjes DJ, Janssen-Heininger YM. In situ analysis of protein S-glutathionylation in lung tissue using glutaredoxin-1–catalyzed cysteine derivatization. Am J Pathol 2009;175:36–45. [DOI] [PMC free article] [PubMed] [Google Scholar]
- 18.Rahman I, Kode A, Biswas SK. Assay for quantitative determination of glutathione and glutathione disulfide levels using enzymatic recycling method. Nat Protoc 2006;1:3159–3165. [DOI] [PubMed] [Google Scholar]
- 19.Granger DL, Taintor RR, Boockvar KS, Hibbs JB Jr. Measurement of nitrate and nitrite in biological samples using nitrate reductase and Griess reaction. Methods Enzymol 1996;268:142–151. [DOI] [PubMed] [Google Scholar]
- 20.Takashima Y, Hirota K, Nakamura H, Nakamura T, Akiyama K, Cheng FS, Maeda M, Yodoi J. Differential expression of glutaredoxin and thioredoxin during monocytic differentiation. Immunol Lett 1999;68:397–401. [DOI] [PubMed] [Google Scholar]
- 21.Bonfield TL, Raychaudhuri B, Malur A, Abraham S, Trapnell BC, Kavuru MS, Thomassen MJ. PU.1 regulation of human alveolar macrophage differentiation requires granulocyte–macrophage colony-stimulating factor. Am J Physiol Lung Cell Mol Physiol 2003;285:L1132–L1136. [DOI] [PubMed] [Google Scholar]
- 22.Adachi T, Weisbrod RM, Pimentel DR, Ying J, Sharov VS, Schoneich C, Cohen RA. S-glutathiolation by peroxynitrite activates SERCA during arterial relaxation by nitric oxide. Nat Med 2004;10:1200–1207. [DOI] [PubMed] [Google Scholar]
- 23.Clavreul N, Adachi T, Pimental DR, Ido Y, Schoneich C, Cohen RA. S-glutathiolation by peroxynitrite of P21Ras at cysteine-118 mediates its direct activation and downstream signaling in endothelial cells. FASEB J 2006;20:518–520. [DOI] [PubMed] [Google Scholar]
- 24.Greetham D, Vickerstaff J, Shenton D, Perrone GG, Dawes IW, Grant CM. Thioredoxins function as deglutathionylase enzymes in the yeast Saccharomyces cerevisiae. BMC Biochem 2010;11:3. [DOI] [PMC free article] [PubMed] [Google Scholar]
- 25.Reynaert NL, Ckless K, Guala AS, Wouters EF, van der Vliet A, Janssen-Heininger YM. In situ detection of S-glutathionylated proteins following glutaredoxin-1 catalyzed cysteine derivatization. Biochim Biophys Acta 2006;1760:380–387. [DOI] [PubMed] [Google Scholar]
- 26.Peltoniemi MJ, Rytila PH, Harju TH, Soini YM, Salmenkivi KM, Ruddock LW, Kinnula VL. Modulation of glutaredoxin in the lung and sputum of cigarette smokers and chronic obstructive pulmonary disease. Respir Res 2006;7:133. [DOI] [PMC free article] [PubMed] [Google Scholar]
- 27.Rubartelli A, Bajetto A, Allavena G, Wollman E, Sitia R. Secretion of thioredoxin by normal and neoplastic cells through a leaderless secretory pathway. J Biol Chem 1992;267:24161–24164. [PubMed] [Google Scholar]
- 28.Bertini R, Howard OM, Dong HF, Oppenheim JJ, Bizzarri C, Sergi R, Caselli G, Pagliei S, Romines B, Wilshire JA, et al. Thioredoxin, a redox enzyme released in infection and inflammation, is a unique chemoattractant for neutrophils, monocytes, and T cells. J Exp Med 1999;189:1783–1789. [DOI] [PMC free article] [PubMed] [Google Scholar]
- 29.Pekkari K, Holmgren A. Truncated thioredoxin: physiological functions and mechanism. Antioxid Redox Signal 2004;6:53–61. [DOI] [PubMed] [Google Scholar]
- 30.Schwertassek U, Balmer Y, Gutscher M, Weingarten L, Preuss M, Engelhard J, Winkler M, Dick TP. Selective redox regulation of cytokine receptor signaling by extracellular thioredoxin-1. EMBO J 2007;26:3086–3097. [DOI] [PMC free article] [PubMed] [Google Scholar]
- 31.Neumann M, Fries H, Scheicher C, Keikavoussi P, Kolb-Maurer A, Brocker E, Serfling E, Kampgen E. Differential expression of REL/NF-kappaB and octamer factors is a hallmark of the generation and maturation of dendritic cells. Blood 2000;95:277–285. [PubMed] [Google Scholar]
- 32.Platzer B, Jorgl A, Taschner S, Hocher B, Strobl H. RelB regulates human dendritic cell subset development by promoting monocyte intermediates. Blood 2004;104:3655–3663. [DOI] [PubMed] [Google Scholar]
- 33.Ammon C, Mondal K, Andreesen R, Krause SW. Differential expression of the transcription factor NF-kappaB during human mononuclear phagocyte differentiation to macrophages and dendritic cells. Biochem Biophys Res Commun 2000;268:99–105. [DOI] [PubMed] [Google Scholar]


