Abstract
One factor predisposing toward allergic responses is a maternal history of allergy. In a mouse model of maternal transmission of asthma risk, offspring of asthmatic, but not normal, mothers show increased allergic susceptibility, recreating epidemiologic observations in humans. Dendritic cells (DCs) capture and process antigens, and can skew immune responses toward a pro-allergic T helper 2 phenotype. Genome-wide analysis shows that neonates of allergic mothers are born with substantial changes in DNA methylation in their splenic CD11c+ DCs, findings observed without any contact with allergens. We demonstrate that these DCs from allergen-naive neonates born to asthmatic mothers, but not DCs from offspring of normal mothers, confer increased allergic susceptibility to multiple allergens when adoptively transferred into normal recipient mice, manifesting as increased airway responsiveness and allergic inflammation. Other immune splenocytes, including macrophages and CD4+ T cells, did not transfer the effect. The “asthma-susceptible” DCs also show enhanced allergen-presentation activity in vitro. Our findings suggest that maternal allergy results in an altered epigenetic profile in neonatal DCs that is independent of encounters with allergens and is linked to pro-allergic function.
Keywords: dendritic cells, allergy, asthma, epigenetics, DNA methylation
CLINICAL RELEVANCE.
In neonates born to asthmatic mothers, dendritic cells have broadly increased DNA methylation from birth, even though these neonates are genetically and environmentally identical to control subjects and were not exposed to any allergen. These epigenetic changes are associated with a functional capacity to mediate asthma susceptibility, as evidenced by in vitro tests showing an increased ability to present allergen, as well as from in vivo adoptive transfer experiments. The findings may lead to uncovering a previously unrecognized cause of allergy.
Asthma has origins in early life (1–4). Maternal allergic asthma significantly increases the risk of developing the disease during childhood (5–8). This “maternal effect” suggests that prenatal events can dramatically influence early susceptibility to allergic airway disease (9), an idea supported by findings in a mouse model we developed to study the early-life origins of allergy. In our model, newborns of allergic or control mothers are genetically identical and are housed in uniform conditions, yet only those born to asthmatic mothers easily develop allergy to multiple allergens (10, 11). Specifically, newborns from ovalbumin (OVA)-allergic mothers develop airway hyperresponsiveness (AHR), allergic airway inflammation (AI), and features of T helper 2 (Th2) polarization in a low-dose sensitization protocol with OVA or casein (CAS), an unrelated allergen. In contrast, the same protocol has minimal effects on newborns from normal mothers.
Although the factors responsible for the maternal effect remain unknown, we hypothesized that it may be mediated through epigenetic mechanisms. Epigenetic changes, specifically abnormalities in DNA methylation, were shown to contribute to the severity of allergic response in mice (12) and humans (13). We postulated that developing immune cells may experience alterations in DNA methylation patterns that result in enhanced pro-allergic responses. One goal of this study was to identify which neonatal cells mediate the pro-allergic skew, and we focused on the neonatal dendritic cell (DC).
The rationale for the choice of DCs was based on our earlier findings that increased offspring susceptibility can be prevented or reverted by cytosine-phosphate-guanosine (CpG) oligonucleotides (11), providing a clue that the key cell to consider would be responsive to CpG modulation. This agent acts primarily on the antigen-presenting cells (APCs) that are the first immune cells to encounter and process allergen DCs and macrophages (14). Interactions of DCs and T-helper lymphocytes are thought to lie at the core of asthma pathogenesis (15), and immune system skewing toward a Th2 phenotype is attributed to DCs (16).
Hence, we hypothesized that maternal allergy leads to epigentic alterations in the DCs of developing neonates. We further postulated that these cells are altered from birth to be allergy-polarizing, independent of sensitization and allergen exposure. In this study, we performed epigenomic, genomic, and phenotypic analyses of splenic DCs purified from asthma-susceptible neonates, and tested the effects of adoptive transfer of these and other cells on allergic susceptibility.
MATERIALS AND METHODS
Study Design
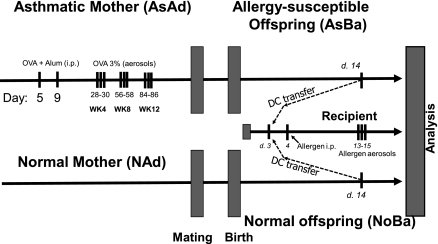
This study used the protocol summarized in Figure 1, based on a previous report (10). Briefly, maternal sensitization is achieved by initial intraperitoneal injections of 5 μg OVA with 1 mg alum in 0.1 ml PBS into mice at 3 and 7 days of age (Figure 1 provides a schematic of the protocol). After weaning, female mice are exposed to aerosols of allergen (3% [wt/vol] OVA, grade V; Sigma-Aldrich, St. Louis, MO) in PBS (pH 7.4) for 10 minutes on 3 consecutive days at 4, 8, and 12 weeks of age, and then mated with normal male mice. The aerosol exposure is performed within individual compartments of a mouse pie chamber (Braintree Scientific, Braintree, MA), using a Pari IS2 nebulizer (Sun Medical Supply, Kansas City, KS) connected to an air compressor (PulmoAID; DeVilbiss, Somerset, PA). These female mice consistently exhibit strongly increased AHR and AI (10, 11).
Figure 1.
Schematic of experimental protocols. Female future mother mice received two intraperitoneal (i.p.) injections of ovalbumin (OVA) with alum on Days 5 and 9 of life, followed by three repeated OVA aerosol challenges (3% vol/vol, 10 minutes). Splenic CD11c+ dendritic cells (DC) (or in a control experiment, other splenic immunocytes) were obtained either from these mother mice or from their neonates when 14 days old. All recipients of adoptively transferred cells were subjected to intentionally “suboptimal” sensitization and challenge protocol with only one injection of OVA with alum (or in some cases, of the unrelated allergen casein [CAS]) on Day 4. After three challenges with the allergen, animals were analyzed for airway responsiveness via whole-body plethysmography, and for allergic inflammation via bronchoalveolar lavage (BAL) and histology.
Typically, to confirm a maternal transmission effect, offspring of allergic and control PBS-challenged mice are subjected to a “suboptimal” protocol. On Day 4 after birth, newborns receive a single intraperitoneal injection of OVA with alum (an intentionally suboptimal dose that normally does not result in significant AHR and AI in offspring of normal intact or PBS-challenged mothers). On Days 13–15 of life, these baby mice are exposed to aerosolized OVA, as already described. In this report, only the “quality-assurance” neonates were subjected to this testing. The donors of immune cells were left entirely allergen-naive. Neonatal DCs were harvested on Day 14 for genomic and phenotypic profiling.
We also studied adoptive transfer effects in vivo and APC activity in vitro, using DCs from adult mice (5–6 weeks old) and 14-day-old neonates. All groups contained susceptible (“asthmatic”) mice and normal control mice. Strongly positive, double-sensitized adult asthmatics were designated “AsAd.” Adult, age-matched, normal control mice were designated “NAd.” The groups of 14-day-old neonates were designated “AsBa14” and “NoBa14,” respectively. In adoptive transfer experiments, the recipient normal newborns were designated as cell donors, e.g., “Rcp:AsAd” refers to a normal recipient of DCs from strongly asthmatic adult donors, and “Rcp:AsBa14” designates a normal newborn mouse receiving DCs from allergen-naive 14-day-old neonates of strongly asthmatic mothers.
We obtained BALB/C mice from Charles River Laboratories (Cambridge, MA). Animal care complied with the Guide for the Care and Use of Laboratory Animals by the National Institutes of Health, and all experiments were approved by our Institutional Review Board.
Cell Purification and Adoptive Transfer
Splenic DCs were prepared from collagenase D-treated (Roche, Indianapolis, IN) sterile cell suspensions, using positive selection (i.e., retention of CD11c+ cells) via the MACS Magnetic Bead System (Miltenyi Biotec, Auburn, CA). Purity was routinely monitored via flow cytometry (FACSCanto II; Becton-Dickinson, Franklin Lakes, NJ) by labeling for clusters of differentiation CD11c and MHC-II. More than 95% of purified cells were double-positive for these antigens, and viability reached >93% according to propidium iodide or trypan blue staining. After purification, cells were washed twice in lipopolysaccharide (LPS) LPS-free sterile PBS with 5% BSA, and once in pure, ice-cold, LPS-free sterile PBS (transfer buffer). Cells were resuspended in transfer buffer at adjusted concentrations of 2.0 × 10⁶/ml for neonatal DCs, and 2.5 × 10⁶/ml for adult DCs. These suspensions were immediately injected into recipient mice at 0.1 ml intraperitoneally. Thus, newborn donors received 2.0 × 10⁵ live DCs, and adult donors received 2.5 × 10⁵ live DCs.
In a control experiment, we adoptively transferred DC-depleted flow-through fraction cells as well as purified splenic macrophages and T cells that were similarly isolated from splenocyte suspensions, using CD11b-positive or CD4-positive selection, respectively. We used 2.0 × 10⁵ live nucleated cells for the flow-through suspension, 1.0 × 10⁶ for macrophages, and 0.5 × 10⁶ for CD4 T cells per recipient.
Flow Cytometry
Flow cytometric analysis was performed using a FACSCanto II (Becton-Dickinson) flow cytometer with a dedicated data acquisition system and software for analysis. Labeling was performed at 4°C for 40 minutes, in the presence of 20% normal mouse serum to block nonspecific binding. Concentrations of labeling antibody depended on the manufacturer's instructions (Miltenyi Biotec, or eBioscience, San Diego, CA). The specificity of labeling was verified using isotype controls.
Pulmonary Function Testing
The airway responsiveness of mice to increasing concentrations of aerosolized methacholine was measured using whole-body plethysmography (Buxco, Sharon, CT). Briefly, each mouse is placed in a chamber, and continuous measurements of box pressure/time wave are calculated via a connected transducer and associated computer data acquisition system. The main indicator of airflow obstruction, enhanced pause (Penh), which shows a strong correlation with airway resistance as examined by standard evaluation methods, is calculated from the box waveform (17). After measurement of baseline Penh, aerosolized PBS or methacholine (MCh, acetyl-methylcholine chloride; Sigma-Aldrich, St. Louis, MO) in increasing concentrations (6, 12, 25, 50, and 100 mg/ml) is nebulized through an inlet of the chamber for 1 minute, and Penh measurements are taken for 9 minutes after each dose. Penh values for the first 2 minutes and last 2 minutes after each nebulization are discarded, and values for the 5 minutes in between are averaged and used to compare results.
Pathologic Analysis
After physiologic testing in airway-sensitized mice or post–allergen-challenged mice, the animals were killed with sodium pentobarbital (Veterinary Laboratories, Lenexa, KS) and bronchoalveolar lavage (BAL) was performed, with cell numbers and yield analyzed as previously described (11). The lungs were instilled with 10% buffered formalin, and processed for microscopy. Allergic inflammation was quantified by scoring the inflammatory cell infiltrates around airways and vessels, using a previously described index of severity and extent (11), with a maximum possible score of 9.
Cytokine Detection
Cytokine levels were measured in cell culture supernatants, and BAL fluid was measured using murine IL-4 and IL-13 ELISA kits from eBioscience. Sensitivity reached 4 pg/ml for IL-4, and 30 pg/ml for IL-13. All samples were tested in duplicate.
In Vitro Proliferation Studies
Purified splenic DCs were co-cultured in quadruplicate in RPMI complemented with 5% FCS, L-glutamine, penicillin, and streptomycin in 96-well tissue culture treated plates (Nunc, Rochester, NY) at 0.5 × 10⁵/well, or at 2.5 × 10⁵/well of responder CD4+ KJ1-26+ OVA-specific T helpers purified from the spleens of DO11.10 transgenic mice. Antigen stimulation was achieved by adding tissue culture–grade OVA (Sigma) at 100 μg/ml. Cells were cultured for 72 hours at 37°C in a 5% CO2 incubator. For the last 18 hours, co-cultures were pulsed with 1 μCi/well of tritiated [3H+] thymidine (Sigma). After culturing, supernatants were collected for cytokine analysis from unlabeled duplicate wells, and cells from each labeled well were harvested onto glass fiber pads (Cambridge Technology, Inc., Watertown, MA), using the semi-automated PHD Cell Harvester (Cambridge Technology, Inc., Cambridge, MA). Negative controls included background (scintillation fluid only, <100 counts per minute [CPMs]), unstimulated OVA-negative co-cultures (always lower than 5,000 CPMs), and T-helper responder cells only (no DCs) stimulated with OVA (always lower than 7,000 CPMs, or 0.05 normalized value). Data for negative controls are not shown.
Genome-Wide Measurements
Gene-expression profiling was performed using the Illumina BeadStation 500G platform, available at Channing Laboratory (Harvard Medical School, Boston, MA). The Illumina MouseWG-6 BeadChip (Illumina, San Diego, CA) that we used contains six arrays of 48,318 50-mer oligonucleotide probes. In addition, for platform-independent analysis, we analyzed similar RNA samples, using the Affymetrix Mouse Genome 430A 2.0 Array (Affymetrix, Santa Clara, CA). Hybridization and analysis were performed at the core facility of the Dana Farber Cancer Institute at Harvard Medical School. We tested seven samples per group for the Illumina platform, and four samples per group for the Affymetrix platform.
Epigenome-wide DNA methylation scanning was performed by Switchgear Genomics (Menlo Park, CA). This method exploits sensitivity to restriction endonucleases conferred by the absence of methylation on cytosine residues. A cocktail of methylation-sensitive nucleases (with 99.9% efficiency and specificity for unmethylated DNA) is used to digest half of each genomic DNA sample, before differential fluorescent labeling (Cy3 green for the treated sample; Cy5 red for the untreated sample). Competitive hybridization is performed on tiled arrays that cover the human genome, resulting in changes in the ratio of fluorescence, depending on methylation-driven nuclease sensitivity (decreased methylation leads to increased binding of red-labeled fragments). The competitive hybridization uses a 400,000 oligo probe array that measures methylation status at approximately 42,000 unique regions in the mouse genome; 92% of approximately 22,000 predicted CpG islands are covered, and 20,000 additional CpG-rich regions that are not annotated as CpG islands are also covered. The array includes 1,000 negative control regions (without CpGs) to build an error model for analysis.
Statistical Analysis
Data are presented as means ± SEMs. Data analysis was performed using three software packages: Microsoft Excel from Microsoft Office 2003 Pro (Microsoft Corp., Seattle, WA) for spreadsheet work, GraphPad Prism version 4.0 for Windows (GraphPad Software, San Diego, CA) for graph construction and some ANOVA post hoc tests, and Statistica 6 for Windows (StatSoft, Tulsa, OK) for analyzing the significance of differences. Statistical significance was accepted when P < 0.05. To estimate the significance of differences between groups in multiple comparisons, ANOVA with Tukey's honest significant differences for unequal N post hoc test and the Student-Newman-Keuls post hoc test were used as appropriate, and as permitted by normality (i.e., a visual histogram check). For distributions different from normality, nonparametric Kruskal-Wallis ANOVA was used with Dunn's post hoc test. For pairwise comparisons, the nonparametric Mann-Whitney U test was used. For the proliferation assay, data minimum–maximum normalization at a range of 0–1 was used on CPM counts. For repeated measurements in the plethysmography procedure, repeated-measures ANOVA was used. For genome-wide expression, we used the following analytic strategy. The purpose of low-level and high-level processing was to define differential expression between the two groups in microarray data sets. For Affymetrix chips, a data matrix of average fluorescence intensities was first loaded in dChip and values were filtered, normalized, background-adjusted, and log2-transformed. Chip scans were evaluated for potential bias. In parallel, the alternative approach to extracting normalized RMA values was also used (RMA Express; Ben Bolstad, University of California, Berkeley). For Illumina arrays, the facility used proprietary Illumina software for low-level processing. Processed outputs from both platforms were assembled into annotated matrices, and loaded into the TM4 Microarray Software Suite (TIGR MeV version 4.1; Dana-Farber Cancer Institute, Boston, MA).
Initially, data were subjected to hierarchical clustering with support tree analysis with bootstrapping (i.e., resampling with replacement). This procedure helps test the relationship of samples in the matrix, and identify potential bias. If bias was identified, the data were refiltered, and samples were investigated for possible exclusion.
For epigenomic data, the Switchgear Genomics Company provides a normalized data matrix containing z-scores. Data transformation was performed as follows. The log2 ratio (untreated cy5/treated cy3) was calculated for each probe. The sample treatment decreases the signal from unmethylated DNA, but does not change the signal from methylated DNA. Therefore, a large ratio means the target is unmethylated in the sample, whereas a log2 ratio of 0 means the target is methylated. The median log2 ratio of the negative control probes was subtracted from the experimental and control ratios to center the data. The data were then smoothed by averaging across a sliding window of three neighboring probes, shifting one probe at a time. This process helps minimize the noise from single probes. The negative control probes (designed for regions that are not affected by the treatment) serve as a background distribution to assign a confidence limit to each experimental probe. The mean and SD were calculated from the negative control probes for each sample. These statistical measures were then used to calculate a z-score for each experimental probe within that experiment. The z-score was calculated as [(exp log2 ratio) − (mean log2 ratio of negatives)]/(SD log2 ratio of negatives). This statistical measure takes into account and normalizes for the variation in each individual sample, thus making comparisons between samples more reliable. Each z-score measure is the number of SD units from the mean of the negative control distribution. Based on the area under the curve of a standard distribution, a z-score of 1.6 means a 95% chance exists that the measurement lies outside of the negative control distribution, and is therefore unmethylated.
Expression or methylation data values from experimental groups were further compared in the TM4 package via several high-level methods, including significance analysis for microarrays (SAM) and/or ANOVA. SAM is initially performed at a false discovery rate of 0% for maximum stringency; P value stringency for ANOVA-based comparisons will include several levels (e.g., 0.05, 0.01, and 0.005), depending on the size of the output list of sites and the desired flexibility of downstream functional enrichment analysis. In addition, cluster analysis (hierarchical clustering) was performed to identify interrelated traits of expression or methylation changes across groups.
Entire outputs and the raw data of DNA methylation arrays are available at the National Center for Biotechnology Information Gene Expression Omnibus database (record number GSE13380), which includes information on ∼ 450,000 50-mer probes. This is the first submission of such genome-wide methylation data, to our knowledge.
RESULTS
Genome-Wide DNA Methylation Screening Reveals Substantial Epigenomic Differences in Asthma-Susceptible Neonatal DCs, Even in the Absence of Allergen Sensitization
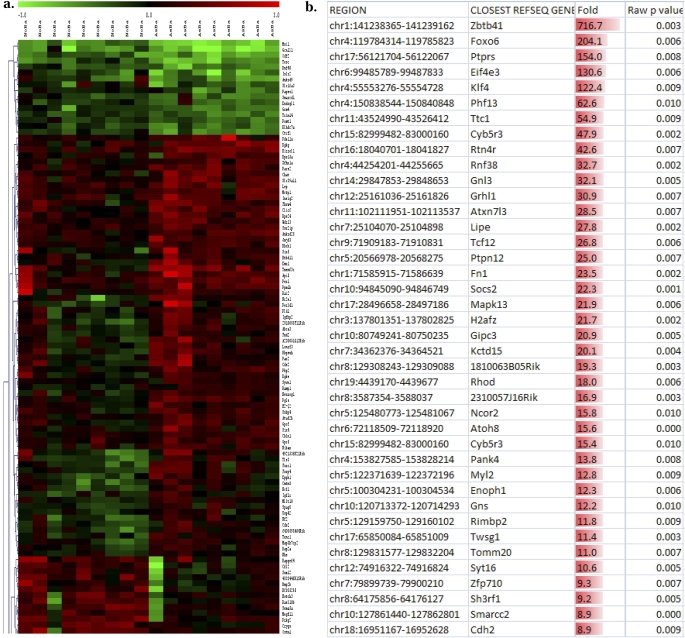
Genomic DNA from the DCs of allergen-naive 14-day-old (p14) neonates (Figure 1) born to asthmatic mothers versus control mothers showed remarkable differences in the degree of methylation at a number of CpG sites throughout the genome, including both annotated CpG islands and other locations. These findings are illustrated in Figure 2a, which shows a subset of a larger hierarchical clustering dataset, presented as a heat map comparing the methylation status of DC DNA from p14 neonates born to asthmatic mothers with their control counterparts. Figure 2b illustrates the fold difference in normalized fluorescence of the top 40 differentially methylated sites.
Figure 2.
Genome-wide DNA methylation scanning reveals multiple significant changes in asthma-susceptible neonatal DCs, even in the absence of allergen encounter or other stimulation. (a) Cropped subset of hierarchical cluster analysis. (b) Fold changes in top 40 differentially methylated sites. (c) Relative hypermethylation in the asthma-susceptible group, compared with the demethylated state of normal control cells. Normalized probe values that were significantly different between the two groups were tested against the cutoff value for being “demethylated” (1.6). Bars represent the overall number of interrogated sites with z-score values above this cutoff. Depending on the stringency of the initial comparison (significant P value), the list of sites included in this analysis may be smaller (“higher stringency,” P < 0.005; left) or larger (“lower stringency,” P < 0.05; right). (d) This finding is also true for the methylation level of cytosine-phosphate-guanosine sites in each of 18 samples on average; n = 9 per group, using animals from two separate cohorts.
We next evaluated the overall level of methylation or demethylation, using sites identified as significantly different between the two groups. This list can be larger or smaller, depending on the stringency of statistic criteria (e.g., a P value cutoff of 0.05 versus 0.005). However, independent of stringency, we found an overall higher level of methylation in the DCs of asthma-susceptible neonates compared with control mice (which were more demethylated; Figure 2c). As shown in Figure 2d, each sample in the “asthma-susceptible” group had a higher level of methylation. Concordantly, the overall number of demethylated sites in all nine samples was higher in the normal group (not shown).
Genotype and Phenotype Profiling
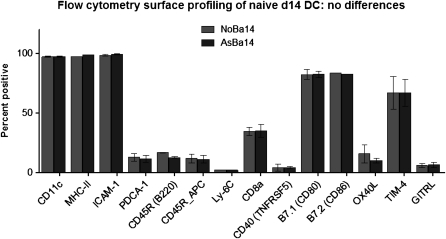
To determine if the observed differences in genomic DNA methylation are linked to altered gene-expression profiles, we performed microarray analyses of total cell RNA isolated from asthma-susceptible or control DCs (purified as for DNA methylation analyses). Repeated trials using two different platforms (Illumina and Affymetrix) did not reveal any substantial or reproducible changes (data not shown). We also evaluated the surface expression of MHC-II and relevant costimulatory molecules and subpopulation markers in DCs from the two groups. We found no significant differences in the surface expression of these markers. For both NoBa and AsBa, the CD11c+ cells were ∼ 95% positive for MHC-II, 83% positive for CD86, and 25% positive for CD8a. A summary of these data is presented in Figure 3.
Figure 3.
Phenotypic profiling of isolated DCs by flow cytometry. Cells were gated to exclude debris. Average percent positive from at least three separate experiments is indicated (means ± SEMs; n = 9 per group).
Functional Testing of DCs In Vitro
To compare the antigen presentation activity of DCs from asthma-susceptible and normal donors, we measured their ability to promote the proliferation of CD4+ T cells with a constitutive OVA-specific T-cell receptor (TCR) (from spleens of transgenic DO11.10 strain mice) in vitro in the presence of OVA.
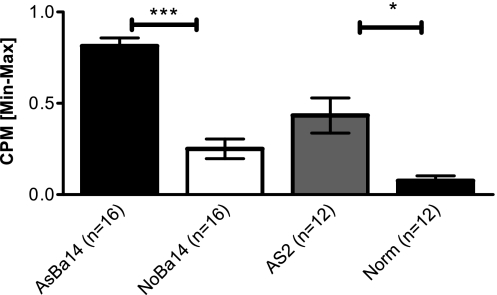
We found that DCs from 14-day-old allergen-naive neonates of asthmatic mothers (AsBa14) exhibited higher antigen presentation activity than DCs from normal 14-day-old neonates (NoBa14), a pattern similar to that of DCs from adult spleens (AsAd versus NAd) (Figure 4). Technical negative controls included wells with DCs only, with T cells only, with DC T cells with no OVA, and background controls. All negative controls remained reliably low throughout all experiments (not shown). IL-4 production in the supernatants of these co-cultures correlated with CPM counts (not shown). These findings suggest that the “asthma-susceptible” DCs would possess prominent pro-allergic capabilities in vivo, despite the absence of distinct gene expression or surface phenotype at rest.
Figure 4.
Increased antigen-presenting cell (APC) function in asthma-susceptible DCs. Splenic CD11c+ DCs were purified from neonatal donor groups, as well as from adult control animals. Adult asthmatic females that received two injections of OVA and repeated OVA aerosol challenges (AsAd) and normal control females (NAd) were used as positive and negative controls, respectively. DCs from 14-day-old allergen-naive offspring (AsBa14 and NoBa14) constitute the main study groups, and were incubated with OVA and responding DO11.10 T cells. The resulting proliferation of responder DO11.10 T cells was measured using [3H]thymidine incorporation as counts per minute (CPM) and normalized to a range of 0–1 via minimum–maximum normalization to assure cross-experiment comparability. Normalized CPM counts indicate that DCs from adult asthmatics (AsAd) had increased antigen-presentation activity to T cells compared with those from normal adult controls (Norm; P < 0.01). Remarkably, DCs from 14-day-old allergen-naive neonates born to asthmatic mothers (AsBa14) showed increased APC activity compared with 14-day-old neonates of normal mothers (NoBa14). At least three animals per group were used; data are representative of four separate experiments. *P < 0.05. ***P < 0.005.
Adoptive Transfer of Neonatal Allergen-Naive DCs Induces Increased Allergic Susceptibility In Vivo
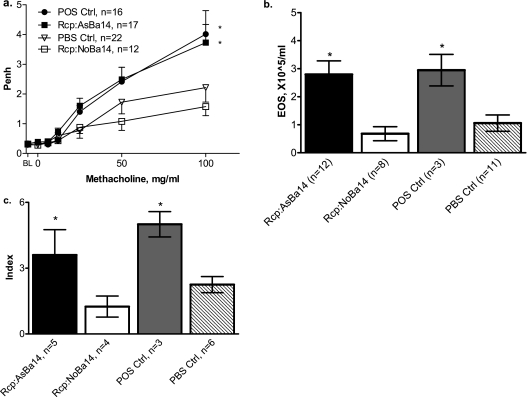
To investigate the potential functional consequences of the altered epigenomic status of asthma-susceptible DCs, we performed an adoptive transfer (isogenic transplantation) of DCs from allergen-naive offspring born to asthmatic mothers into normal neonates (DC transfer protocol; Figure 1). The result was an increased allergic susceptibility in recipients. After the suboptimal OVA sensitization and challenge protocol, newborn recipients of splenic DCs from p14 allergen-naive neonates born to asthmatic mothers (Rcp:AsBa14) had significantly increased airway responsiveness (Figure 5a). For example, after challenge with aerosolized methacholine (100 mg/ml), levels of responses were twice as high as those in control recipients of “normal” DCs (Rcp:NoBa14). After the same suboptimal sensitization and challenge, the Penh response in these control recipients was indistinguishable from that in negative control mice that received vehicle injection only, indicating that the adoptive transfer of DCs from normal animals did not exert any effect. AIs in the Rcp:AsBa14 group were also significantly increased, as evidenced by eosinophilia in the BAL counts (Figure 5b). Lung histopathology revealed significant inflammatory lung infiltration in the Rcp:AsBa14 group but not in the Rcp:NoBa14 group (Figure 5c). Similar results were obtained when transferring DCs from 7-day-old donors (data not shown because of space constraints). Levels of BAL IL-13 tended to be elevated in recipients of AsBa14 DCs, and were significantly elevated in recipients of “pro-allergic” DCs from 7-day-old donors and adult allergic DCs, a finding which is also consistent with Th-2 polarization (not shown).
Figure 5.
Adoptive transfer of DCs from allergen-naive neonates. Splenic CD11c+ DCs were transferred from 14-day-old allergen-naive neonates born to asthmatic mothers (see protocol in Figure 1) into recipient 3-day-old normal mice (group Rcp:AsBa14). Control recipients were injected with splenic DCs from neonates born to normal females (Rcp:NoBa14) or with PBS alone (PBS Ctrl). All recipients were subjected to an intentionally “suboptimal” protocol, with only one injection of OVA on Day 4 of life. Positive controls received a second OVA injection on Day 9 (POS Ctrl). After aerosol challenges with OVA, pups were analyzed for AHR and AI. Findings indicate (a) increased airway responsiveness in Rcp:AsBa14 compared with Rcp:NoBa14, (b) increased BAL eosinophilia in Rcp:AsBa14 compared with Rcp:NoBa14, and (c) an increased pulmonary inflammation score in Rcp:AsBa14, which was minimal in Rcp:NoBa14. *P < 0.05.
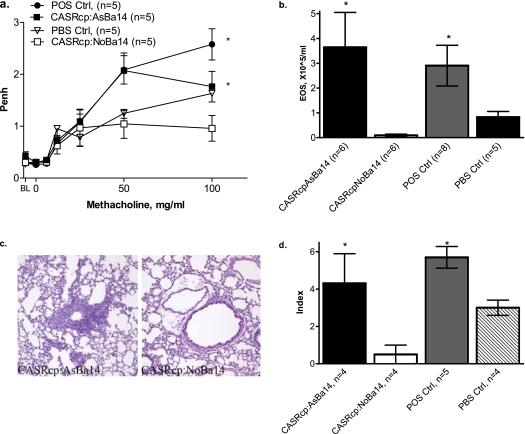
To determine whether the effect of adoptively transferred DCs is specific for the OVA allergen used for maternal sensitization, we tested the susceptibility of recipient neonates to a different allergen. After an adoptive transfer of splenic DCs from OVA-sensitized and challenged females and their allergen-naive offspring to recipient neonates, we performed suboptimal sensitization and challenge with an unrelated allergen (CAS). The recipients of allergen-naive DCs from neonates born to asthmatic mothers (CASRcp:AsBa14; Figure 6) also revealed significantly increased airway responsiveness, eosinophilic inflammation, and pulmonary infiltration, compared with respective controls.
Figure 6.
Adoptive transfer of DCs from 14-day-old allergen-naive neonates of OVA-sensitized mothers and asthma susceptibility to a different allergen (CAS). Splenic DCs were purified from 14-day-old allergen-naive neonates born to asthmatic OVA-sensitized and challenged mothers, and injected into recipient 3-day-old normal mice (group CASRcp:AsBa14). Control recipients were injected with splenic DCs from neonates born to normal females (CASRcp:NoBa14) or with PBS alone (PBS Ctrl). All recipients were subjected to an intentionally “suboptimal” protocol, with only one injection of CAS + alum (and not OVA) on Day 4 of life. Positive controls received a second CAS injection on Day 9 (POS Ctrl). After aerosol challenges with CAS, pups were analyzed for AHR and AI, as previously described. (a) Higher enhanced pause (Penh) in response to methacholine indicates increased AHR, and is seen in recipients of DCs from asthmatic donors (CASRcp:AsBa14), as well as in positive controls (POS Ctrl), but not in recipients of DCs from normal pups (CASRcp:NoBa14) or vehicle alone (PBS Ctrl) * (P < 0.01). (b) Eosinophil counts in BAL were significantly increased in recipients of DCs from donors born to asthmatic (CASRcp:AsBa14) but not normal control females (CASRcp:NoBa14) (*P < 0.05). (c and d) Increased pulmonary inflammation was evident in recipients of DCs from donors born to asthmatic mothers (CASRcp:AsBa7) and in positive controls, but only to a minimal extent in recipients of DCs born to normal control females (CASRcp:NoBa7) and in vehicle controls (*P < 0.05). Staining was performed with hematoxylin-eosin. Original magnification, ×200.
Other Splenic Cell Types from Allergen-Naive Neonates Do Not Induce Increased Allergic Susceptibility in Recipients
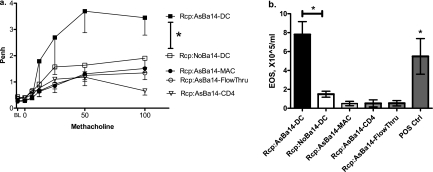
To test whether the adoptive transfer of allergic susceptibility can be specifically attributed to DCs and not to other cell types, we tested two possible candidate cell types: macrophages and T-helper cells in the adoptive transfer protocol. Considering that macrophages are less active antigen presenters, we transferred five times more macrophages than DCs. We also transferred increased amounts of CD4 T cells. Moreover, to ensure that other contaminating cells types that may have been present in the isolated DC samples were not responsible for the effect, we transferred the DC-depleted effluent cells. All cell types were obtained from the same splenocyte suspensions. As before, neonates were born to mothers allergic to OVA. In this experiment, recipients were sensitized to and challenged with CAS.
As indicated in Figure 7, none of the non-DC cells induced increased allergic susceptibility in recipients, whereas the effect of DCs remained reproducible. Both AHR (Figure 7a) and AI (Figure 7b) remained minimal in the recipients of CD11b+ macrophages, CD4+ T cells, and CD11c− DC-depleted cells from neonates of asthmatic mothers, with values similar to those in control recipients of the same cells from offspring of normal mothers.
Figure 7.
Adoptive transfer of DC and non-DC splenic cells from Day 14 allergen-naive neonates of OVA-sensitized mothers with CAS challenge of recipients. CD11c+ DCs, CD11b+ macrophages, and CD4+ T cells, as well as DC-depleted splenocytes from offspring of asthmatic (DC, Mac, CD4, and FlowThru, respectively) and normal mothers (not shown except for normal DC control), were transferred to recipients later sensitized to and challenged with CAS. Both airway responsiveness (a) and inflammation (b) remained minimal in recipients of CD11b+ macrophages, CD4+ T cells, and CD11c-depleted cells from neonates of asthmatic mothers. Values were similar to those obtained from respective control recipients of the same cells from offspring of normal mothers (not shown). At the same time, the effect of DCs remained reproducible, as indicated by increased airway responsiveness and inflammation in the As-DC group (n = 6 per group, *P < 0.05).
These two sets of experiments indicate that CD11c+ DCs in neonates born to asthmatic mothers have unique Th2-skewing capacity from birth, independent of whether a newborn was sensitized to allergen.
DISCUSSION
Allergen-naive offspring of asthmatic mothers contain splenic CD11c+ DCs that have altered DNA methylation profiles (Figure 2) that are evident in resting cells without gene-expression or phenotypic differences. These DCs with an altered epigenome are capable from birth of polarizing immunity toward a Th2 “allergic” phenotype (Figures 5 and 6). This finding provides new evidence for the prenatal epigenetic programming of asthma susceptibility in neonatal DCs as a factor in the maternal transmission of asthma risk. The abnormal global increase in methylation in asthma-susceptible neonatal DCs is a novel finding, and is in accordance with the report by Hollingsworth and colleagues (12). That report did not study susceptibility to asthma initiation per se, but found that the severity of allergic airway disease induced in a standard protocol is associated with the excessive methylation of multiple genes in lung tissue. In humans, increased methylation (e.g., through folate supplementation) is also linked to childhood wheezing (13).
Although we did not perform exhaustive phenotypic profiling, these data are in agreement with genome-wide expression profiling, and suggest that in the absence of allergens or other stimulation, neither genotypic nor phenotypic differences exist in the DCs from the two groups. Hence the observed epigenetic changes may serve to program DCs for an altered functional phenotype during an immune response.
Our genome-wide analysis of DNA methylation provides a large list of altered sites for further investigation, but two important limitations merit discussion. To determine which specific genes are altered in a functionally important manner is of great interest, with resulting changes in transcription upon activation of DCs. However, given the absence of methodologies to change the methylation status of particular loci experimentally, testing of a causal role for any specific methylation site is not possible, because either reduced methylation (e.g., via DNA methyl transferase inhibitors) or increased methylation (e.g., via folate supplementation) alters myriad sites. This precludes a conventional reductionist approach. Moreover, the in vivo use of methylation inhibitors or methyl donors to modulate DNA methylation in pregnant mice is problematic, because it will likely interfere with normal gestation and development. These approaches are more feasible for experimental manipulations of neonatal DCs in vitro, and may provide further insights.
Importantly, our usage of “asthma” refers to a mouse model of allergic airway disease, which is not entirely identical to human asthma. We also recognize the limitations of Penh as a measure of AHR (18). However, an analysis of responses to aerosolized OVA in sensitized BALB/c mice (i.e., as in our model) is the experimental setting in which Penh values correlate best and to an (arguably) acceptable degree with more invasive measures (17, 20–23). In addition, more invasive testing is technically impractical, given the small size of young mice in our model. Finally, in an earlier study, we found similar trends in Penh and basal pulmonary function tests, using the invasive Flexivent (Chandler, AZ) approach in older, larger mice in a similar protocol (11).
We conclude that in neonates born to asthmatic mothers, DCs have broadly increased DNA methylation from birth, even though these neonates are genetically and environmentally identical to control mice, and are not exposed to any allergen. These epigenetic changes are associated with a functional capacity to mediate asthma susceptibility, as evidenced by in vitro tests showing an increased ability to present allergen, as well as by in vivo adoptive transfer experiments.
This work was supported by National Institutes of Health grants ES 00.002 and ES 017.588.
Originally Published in Press as DOI: 10.1165/rcmb.2009-0400OC on January 29, 2010
Author Disclosure: A.V.F. received a sponsored grant from the National Institutes of Health for $50,001–$100,000. L.K. received a sponsored grant from the National Institutes of Health for more than $100,001.
References
- 1.Gern JE, Lemanske RF, Busse WW. Early life origins in asthma. J Clin Invest 1999;104:837–843. [DOI] [PMC free article] [PubMed] [Google Scholar]
- 2.Holt PG, Jones CA. The development of the immune system during pregnancy and early life. Allergy 2000;55:688–697. [DOI] [PubMed] [Google Scholar]
- 3.Wright AL. The epidemiology of the atopic child: who is at risk for what? J Allergy Clin Immunol 2004;113:S2–S7. [DOI] [PubMed] [Google Scholar]
- 4.Vance GHS, Holloway JA. Early life exposure to dietary and inhalant allergens. Pediatr Allergy Immunol 2002;13:14–18. [DOI] [PubMed] [Google Scholar]
- 5.Ruiz RG, Kemeny DM, Price JF. Higher risk of infantile atopic dermatitis from maternal atopy than from paternal atopy. Clin Exp Allergy 1992;22:762–766. [DOI] [PubMed] [Google Scholar]
- 6.Litonjua A, Carey V, Burge H, Weiss S, Gold D. Parental history and the risk of childhood asthma: does mother confer more risk than father? Am J Respir Crit Care Med 1998;158:176–181. [DOI] [PubMed] [Google Scholar]
- 7.Illi S, von Mutius E, Lau S, Nickel R, Niggemann B, Sommerfeld C, Wahn U, Multicenter Allergy Study Group. The pattern of atopic sensitization is associated with the development of asthma in childhood. J Allergy Clin Immunol 2001;108:709–714. [DOI] [PubMed] [Google Scholar]
- 8.Liu CA, Wang CL, Chuang H, Ou CY, Hsu TY, Yang KD. Prenatal prediction of infant atopy by maternal but not paternal total IgE levels. J Allergy Clin Immunol 2003;112:899–904. [DOI] [PubMed] [Google Scholar]
- 9.Prescott SL. Maternal allergen exposure as a risk factor for childhood asthma. Curr Allergy Asthma Rep 2006;6:75–80. [DOI] [PubMed] [Google Scholar]
- 10.Hamada K, Suzaki Y, Goldman A, Ning YY, Goldsmith C, Palecanda A, Coull B, Hubeau C, Kobzik L. Allergen-independent maternal transmission of asthma susceptibility. J Immunol 2003;170:1683–1689. [DOI] [PubMed] [Google Scholar]
- 11.Fedulov A, Silverman E, Xiang Y, Leme A, Kobzik L. Immunostimulatory CpG oligonucleotides abrogate allergic susceptibility in a murine model of maternal asthma transmission. J Immunol 2005;175:4292–4300. [DOI] [PubMed] [Google Scholar]
- 12.Hollingsworth JW, Maruoka S, Boon K, Garantziotis S, Li Z, Tomfohr J, Bailey N, Potts EN, Whitehead G, Brass DM, et al. In utero supplementation with methyl donors enhances allergic airway disease in mice. J Clin Invest 2008;118:3462–3469. [DOI] [PMC free article] [PubMed] [Google Scholar] [Retracted]
- 13.Haberg SE, London SJ, Stigum H, Nafstad P, Nystad W. Folic acid supplements in pregnancy and early childhood respiratory health. Arch Dis Child 2009;94:180–184. [DOI] [PMC free article] [PubMed] [Google Scholar]
- 14.Hammad H, Lambrecht BN. Recent progress in the biology of airway dendritic cells and implications for understanding the regulation of asthmatic inflammation. J Allergy Clin Immunol 2006;118:331–336. [DOI] [PubMed] [Google Scholar]
- 15.Kuipers H, Lambrecht BN. The interplay of dendritic cells, Th2 cells and regulatory T cells in asthma. Curr Opin Immunol 2004;16:702–708. [DOI] [PubMed] [Google Scholar]
- 16.Faith A, McDonald J, Peek E, Richards D, Caulfield J, Chevretton E, Roberts D, Lee T, Corrigan C, Hawrylowicz C. Functional plasticity of human respiratory tract dendritic cells: GM–CSF enhances Th2 development. J Allergy Clin Immunol 2005;116:1136–1143. [DOI] [PubMed] [Google Scholar]
- 17.Hamelmann E, Schwarze J, Takeda K, Oshiba A, Larsen GL, Irvin CG, Gelfand EW. Noninvasive measurement of airway responsiveness in allergic mice using barometric plethysmography. Am J Respir Crit Care Med 1997;156:766–775. [DOI] [PubMed] [Google Scholar]
- 18.Adler A, Cieslewicz G, Irvin CG. Unrestrained plethysmography is an unreliable measure of airway responsiveness in BALB/c and C57BL/6 mice. J Appl Physiol 2004;97:286–292. [DOI] [PubMed] [Google Scholar]
- 19.Lutchen KR, Yang K, Kaczka DW, Suki B. Optimal ventilation waveforms for estimating low-frequency respiratory impedance. J Appl Physiol 1993;75:478–488. [DOI] [PubMed] [Google Scholar]
- 20.Hantos Z, Daroczy B, Suki B, Nagy S, Fredberg JJ. Input impedance and peripheral inhomogeneity of dog lungs. J Appl Physiol 1992;72:168–178. [DOI] [PubMed] [Google Scholar]
- 21.Lomax RG. Statistical concepts: a second course for education and the behavioral sciences, 2nd ed. Mahwah, NJ: Lawrence Erlbaum Associates; 2001.
- 22.Dohi M, Tsukamoto S, Nagahori T, Shinagawa K, Saitoh K, Tanaka Y, Kobayashi S, Tanaka R, To Y, Yamamoto K. Noninvasive system for evaluating the allergen-specific airway response in a murine model of asthma. Lab Invest 1999;79:1559–1571. [PubMed] [Google Scholar]
- 23.Gomes R, Shen X, Ramchandani R, Tepper RS, Bates JHT. Comparative respiratory system mechanics in rodents. J Appl Physiol 2000;89:908–916. [DOI] [PubMed] [Google Scholar]


