

Abstract
Background
Hepatic steatosis (fatty liver), an early and reversible stage of alcoholic liver disease, is characterized by triglyceride deposition in hepatocytes, that can advance to steatohepatitis, fibrosis, cirrhosis, and ultimately to hepatocellular carcinoma. In the present work, we studied altered plasma and hepatic lipid metabolome (lipidome) to understand the mechanisms and lipid pattern of early stage alcohol induced-fatty liver.
Methods
Male Fischer 344 rats were fed 5% alcohol in a Lieber-DeCarli diet. Control rats were pair-fed an equivalent amount of maltose-dextrin. After one month, animals were sacrificed and plasma collected. Livers were excised for morphological, immunohistochemical, and biochemical studies. The lipids from plasma and livers were extracted with methyl-tert-butyl ether and analyzed by 750/800 MHz proton nuclear magnetic resonance (1H NMR) and phosphorus (31P) NMR spectroscopy on a 600 MHz spectrometer. The NMR data were then subjected to multivariate statistical analysis.
Results
Hemotoxylin & Eosin and Oil Red O stained liver sections showed significant fatty infiltration. Immunohistochemical analysis of liver sections from ethanol-fed rats showed no inflammation (absence of CD3 positive cells) or oxidative stress (absence of malondialdehyde reactivity or 4-hydroxynonenal positive straining). Cluster analysis and principal component analysis of 1H NMR data of lipid extracts of both plasma and livers showed a significant difference in the lipid metabolome of ethanol-fed vs. control rats. 31P NMR data of liver lipid extracts showed significant changes in phospholipids similar to 1H NMR data. 1H NMR data of plasma and liver reflected several changes while comparison of 1H NMR and 31P NMR data offered a correlation among the phospholipids.
Conclusions
Our results show that alcohol consumption alters metabolism of cholesterol, triglycerides and phospholipids that could contribute to the development of fatty liver. These studies also indicate that fatty liver precedes oxidative stress and inflammation. The similarities observed in plasma and liver lipid profiles offer a potential methodology for detecting early stage alcohol-induced fatty liver disease by analyzing the plasma lipid profile.
Keywords: Ethanol, fatty liver, metabolomics, lipidomics, lipids
Introduction
Alcohol abuse is a leading cause of morbidity and mortality throughout the world. In the United States, about 10% of men and 3% of women suffer from problems and diseases related to alcohol abuse with an estimated annual cost to the U.S. economy of over $185 billion, and over 100,000 deaths (NIAAA, 2000). Alcoholic liver disease (ALD) is reported to be the second leading cause of death among liver associated diseases (NIAAA, 2000) and is a major cause of illness among chronic alcoholics. Due to the irreversible nature of the pathology of the disease, it is important to elucidate the mechanism of the early reversible stages of this disease. Hepatic steatosis (fatty liver) is an early and reversible stage of ALD that is characterized by high fat deposits in hepatocytes (Purohit et al., 2009). Fatty liver is reversible if the patient stops drinking, but otherwise can advance to steatohepatitis, fibrosis, cirrhosis and ultimately hepatocellular carcinoma (Purohit and Brenner, 2006; Purohit et al., 2005).
Recent reports suggest that patients with fatty liver are more susceptible to cirrhosis and hepatacellular carcinoma suggesting that fatty liver should not be considered a benign condition as initially thought (Apte et al., 2005; Diehl, 2002; Purohit et al., 2009). The complexity of ALD necessitates characterization of early biochemical changes that lead to the formation of fatty liver for prevention or reversal because no therapeutic agents are available for ALD. Despite many attempts to delineate the mechanism of fatty liver, more studies are needed to understand the underlying mechanisms and identify potential biomarkers for early diagnosis. Earlier studies have used rats (Apte et al., 2005; Chung et al., 2009; Nicholas et al., 2008) or mice (Bhopale et al., 2006; Bradford et al., 2008; Yin et al., 2007) as animal models with different diets, ethanol doses and periods of administration. In the present study, we used male Fischer 344 rats and the commercially available Lieber-DeCarli liquid diet to study the early metabolic changes in ethanol-induced fatty liver.
Although several toxicants can cause fatty liver, mechanisms of lipid accumulation may differ. An oversupply of free fatty acids and triglyceride accumulation in the liver could be early events of ALD. Increased synthesis and/or esterification of fatty acids, decreased fatty acid oxidation, decreased apoprotein synthesis, and decreased synthesis and/or secretion of very low density lipoproteins could be associated with development of fatty liver (Treinen-Moslen, 2001). Several reports show involvement of one or more of the above mentioned mechanisms in lipid accumulation after alcohol consumption (Crabb, 1995; Feinman and Lieber, 2002; Ip et al., 2003; Nanji, 2004; You and Crabb 2004; You et al., 2002).
Several approaches have been used to unveil pathways involved in early stage fatty liver development. Metabolomics, a recently developed technique, allows probing the mechanisms that determine changes at the metabolite levels and increasingly has been used in toxicology (Griffin et al., 2007; Harrigan et al, 2008; Kim et al., 2008; Yap et al., 2006). Compared to conventional methods, this ‘omic’ technique offers many advantages, including categorization of organ specific biochemical perturbations, surveillance of the onset of toxic events and their progression, and the identification of biomarkers of toxicity (Hakumaki et al., 1999; Nicholas et al., 2008; Serkova et al., 2006; Shi et al., 2007). High-resolution NMR-based metabolomics is a powerful technique for multi-component analysis because it is non-invasive, rapid, quantitative, reproducible, and has proven to be ideal for the analysis of low molecular weight compounds in biofluids or biological tissues (Lindon et al., 2004). The large amount of data generated by NMR on hierarchical clustering and principle component analysis identifies the altered metabolomes between the treatment and control groups.
Our objective in this project is to elucidate the mechanism of early stage ALD and compare the pathogenic and biochemical changes with lipidomic changes using NMR-based metabolomics. Our results demonstrate that ethanol consumption by rats for one month significantly alters the lipid metabolome and induces fatty liver.
Materials and Methods
Animals and treatment
Male Fischer 344 rats (~ 6 weeks old) purchased from Harlan (Indianapolis, IN) were housed in a humidity and temperature controlled animal room with automatic 12h light/dark cycles. After one week, animals were housed individually in cages and provided with regular Lieber-DeCarli liquid diet (cat. no. 710260) [carbohydrates (11% of calories), protein (18%), fat (35%) and ethanol or maltose dextrin (36%) (Lieber and DeCarli, 1989)] (Dyets Inc., Bethlehem, PA) for a week. Liquid diets containing ethanol or equivalent calories substituted by maltose-dextrin (cat. no, 402851) for pair-feeding were prepared according to manufacturers instructions. Pair-feeding of animals was done to minimize confounding variables such as weight gain and caloric intake between control and experimental rats.
The amount of ethanol in the liquid diet was increased gradually from 1% to 5% and then maintained at 5% for one month as described earlier (Bhopale et al., 2006). The diets were prepared and changed daily and weights of animals were recorded each week. Daily intake of liquid diet for each animal, their general health, and any signs of distress and morbidity were recorded.
Animals from the control and ethanol fed group were sacrificed on the 30th day by an intraperitonial injection of Nembutol (sodium salt, 80 mg/ml) and blood from the heart was collected in heparinized tubes, centrifuged at 1,000 g for 10 minutes and plasma separated and stored at −80 °C.
Liver was obtained, blotted, weighed and a portion of the liver from each animal was fixed in 10% formalin for histology using Hemotoxylin and Eosin (H&E) staining. Remaining liver was stored at −80 °C for biochemical analysis. Oil Red O staining was done on frozen liver sections. Malondialdehyde (MDA) quantification was performed using the Oxiselect TBARS assay kit STA-330 (Cell Biolabs, Inc. CA). Staining for 4-hydroxynonenal (HNE) was performed using anti-4HNE antibody HNE11-S (Alpha Diagnostics, San Antonio, TX). Staining for T-cells were performed using rabbit anti mouse CD3 antibodies (Dako, Carpinteria, CA).
ALT and AST assays
Plasma samples were assayed for markers of liver injury, alanine aminotransferase (ALT) and aspartate aminotransferase (AST), using the ALT and AST kits from Biotron Diagnostics Inc. (Hemet, CA).
Lipid extraction from plasma and livers
Frozen plasma samples were thawed on ice and the lipids extracted with methyl tert-butyl ether (MTBE) (Matyash et al., 2008). Briefly, 1.5 ml of methanol (MeOH) was added to 200 µl plasma in a glass tube. After vortexing, 5 ml of MTBE were added and the samples were shaken at room temperature for one hour. Subsequently, 1.25 ml of high purity water was added, mixed and allowed to stand for 10 minutes at room temperature. The two phases were separated by centrifugation at 8,000 g for 10 minutes. The upper phase was collected into a separate tube and the lower aqueous phase was re-extracted with 2 ml of MTBE/MeOH/water (10/3/2.5, v/v/v). Combined organic phases were dried under nitrogen. Frozen liver (250 mg) was homogenized in methanol and extracted with MTBE in a manner similar to plasma samples.
1H NMR spectroscopy of plasma and liver lipids
The NMR spectra were obtained by dissolving the dried lipid fractions in deuterated chloroform (Sigma-Aldrich, St Louis, MO) containing tetramethylsilane (TMS) as an internal standard (Beckonert et al., 2007). The final volume of the sample was made up to 750 µl with deuterated chloroform in a 5 mm NMR tube (Wilmad Lab glass, NJ). 1H NMR spectra were obtained using a 750 or 800 MHz Varian NMR (VNMR) spectrophotometer (Varian Inc., CA). The one dimensional spectra were recorded using a single pulse sequence with 256 scans. Spectra were manually phased and the proton signals were referenced to TMS set at δ = 0.00 ppm. The chemical shifts of clearly identifiable peaks were assigned to various metabolite/lipid groups by comparing the published data on lipids (Awl et al., 1989; Chapman and Morrison, 1966; Hatzakis et al., 2008; Jie and Cheng 1995; Knothe, 2007; Oostendorp et al., 2006; Pollesello et al,, 1993; Sze and Jardetzky, 1990; Tugnoli et al., 2003; Wei et al., 2008; Wilson et al., 1996;).
31P NMR spectroscopy of liver lipids
For 31P NMR analysis, the dried samples were dissolved in 0.75 ml deuterated chloroform-methanol (2:1, v/v) containing triethyl phosphate (TEP) as an internal standard. All experiments were carried out on a 600 MHz Varian Inova NMR spectrophotometer (Varian Inc., CA) set at 242.69 MHz using a single pulse with proton decoupling. The samples were placed in a 5 mm NMR tube and the spectra were acquired using 5500 scans per sample at 25 °C. Spectra were manually phased and the phosphorus signals were referenced to TEP set at δ = 0.00 ppm. Identification of different phospholipids was achieved by comparing with phospholipid standards and published data, and also by spiking the samples with authentic phospholipids (Hatzakis, et al., 2008; Meneses and Glonek, 1988; Solivera et al., 2009).
Pattern Recognition analysis
The acquired NMR data were subjected to multivariate statistical analysis. Prior to the analysis, the 1H NMR data was divided into integral regions (i.e. bins) of equal width of 0.01 ppm using an ‘in house’ VNMR macro for the spectral regions between δ = 0.2 to 8.4 or 8.6 ppm for plasma and liver samples, respectively, resulting in 820 or 860 bins for their respective regions. 31P NMR data of liver samples was also divided into integral regions of equal width of 0.01 ppm using the same VNMR macro for the spectral regions between δ = 0.2 to 2.3 ppm. Base line corrections were performed using the same macro. The integrated data were further analyzed using the Spotfire Decision Site 9.0 software (TIBCO Spotfire, Somerville, MA). First, a t-test was performed for all of the integrated regions, and then the regions with statistically significant differences between the two groups (p ≤ 0.01 or 0.05) were selected for further analysis. These regions were normalized, and the Z-scores calculated and used for data clustering by hierarchical clustering (HC) and principal component analysis (PCA). The % changes between the two groups were calculated by taking the average bin integration value of control and ethanol-fed animals at each ppm. The data of plasma and liver lipids was further clustered using the most significant regions (p ≤ 0.005) from each category such as 1H NMR of plasma and liver lipids, 1H and 31P NMR of liver lipids, and 1H NMR of plasma and 1H and 31P NMR of liver lipids.
Results
Effect of ethanol on body and liver weights and liver histology
No significant change in whole body weight or liver weight was observed in ethanol-fed animals vs. controls (data not shown). H&E stained sections of livers of the ethanol-fed group showed vacuolization. Fatty deposition was confirmed by Oil Red O staining (Figure 1). No evidence of infiltrating inflammation was observed. Immunohistochemistry of liver sections confirmed the absence of inflammation, as evidenced by lack of CD3 positive cells (Figure 1). Oxidative stress was assessed by MDA quantification (10.5 ± 1.29 nmol MDA/mg protein for control and 10.4 ± 0.67 nmol MDA/mg protein for ethanol-fed group) and by 4-HNE-specific immunostaining (Figure 1). These results indicate no evidence of oxidative stress in either ethanol-fed rats or pair-fed controls. Both plasma ALT and AST levels showed apparent increases in the ethanol-fed group, but the increases were not statistically significant (data not shown).
Figure 1.
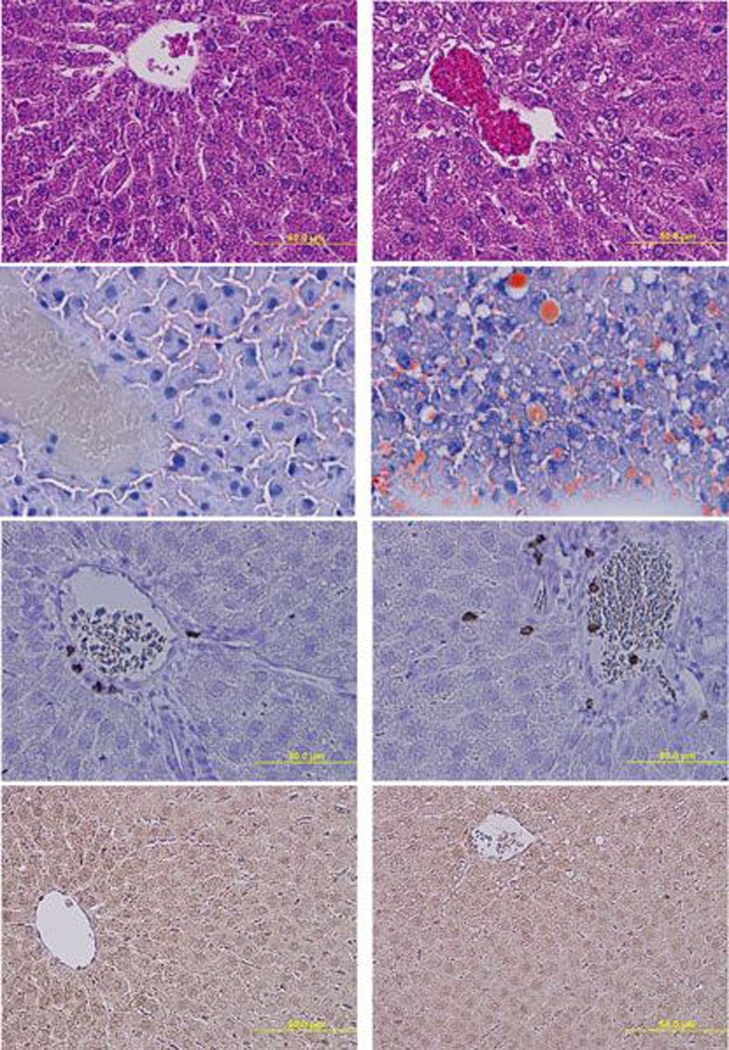
Histology and immunohistochemistry of livers of pair-fed control Fischer 344 rats vs. those fed 5% ethanol in liquid diet for one month. The upper panel shows H&E stained liver sections from (a) control with normal histology and no lipid deposition. (b) Ethanol-fed liver shows vacuolization consistent with significant fat deposition (arrows). In the second panel, Oil Red O stained liver sections for (c) control and (d) ethanol-fed, show increased positive staining for fat vacuoles in liver section of ethanol-fed group. The third panel shows CD3 stained liver sections from (e) the control and (f) ethanol-fed showing a similar lack of staining for CD3 positive cells in portal area or blood vessels. The last panel shows negative staining for antibodies against 4-HNE in liver sections from (g) control and (h) ethanol-fed groups, indicative of a lack of significant oxidative stress. All photomicrographs are at the same power (×200).
1H NMR spectral analysis of plasma lipids
Figure 2A shows representative superimposed 1H NMR spectra of plasma lipid extracts of control and ethanol-fed rats. HC and PCA of the 1H NMR data at p ≤ 0.01 show a separation between the plasma of ethanol-fed and control animals. HC analysis (data not shown) of the 1H NMR spectral data of the plasma lipids identified two main clusters. One cluster consisted of five ethanol-fed rats, and the other cluster consisted of six control and two ethanol-fed rats. A similar pattern was also observed in the PCA analysis (Figure 3A). Separations observed in plasma lipids were attributed to NMR signals of altered lipids. The chemical shifts showing positive or negative shifts from the control group were identified and percent values of each lipid species are summarized in Table 1. Analysis of plasma lipids at p ≤ 0.05 shows decreases in chemical shifts at positions 1.18–1.19, 2.08, 2.10–2.13, 3.64–3.66, 3.66 and 3.91–3.94 ppm, that correspond to protons related to fatty acyl chains, aliphatic methyl esters, phosphatidyl choline (PC), and the glycerol backbone of phospholipids. Our data in Table 1 further illustrates that the exposure of ethanol substantially decreases the PC/lysophosphatidyl choline (LPC) and the aliphatic methyl esters, followed by the fatty acyl chains.
Figure 2.

Representative superimposed one dimensional 1H NMR spectra (750 MHz for plasma and 800 MHz for liver) of lipid extracts from plasma (A) and liver (B) of control and ethanol-fed rats between −0.2 to7.6 ppm. TMS = 0.0 ppm Control (black) and ethanol-fed (blue). The numbers in the figures represent the positions at which the changes in NMR chemical shifts were observed and are listed in Tables 1 and 2.
Figure 3.


PCA of the 1H NMR spectra from plasma (A) and liver (B) lipid extracts at p ≤ 0.01. The three dimensional plot of the data demonstrates separation of ethanol-fed rats from controls. C1–C6 represents control rats (green) and E1–E7 represents ethanol-fed rats (red). In PCA each point represents a value calculated from an individual spectrum. One cluster consists of ethanol-fed group while the other cluster consists of six control rats and two ethanol-fed rats. Heat maps generated for plasma and liver lipids by HC are available in the supplementary material.
Table 1.
Significant metabolic differences in the plasma lipids of ethanol-fed rats obtained from 1H NMR at p ≤ 0.05.
| Location Number |
Chemical Shift Bins (ppm) |
Metabolites | Changea (%) |
|---|---|---|---|
| 1 | 1.18,1.19 | -CH2- in acyl chain | −38, −43 |
| 2 | 2.08, 2.10, 2.11–2.13 | -CH2-CH=CH in fatty acyl chain | −15, −16, −15, −17, −17 |
| 3 | 3.64, 3.65, 3.66 | O-CH3 aliphatic methyl ester | −54, −62, −66 |
| 4 | 3.88 | CH2N+(CH3)3 in PC/LPC | −85 |
| 5 | 3.91–3.93, 3.94 | C3H in glycerol backbone of PC | −59, −65, −69, −67 |
The percentage (%) changes were calculated by taking the average bin integration value of control and ethanol-fed animals at each ppm. Bold chemical shift bins correspond to p ≤ 0.01.
1H NMR spectral analysis of liver lipids
Figure 2B shows representative superimposed 1H NMR spectra of lipids from livers of control and ethanol-fed animals. HC and PCA of the 1H NMR metabolomic data at p ≤ 0.01 show a separation between the control and ethanol-fed groups. HC (data not shown) of the liver lipids identified two main clusters. One cluster consisted of five control animals and the other consisted mainly of ethanol-fed animals. We found one control animal clustered with the ethanol-fed group. This observed separation was in agreement with the PCA results where one control animal was closely associated to the ethanol-fed group (Figure 3B). However, five ethanol-fed animals were clustered very closely to each other. Analysis of liver lipids at p ≤ 0.05 showed changes at chemical shifts 0.68, 0.88, 0.92–0.94, 1.02, 1.26–1.27 and 1.29, 1.56, 1.59–1.60, 1.84–1.87, 2.07, 2.26–2.27, 2.30, 3.73, 3.96–3.97, 4.33–4.34, 5.33, 5.37, and 5.40. As listed in Table 2, these changes correspond to increases/decreases in lipid groups and affected metabolism includes cholesterol (total/free and esterified), triglycerides, fatty acids and the phospholipids.
Table 2.
Significant metabolic differences in the liver lipids of ethanol-fed rats obtained from 1H NMR at p ≤ 0.05.
| Location Number |
Chemical Shift Bins (ppm) |
Metabolites | % Changea |
|---|---|---|---|
| 1 | 0.68 | CH3 attached to C13 (C18H3) in cholesterol | + 24 |
| 3 | 0.92–0.94 | CH3 attached to C21 (C20H3) in cholesterol | + 23, +16, + 10 |
| 4 | 1.02 | CH3 attached to C10 (C19H3) in esterified cholesterol | + 48 |
| 6 | 1.56 | Cholesterol | + 23 |
| 8 | 1.84– 1.87 | Cholesterol (-C=C-CH2-) | +17, +36, +31, +56 |
| 10 | 2.26, 2.27 | Cholesterol C4 /-CH2COOH- in fatty acyl chain | + 29, + 33 |
| 2 | 0.88 | Terminal CH3 gps in fatty acyl chain | − 14 |
| 5 | 1.26, 1.27, 1.29 | CH2 in fatty acyl chain (C4 and beyond saturated) | −18, −10 and −11 |
| 7 | 1.59, 1.60 | CH2 in acyl C3 (saturated chain) or COCH2CH2 | −15, −13 |
| 11 | 2.30 | -CH2CO- in fatty acyl chain | − 27 |
| 9 | 2.07 | CH=CH-CH2- allylic | + 13 |
| 15 | 5.33 | CH=CH in fatty acyl chain (unsaturated fatty acid) | + 5 |
| 16 | 5.37 | CH=CH in fatty acyl chain (unsaturated fatty acid) | + 5 |
| 12 | 3.73 | -CH-OH in C2 glycerol | + 133 |
| 13 | 3.96, 3.97 | -CH2-O-P in PE/LPE and/or POCH in PS | + 311, +192 |
| 14 | 4.33, 4.34 | glycerol backbone of triglycerides (TGA) | +231, +190 |
| 17 | 5.40 | C2-OH in lyso-PC and/or CH=CH of acyl chain in PC | − 9 |
The % changes were calculated by taking the average bin integration of control and ethanol-fed animals at each ppm. Bold chemical shift bins correspond to p ≤ 0.01.
31P NMR spectral analysis of liver lipids
We used 31P NMR spectroscopy to identify changes in the phospholipids in livers due to exposure to ethanol. Figure 4A shows representative superimposed 31P NMR spectra of phospholipid extracts from the livers of controls and ethanol-fed animals. Each peak in the spectrum corresponds to a different head group of a phospholipid. Some variations in the chemical shifts of the phospholipids were observed (Solivera et al., 2009). There were four major phospholipids in the control and the ethanol-fed groups: PC, phosphatidylethanolamine (PE), LPC and lyso-phosphatidylethanolamine (LPE). The PC head group was the major phospholipid in both the control and the ethanol-fed groups with peaks arising from other head groups such as PE, LPC and LPE as well. Minor peaks were observed from phosphatidylserine (PS), and sphingomyelin (SM). The peak intensities from the minor phospholipids were more significant in the ethanol-fed group as compared to the controls. HC and PCA were performed on the 31P NMR data by fixing the peak positions of PE or PC to observe the relative changes in the phospholipids. PCA obtained by fixing PE at p ≤ 0.01 is shown in Figure 4B. This figure shows a clear separation between the control and the ethanol-fed animals. Cluster analyses at p ≤ 0.01 reveals a decrease in PC levels and an increase in LPE, SM and PS levels. A small shoulder appearing up field to PC in the ethanol-fed phospholipid spectra may be due to phosphatidylethanol (PEt, a nonoxidative lipid metabolite of ethanol), and is increased after ethanol exposure. Increased changes in PE levels were observed only at the p ≤ 0.05 levels.
Figure 4.


(A) 31P NMR spectra of liver extracts from control and ethanol-fed rats between −0.2 to 2.6 ppm. The spectra were recorded using a 600 MHz NMR spectrophotometer and TEP as an internal standard. The peak assignments of identified metabolites are as follows: 1. Phosphatidylethanol, 2. Phosphatidylcholine, 3. Lyso-phosphatidylcholine, 4. Sphingomyelin, 5. Phosphatidylserine, 6. Phosphatidylethanolamine, and 7. Lysophosphatidylethanolamine. (B)Three dimensional PCA plot of the data demonstrates separation of ethanol-fed (E1–E7, red) and control (C1–C6, green) rats.
Combined analysis of 1H NMR data of plasma and 1H and 31P NMR data of liver
We further clustered the data based on the significant bins (p ≤ 0.005) of plasma 1H-, liver 1H-, and liver 31P NMR in all possible combinations. Figure 5A shows the PCA of plasma and liver lipids obtained using 1H NMR at p ≤ 0.005. PCA reveals a clear separation of the two groups after ethanol feeding. Figure 5B shows the clustering by PCA of liver 1H and 31P NMR at the same significance level. Clustering of these data using PCA shows two large separations with one control animal as a separate entity. Figure 5C shows the combined PCA of all 1H plasma/liver and 31P NMR liver data. This analysis also shows a clear separation of the ethanol-fed animals. The changes in metabolites at p ≤ 0.005 from each group of data are decreases in acyl chains (1.19 ppm), O-methyl esters (3.64 and 3.65), fatty acyl chains (1.26), and PC (3.88 and 3.91–94), and increases in liver cholesterol (0.92, 1.85 and 1.86 ppm) and esterified cholesterol (1.02 ppm). The corresponding changes associated with liver lipids analyzed by 31P NMR are associated with decreases in PC and increases in LPE. Figure 6A shows a comparison of 1H NMR data of plasma and liver. Comparison of 1H NMR and 31P NMR data of liver showed similar changes including increases in LPE/PE (Figure 6B).
Figure 5.


PCA score plots of lipid data. (A) Combined 1H NMR data of plasma and liver lipids. (B) Combined 1H NMR and 31P NMR of liver lipid extracts. (C) Combined 1H NMR of plasma/liver lipid extracts and 31P NMR of liver lipid extracts.
PCA were performed by taking the values from each type of data with p ≤ 0.005. The three-dimensional plots of the data demonstrate clear separation of ethanol-fed rats. C1–C6 represents control rats and E1–E7 represents ethanol-fed rats. In PCA, each point represents a value calculated from an individual spectrum and green and red squares represent control and ethanol-fed animals, respectively. Heat maps generated for each combination by HC are available in the supplementary material.
Figure 6.


The plots of controls vs. ethanol-fed NMR data. (A) 1H NMR data of plasma and liver. Arrows indicate increased or decreased bin integration values corresponding to different lipid metabolites. One metabolite may have more than one point and all the points are not marked. The plot was made by taking the average bin integration values of control and ethanol-fed group at p ≤ 0.05 (P-plasma, L-liver) and the changes corresponding to all the fatty acyl chains are not included in the figure. (B) 1H and 31P NMR data of liver.
Discussion
Chronic alcohol abuse is known to cause alcoholic liver disease (ALD) that is a major health problem in the Western world. Ethanol can cause liver damage ranging in degree from fatty liver to irreversible changes such as steatohepatitis, fibrosis, cirrhosis and terminal hepatocellular carcinoma (Purohit and Brenner, 2006; Purohit et al., 2005). The stage of ethanol-induced liver injury and ALD depends on the amount and the duration of ethanol consumption. Accumulation of fat in the liver possibly provides the ‘first hit’ in the development of steatohepatitis (Browning and Horton, 2004; Day and James 1998; Purohit et al., 2009). The presence of fat in hepatocytes seen in H&E and Oil Red O stained liver sections in our studies is consistent with the literature (Chung et al., 2009; Gyamfi et al., 2008; Yin et al., 2009). The lack of significant changes in ALT and AST in rats fed ethanol for one month is also in line with earlier reports (Apte et al., 2005; Gyamfi et al., 2008; Yin et al., 2007).
Another mechanism of ALD is alcohol-induced oxidative stress, that can be considered the ‘second hit’ for converting hepatic steatosis to steatohepatisis (Browning and Horton, 2004; Day and James, 1998; Reid, 2001; Roede et al., 2009). In these studies, we did not observe oxidative stress either by MDA assay or by immunohistochemistry using antibodies against 4-HNE. The lack of inflammation (no infiltration by CD3 positive cells) that was observed is the same as previous reports (Chung et al, 2009; Roede et al., 2009). Our results in this study indicate that hepatic steatosis precedes oxidative stress and inflammation.
To identify the metabolic changes of early stage steatosis, we applied pattern recognition analysis to NMR data. A key observation from 1H and 31P NMR data is a clear decrease in the PC levels in both plasma and liver lipids (Tables 1 & 3). It has been previously reported that ethanol ingestion decreases PC production (Kharbanda et al., 2007). PC has an essential structural function as well as serving as a reservoir for lipid second messengers LPC, diacyl glycerol and phosphatidic acid (van Meer et al., 2008). PC is also a substrate for very low density lipoprotein synthase and involved in the synthesis of other phospholipids. Since methylation of PE to PC occurs via three successive methylations in the liver, increases in PE would be expected along with the decreased PC levels. The other phospholipids (PE and LPE) were indeed increased in our 1H and 31P NMR spectral data (Table 2 & 3). Overall, decreases in PC levels are indicative of an overall decrease in biomolecular methylation at all levels. Our results in this study indicate that hypomethylation of phospholipids is one of the key steps in hepatic steatosis. Decreased methylated fatty acids and PC in plasma lipids needs further evaluation as a biomarker signature for the early detection of alcohol mediated liver steatosis.
Table 3.
Significant metabolic differences in the liver lipids of ethanol-fed rats obtained from 31P NMR at p ≤ 0.05.
| Location Number |
Chemical Shift Bins (ppm) |
Metabolites | Changea (%) |
|---|---|---|---|
| 1 | 0.36, 0.38, 0.39, 0.40 | Phosphatidylethanol | +33, +37, +57, +63 |
| 2 | 0.50, 0.51–0.70 | Phosphatidylcholine | −35, −51, −59, −60, −66, −71, −69, −68, −71, −75, −73, −71, −70, −65, −62, −64, −60, −50, −55, −55, −42 |
| 3 | 1.09–1.13, 1.14 | Lyso-phosphatidylcholine | +52, +59, +45, +47, +58, +46 |
| 4,5 | 1.34 | Sphingomyelin/ Phosphatidylserine | +22 |
| 6 | 1.52 | Phosphatidylethanolamine | +25 |
| 7 | 1.90–1.98 | Lyso-phosphatidylethanolamine | +96, +147, +144, +228, +272, +218, +140, +167, +260 |
The percentage (%) changes were calculated by taking the average bin integration value of control and ethanol-fed animals at each ppm. Bold chemical shift bins correspond to p ≤ 0.01.
PC methylation utilizes S-adenosyl methionine (SAM) as the substrate (Delong et al., 1999; Reo et al., 2002; Sundler and Akesson, 1975). SAM is a major endogenous methylating agent and its deficiency can lead to steatosis advancing to hepatacellular carcinoma (Nakae, 1999; Wainfan et al., 1988). Methylation is required for the biosynthesis of PC and for regulating the function and activity of other biomolecules. Earlier studies have shown that ethanol intake decreases SAM levels (Barak et al., 1987; Lu et al., 2000). Chronic ethanol ingestion leads to malnutrition, depleting nutrients such as choline, folate and methionine that are the precursors of SAM biosynthesis. When these nutrients are deficient, very low density lipoprotein production and/or secretion are compromised (Yao and Vance 1988, 1990) and lipids accumulate in hepatocytes. Evidence obtained in our studies, including lipid accumulation and decreased levels of PC, are consistent with these studies. Early studies also suggest that ethanol may alter cell membrane permeability and transport (Israel-Jacard and Kalant, 1965; Wendt et al., 1965). Since phospholipids play an important role in the structure and function of cell membranes, including membrane permeability, it is likely that the effect of ethanol on membranes is mediated through altered homeostasis of phospholipids.
Fatty acid methyl esters (FAMEs), normally present in low amounts in plasma and tissues, are formed by the transfer of a methyl group from SAM to a free fatty acid (Akamatsu and Law, 1970; Zatz et al., 1981) or catalyzed by fatty acid ethyl ester synthase mediated conjugation of free fatty acids with endogenous methanol (Kaphalia et al., 1995, 1999). Whether the decreases in FAMEs (Table 1) could be attributed to decreased SAM levels and/or impaired methyl transferases needs to be determined. Our findings of hypomethylation of PC together with existing literature suggest that SAM mediated mechanisms could be involved in ALD. We hypothesize that decreased SAM methylation of cellular molecules is responsible for fatty liver and that this can be confirmed by an altered lipid metabolome as observed in our studies.
1H NMR spectral analysis of liver lipids from ethanol fed rats in our study shows an increase in the glycerol backbone, most likely of triglycerides. This observation is consistent with previous findings where ethanol exposure in rats or mice increased the hepatic triglycerides (Chung et al., 2009; Lieber et al., 2007; Tomita et al., 2005; Yin et al., 2009). Accumulation of triglycerides in the liver has been attributed to increased biosynthesis of fatty acids in liver or increased mobilization of fatty acids from adipose tissue (Crabb and Liangpunsakul, 2006; Horning et al., 1960; Lieber et al., 1966). Fatty acids are involved in many key biological processes including acting as key structural and functional components of membranes, as lipophilic modifiers, as energy stores, and as precursors of intracellular messengers. Although no significant differences in free fatty acids could be seen in our analysis of plasma lipids by 1H NMR, we observed changes in the total fatty acyl chains. Specifically, plasma lipids showed a decrease in the acyl chains. It should be noted that the changes that we observed are the net change in all acyl chains attached to different lipid groups (phospholipids, triglycerides, and cholesterol). Consistent with plasma lipids, liver lipids also show a decrease in acyl chains at 1.26, 1.27 and 1.29 ppm. The methylene protons appear as a broad peak from 1.23–1.38 ppm. Even though there was an apparent increase at 1.30–1.38 ppm, it did not reach statistical significance. The significant increase observed at 2.26–2.27 ppm (Table 2) could be partly due to the presence of free fatty acids that support the accumulation of triglycerides. Monounsaturation in lipids shows a slight increase consistent with previous findings (Ristic et al., 1995). The peak at 2.07 ppm is a characteristic peak for allylic protons (Knothe, 2007). Even though the NMR spectrum shows a peak in the 2.76–2.80 ppm region, we did not observe a significant change suggesting minimal changes in the polyunsaturated acyl chains. In general, peaks appearing in the 5.33–5.40 ppm region correspond to vinylic (CH=CH) protons. Since the acyl chains are attached to different lipid groups showing an increase or a decrease, we cannot assign the changes to a particular lipid group associated with ethanol feeding or ethanol induced liver disease. Decreases in acyl chains of various lipids with minimum increases in the unsaturation observed in our studies suggest a net increase in monounsaturation during the early stages of injury.
Alcohol administration alters cholesterol metabolism and its profile (Crabb and Liangpunsakul, 2006; Delgado-Villa et al., 2009; Ojeda et al., 2008). Our analysis of hepatic lipids showed a significant increase in cholesterol. The changes observed here may be due to total (free and esterified) cholesterol as the peaks can overlap. Analysis of the cholesterol peaks showed a marked increase at 1.02 ppm. The change observed at 1.02 ppm corresponds to esterified cholesterol — the corresponding peak for free cholesterol is at 1.01 ppm. Our results showing an increase in total cholesterol most likely can be attributed to an increase in esterified cholesterol.
In conclusion, ethanol induced hepatic steatosis is multifunctional and involves changes in cellular redox potential and the reciprocal regulation of transcription factors that control lipogenesis and lipid metabolism (You and Crabb, 2004). Hence identification of new regulators of cellular metabolism related to lipid metabolism that are altered by ethanol is relevant to the pathogenesis of ethanol induced-steatosis and liver injury. Metabolic markers for fatty liver are not currently available for humans, but, the rat model used in this study offers an opportunity to assess biochemical perturbations due to ingestion of alcohol that affect lipid metabolism (cholesterol, triglycerides, phospholipids and fatty acids). Our results demonstrate that fatty liver, verified by histology, is accompanied by changes in the plasma/liver lipidome. Comparisons of the NMR data of plasma with liver show clear similarities, offering the potential for using the plasma profile to identify or predict this early stage of alcoholic liver disease. Although the changes we observed have been reported using biochemical analyses and other methods, our metabolomic approach confirms that systematic lipid changes can be easily observed using NMR spectroscopic analysis. Therefore, evaluation of specific enzymes and genes that are responsible for the observed lipidomic changes, and the effect of methyl group donors on reversal of ethanol-induced fatty liver could be useful in understanding the mechanism of early stage ALD.
Supplementary Material
Acknowledgements
This publication was made possible by NIH grant, R01AA016364. Its contents are solely the responsibility of the authors and do not necessarily represent the views of the NIH or NIAAA. The authors would like to thank the Sealy Center for Structural Biology at UTMB for the use of NMR instruments, Dr. Tianzi Wang the manager, NMR Center, Dr. Richard Hodge at the National Institute of Environmental Health Science Center (supported by NIEHS grant P30ES06676) at UTMB and Dr. Dhananjaya Nauduri for computational software.
References
- Akamatsu Y, Law JH. The enzymatic synthesis of fatty acid methyl esters by carboxyl group alkylation. J Biol Chem. 1970;245:709–713. [PubMed] [Google Scholar]
- Apte UM, Banerjee A, McRee R, Wellberg E, Ramaiah SK. Role of osteopontin in hepatic neutrophil infiltration during alcoholic steatohepatitis. Toxicol Appl Pharmacol. 2005;207:25–38. doi: 10.1016/j.taap.2004.12.018. [DOI] [PubMed] [Google Scholar]
- Awl RA, Frankel EN, Weisleder D. Synthesis and Characterization of Triacylglycerols Containing Linoleate and Linolenate. Lipids. 1989;24:866–872. doi: 10.1007/BF02535761. [DOI] [PubMed] [Google Scholar]
- Barak AJ, Beckenhauer HC, Tuma DJ, Badakhsh S. Effects of prolonged ethanol feeding on methionine metabolism in rat liver. Biochem Cell Biol. 1987;65:230–233. doi: 10.1139/o87-029. [DOI] [PubMed] [Google Scholar]
- Beckonert O, Keun HC, Ebbels TM, Bundy J, Holmes E, Lindon JC, Nicholson JK. Metabolic profiling, metabolomic and metabonomic procedures for NMR spectroscopy of urine, plasma, serum and tissue extracts. Nat Protoc. 2007;2:2692–2703. doi: 10.1038/nprot.2007.376. [DOI] [PubMed] [Google Scholar]
- Bhopale KK, Wu H, Boor PJ, Popov VL, Ansari GA, Kaphalia BS. Metabolic basis of ethanol-induced hepatic and pancreatic injury in hepatic alcohol dehydrogenase deficient deer mice. Alcohol. 2006;39:179–188. doi: 10.1016/j.alcohol.2006.09.005. [DOI] [PubMed] [Google Scholar]
- Bradford BU, O'Connell TM, Han J, Kosyk O, Shymonyak S, Ross PK, Winnike J, Kono H, Rusyn I. Metabolomic profiling of a modified alcohol liquid diet model for liver injury in the mouse uncovers new markers of disease. Toxicol Appl Pharm. 2008;232:236–243. doi: 10.1016/j.taap.2008.06.022. [DOI] [PMC free article] [PubMed] [Google Scholar]
- Browning JD, Horton JD. Molecular mediators of hepatic steatosis and liver injury. J Clin Invest. 2004;114:147–152. doi: 10.1172/JCI22422. [DOI] [PMC free article] [PubMed] [Google Scholar]
- Chapman D, Morrison A. Physical studies of phospholipids. IV. High resolution nuclear magnetic resonance spectra of phospholipids and related substances. J Biol Chem. 1966;241:5044–5052. [PubMed] [Google Scholar]
- Chung CH, Shugrue C, Nagar A, Doll JA, Cornwell M, Gattu A, Kolodecik T, Pandol SJ, Gorelick F. Ethanol Exposure Depletes Hepatic Pigment Epithelium-Derived Factor, a Novel Lipid Regulator. Gastroenterology. 2009;136:331–340. doi: 10.1053/j.gastro.2008.09.065. [DOI] [PMC free article] [PubMed] [Google Scholar]
- Crabb DW. Ethanol oxidizing enzymes: roles in alcohol metabolism and alcoholic liver disease. Prog Liver Dis. 1995;13:151–172. [PubMed] [Google Scholar]
- Crabb DW, Liangpunsakul S. Alcohol and lipid metabolism. J Gastroenterol Hepatol. 2006;21 Suppl 3:S56–S60. doi: 10.1111/j.1440-1746.2006.04582.x. [DOI] [PubMed] [Google Scholar]
- Day CP, James OF. Steatohepatitis: a tale of two "hits"? Gastroenterology. 1998;114:842–845. doi: 10.1016/s0016-5085(98)70599-2. [DOI] [PubMed] [Google Scholar]
- Delgado-Villa MJ, Ojeda ML, Rubio JM, Murillo ML, Sanchez OC. Beneficial role of dietary folic acid on cholesterol and bile acid metabolism in ethanol-fed rats. J Stud Alcohol Drugs. 2009;70:615–622. doi: 10.15288/jsad.2009.70.615. [DOI] [PubMed] [Google Scholar]
- DeLong CJ, Shen YJ, Thomas MJ, Cui Z. Molecular distinction of phosphatidylcholine synthesis between the CDP-choline pathway and phosphatidylethanolamine methylation pathway. J Biol Chem. 1999;274:29683–29688. doi: 10.1074/jbc.274.42.29683. [DOI] [PubMed] [Google Scholar]
- Diehl AM. Liver disease in alcohol abusers: clinical perspective. Alcohol. 2002;27:7–11. doi: 10.1016/s0741-8329(02)00204-5. [DOI] [PubMed] [Google Scholar]
- Feinman L, Lieber CS. Ethanol and lipid metabolism. Am J Clin Nutr. 1999;70:791–792. doi: 10.1093/ajcn/70.5.791. [DOI] [PubMed] [Google Scholar]
- Griffin JL, Scott J, Nicholson JK. The influence of pharmacogenetics on fatty liver disease in the wistar and kyoto rats: a combined transcriptomic and metabonomic study. J Proteome Res. 2007;6:54–61. doi: 10.1021/pr0601640. [DOI] [PubMed] [Google Scholar]
- Gyamfi MA, Damjanov I, French S, Wan YJ. The pathogenesis of ethanol versus methionine and choline deficient diet-induced liver injury. Biochem Pharmacol. 2008;75:981–995. doi: 10.1016/j.bcp.2007.09.030. [DOI] [PMC free article] [PubMed] [Google Scholar]
- Hakumaki JM, Poptani H, Sandmair AM, Yla-Herttuala S, Kauppinen RA. 1H MRS detects polyunsaturated fatty acid accumulation during gene therapy of glioma: implications for the in vivo detection of apoptosis. Nat Med. 1999;5:1323–1327. doi: 10.1038/15279. [DOI] [PubMed] [Google Scholar]
- Harrigan GG, Maguire G, Boros L. Metabolomics in alcohol research and drug development. Alcohol Res Health. 2008;31:26–35. [PubMed] [Google Scholar]
- Hatzakis E, Koidis A, Boskou D, Dais P. Determination of phospholipids in olive oil by 31P NMR Spectroscopy. J Agr Food Chem. 2008;56:6232–6240. doi: 10.1021/jf800690t. [DOI] [PubMed] [Google Scholar]
- Horning MG, Williams EA, Maling HM, Brodie BB. Depot fat as source of increased liver triglycerides after ethanol. Biochem Biophys Res Commun. 1960;3:635–640. doi: 10.1016/0006-291x(60)90077-2. [DOI] [PubMed] [Google Scholar]
- Ip E, Farrell GC, Robertson G, Hall P, Kirsch R, Leclercq I. Central role of PPARalpha-dependent hepatic lipid turnover in dietary steatohepatitis in mice. Hepatology. 2003;38:123–132. doi: 10.1053/jhep.2003.50307. [DOI] [PubMed] [Google Scholar]
- Israel-Jacard Y, Kalant H. Effect of Ethanol on Electrolyte Transport and Electrogenesis in Animal Tissues. J Cell Physiol. 1965;65:127–132. doi: 10.1002/jcp.1030650115. [DOI] [PubMed] [Google Scholar]
- Jie MS, Cheng KL. Nuclear magnetic resonance spectroscopic analysis of homoallylic and bis homoallylic substituted methyl fatty ester derivatives. Lipids. 1995;30:115–120. doi: 10.1007/BF02538263. [DOI] [PubMed] [Google Scholar]
- Kaphalia BS, Carr JB, Ansari GA. Increased endobiotic fatty acid methyl esters following exposure to methanol. Fundam Appl Toxicol. 1995;28:264–273. doi: 10.1006/faat.1995.1167. [DOI] [PubMed] [Google Scholar]
- Kaphalia BS, Green SM, Ansari GA. Fatty acid ethyl and methyl ester synthases, and fatty acid anilide synthase in HepG2 and AR42J cells: interrelationships and inhibition by tri-o-tolyl phosphate. Toxicol Appl Pharmacol. 1999;159:134–141. doi: 10.1006/taap.1999.8724. [DOI] [PubMed] [Google Scholar]
- Kharbanda KK, Mailliard ME, Baldwin CR, Beckenhauer HC, Sorrell MF, Tuma DJ. Betaine attenuates alcoholic steatosis by restoring phosphatidylcholine generation via the phosphatidylethanolamine methyltransferase pathway. J Hepatol. 2007;46:314–321. doi: 10.1016/j.jhep.2006.08.024. [DOI] [PubMed] [Google Scholar]
- Kim SJ, Jung YS, Kwon do Y, Kim YC. Alleviation of acute ethanol-induced liver injury and impaired metabolomics of S-containing substances by betaine supplementation. Biochem Biophys Res Commun. 2008;368:893–898. doi: 10.1016/j.bbrc.2008.02.003. [DOI] [PubMed] [Google Scholar]
- Knothe G. Nuclear Magnetic Resonance Spectroscopy. In: Gunstone FD, Harwood JL, Dijkstra AJ, editors. The Lipid Handbook. Boca Raton: CRC Press; 2007. pp. 455–459. [Google Scholar]
- Lieber CS, Cao Q, DeCarli LM, Leo MA, Mak KM, Ponomarenko A, Ren C, Wang X. Role of medium-chain triglycerides in the alcohol-mediated cytochrome P450 2E1 induction of mitochondria. Alcohol Clin Exp Res. 2007;31:1660–1668. doi: 10.1111/j.1530-0277.2007.00475.x. [DOI] [PubMed] [Google Scholar]
- Lieber CS, DeCarli LM. Liquid diet technique of ethanol administration: 1989 update. Alcohol Alcohol. 1989;24:197–211. [PubMed] [Google Scholar]
- Lieber CS, Spritz N, DeCarli LM. Role of dietary, adipose, and endogenously synthesized fatty acids in the pathogenesis of the alcoholic fatty liver. J Clin Invest. 1966;45:51–62. doi: 10.1172/JCI105323. [DOI] [PMC free article] [PubMed] [Google Scholar]
- Lindon JC, Holmes E, Nicholson JK. Metabonomics: systems biology in pharmaceutical research and development. Curr Opin Mol Ther. 2004;6:265–272. [PubMed] [Google Scholar]
- Lu SC, Huang ZZ, Yang H, Mato JM, Avila MA, Tsukamoto H. Changes in methionine adenosyltransferase and S-adenosylmethionine homeostasis in alcoholic rat liver. Am J Physiol Gastrointest Liver Physiol. 2000;279:G178–G185. doi: 10.1152/ajpgi.2000.279.1.G178. [DOI] [PubMed] [Google Scholar]
- Matyash V, Liebisch G, Kurzchalia TV, Shevchenko A, Schwudke D. Lipid extraction by methyl-tert-butyl ether for high-throughput lipidomics. J Lipid Res. 2008;49:1137–1146. doi: 10.1194/jlr.D700041-JLR200. [DOI] [PMC free article] [PubMed] [Google Scholar]
- Meneses P, Glonek T. High resolution 31P NMR of extracted phospholipids. J Lipid Res. 1988;29:679–689. [PubMed] [Google Scholar]
- Nakae D. Endogenous liver carcinogenesis in the rat. Pathol Int. 1999;49:1028–1042. doi: 10.1046/j.1440-1827.1999.00990.x. [DOI] [PubMed] [Google Scholar]
- Nanji AA. Role of different dietary fatty acids in the pathogenesis of experimental alcoholic liver disease. Alcohol. 2004;34:21–25. doi: 10.1016/j.alcohol.2004.08.005. [DOI] [PubMed] [Google Scholar]
- NIAAA. 10th Special report to the U.S. Congress on Alcohol and Health. U.S. Department of Health and Human Services Research. 2000 [Google Scholar]
- Nicholas PC, Kim D, Crews FT, Macdonald JM. H-1 NMR-based metabolomic analysis of liver, serum, and brain following ethanol administration in rats. Chem Res Toxicol. 2008;21:408–420. doi: 10.1021/tx700324t. [DOI] [PubMed] [Google Scholar]
- Ojeda ML, Delgado-Villa MJ, Llopis R, Murillo ML, Carreras O. Lipid metabolism in ethanol-treated rat pups and adults: effects of folic Acid. Alcohol Alcohol. 2008;43:544–550. doi: 10.1093/alcalc/agn044. [DOI] [PubMed] [Google Scholar]
- Oostendorp M, Engelke UFH, Willemsen MAAP, Wevers RA. Diagnosing inborn errors of lipid metabolism with proton nuclear magnetic resonance spectroscopy. Clin Chem. 2006;52:1395–1405. doi: 10.1373/clinchem.2006.069112. [DOI] [PubMed] [Google Scholar]
- Pollesello P, Masutti F, Croce LS, Toffanin R, Eriksson O, Paoletti S, Hockerstedt K, Tiribelli C. 1H NMR spectroscopic studies of lipid extracts from human fatty liver. Biochem Biophys Res Commun. 1993;192:1217–1222. doi: 10.1006/bbrc.1993.1546. [DOI] [PubMed] [Google Scholar]
- Purohit V, Brenner DA. Mechanisms of alcohol-induced hepatic fibrosis: A summary of the Ron Thurman Symposium. Hepatology. 2006;43:872–878. doi: 10.1002/hep.21107. [DOI] [PubMed] [Google Scholar]
- Purohit V, Gao B, Song BJ. Molecular mechanisms of alcoholic fatty liver. Alcohol Clin Exp Res. 2009;33:191–205. doi: 10.1111/j.1530-0277.2008.00827.x. [DOI] [PMC free article] [PubMed] [Google Scholar]
- Purohit V, Khalsa J, Serrano J. Mechanisms of alcohol-associated cancers: introduction and summary of the symposium. Alcohol. 2005;35:155–160. doi: 10.1016/j.alcohol.2005.05.001. [DOI] [PubMed] [Google Scholar]
- Reid AE. Nonalcoholic steatohepatitis. Gastroenterology. 2001;121:710–723. doi: 10.1053/gast.2001.27126. [DOI] [PubMed] [Google Scholar]
- Reo NV, Adinehzadeh M, Foy BD. Kinetic analyses of liver phosphatidylcholine and phosphatidylethanolamine biosynthesis using (13)C NMR spectroscopy. Biochim Biophys Acta. 2002;1580:171–188. doi: 10.1016/s1388-1981(01)00202-5. [DOI] [PubMed] [Google Scholar]
- Ristic V, Vrbaski S, Lalic Z, Miric M. The effect of ethanol and diazepam on the fatty acid composition of plasma and liver phospholipids in the rat. Biol Pharm Bull. 1995;18:842–845. doi: 10.1248/bpb.18.842. [DOI] [PubMed] [Google Scholar]
- Roede JR, Orlicky DJ, Fisher AB, Petersen DR. Overexpression of peroxiredoxin 6 does not prevent ethanol-mediated oxidative stress and may play a role in hepatic lipid accumulation. J Pharmacol Expl Ther. 2009;330:79–88. doi: 10.1124/jpet.109.152983. [DOI] [PMC free article] [PubMed] [Google Scholar]
- Serkova NJ, Jackman M, Brown JL, Liu T, Hirose R, Roberts JP, Maher JJ, Niemann CU. Metabolic profiling of livers and blood from obese Zucker rats. J Hepatol. 2006;44:956–962. doi: 10.1016/j.jhep.2005.07.009. [DOI] [PubMed] [Google Scholar]
- Shi C, Wu CQ, Cao AM, Sheng HZ, Yan XZ, Liao MY. NMR-spectroscopy-based metabonomic approach to the analysis of Bay41–4109, a novel anti-HBV compound, induced hepatotoxicity in rats. Toxicol Lett. 2007;173:161–167. doi: 10.1016/j.toxlet.2007.07.010. [DOI] [PubMed] [Google Scholar]
- Solivera J, Cerdan S, Pascual JM, Barrios L, Roda JM. Assessment of 31P-NMR analysis of phospholipid profiles for potential differential diagnosis of human cerebral tumors. NMR Biomed. 2009;22:663–674. doi: 10.1002/nbm.1387. [DOI] [PubMed] [Google Scholar]
- Sundler R, Akesson B. Regulation of phospholipid biosynthesis in isolated rat hepatocytes. Effect of different substrates. J Biol Chem. 1975;250:3359–3367. [PubMed] [Google Scholar]
- Sze DY, Jardetzky O. Characterization of Lipid-Composition in Stimulated Human-Lymphocytes by H-1-Nmr. Biochim Biophys Acta. 1990;1054:198–206. doi: 10.1016/0167-4889(90)90241-5. [DOI] [PubMed] [Google Scholar]
- Tomita K, Tamiya G, Ando S, Kitamura N, Koizumi H, Kato S, Horie Y, Kaneko T, Azuma T, Nagata H, Ishii H, Hibi T. AICAR, an AMPK activator, has protective effects on alcohol-induced fatty liver in rats. Alcohol Clin Exp Res. 2005;29:240S–245S. doi: 10.1097/01.alc.0000191126.11479.69. [DOI] [PubMed] [Google Scholar]
- Treinen-Moslen M, Klassen CD, editors. Casarett & Doull’s Toxicology: The Basic Sciences of Poisons. 6th ed. McGraw-Hill; 2001. Toxic responses of the liver; pp. 471–489. [Google Scholar]
- Tugnoli V, Bottura G, Fini G, Reggiani A, Tinti A, Trinchero A, Tosi MR. H-1-NMR and C-13-NMR lipid profiles of human renal tissues. Biopolymers. 2003;72:86–95. doi: 10.1002/bip.10299. [DOI] [PubMed] [Google Scholar]
- van Meer G, Voelker DR, Feigenson GW. Membrane lipids: where they are and how they behave. Nat Rev Mol Cell Biol. 2008;9:112–124. doi: 10.1038/nrm2330. [DOI] [PMC free article] [PubMed] [Google Scholar]
- Wainfan E, Kilkenny M, Dizik M. Comparison of methyltransferase activities of pair-fed rats given adequate or methyl-deficient diets. Carcinogenesis. 1988;9:861–863. doi: 10.1093/carcin/9.5.861. [DOI] [PubMed] [Google Scholar]
- Wei L, Liao PQ, Wu HF, Li XJ, Pei FK, Li WS, Wu YJ. Toxicological effects of cinnabar in rats by NMR-based metabolic profiling of urine and serum. Toxicol Appl Pharm. 2008;227:417–429. doi: 10.1016/j.taap.2007.11.015. [DOI] [PubMed] [Google Scholar]
- Wendt VE, Wu C, Balcon R, Doty G, Bing RJ. Hemodynamic and Metabolic Effects of Chronic Alcoholism in Man. Am J Cardiol. 1965;15:175–184. doi: 10.1016/0002-9149(65)90452-2. [DOI] [PubMed] [Google Scholar]
- Wilson WK, Sumpter RM, Warren JJ, Rogers PS, Ruan BF, Schroepfer GJ. Analysis of unsaturated C-27 sterols by nuclear magnetic resonance spectroscopy. J Lipid Res. 1996;37:1529–1555. [PubMed] [Google Scholar]
- Yao ZM, Vance DE. The active synthesis of phosphatidylcholine is required for very low density lipoprotein secretion from rat hepatocytes. J Biol Chem. 1988;263:2998–3004. [PubMed] [Google Scholar]
- Yao ZM, Vance DE. Reduction in VLDL, but not HDL, in plasma of rats deficient in choline. Biochem Cell Biol. 1990;68:552–558. doi: 10.1139/o90-079. [DOI] [PubMed] [Google Scholar]
- Yap IK, Clayton TA, Tang H, Everett JR, Hanton G, Provost JP, Le Net JL, Charuel C, Lindon JC, Nicholson JK. An integrated metabonomic approach to describe temporal metabolic disregulation induced in the rat by the model hepatotoxin allyl formate. J Proteome Res. 2006;5:2675–2684. doi: 10.1021/pr0601584. [DOI] [PubMed] [Google Scholar]
- Yin HQ, Kim M, Kim JH, Kong G, Kang KS, Kim HL, Yoon BI, Lee MO, Lee BH. Differential gene expression and lipid metabolism in fatty liver induced by acute ethanol treatment in mice. Toxicol Appl Pharmacol. 2007;223:225–233. doi: 10.1016/j.taap.2007.06.018. [DOI] [PubMed] [Google Scholar]
- Yin HQ, Kim YC, Chung YS, Shin YK, Lee BH. Honokiol reverses alcoholic fatty liver by inhibiting the maturation of sterol regulatory element binding protein-1c and the expression of its downstream lipogenesis genes. Toxicol Appl Pharmacol. 2009;236:124–130. doi: 10.1016/j.taap.2008.12.030. [DOI] [PubMed] [Google Scholar]
- You M, Crabb DW. Recent advances in alcoholic liver disease II. Minireview: molecular mechanisms of alcoholic fatty liver. Am J Physiol Gastrointest Liver Physiol. 2004;287:G1–G6. doi: 10.1152/ajpgi.00056.2004. [DOI] [PubMed] [Google Scholar]
- You M, Fischer M, Deeg MA, Crabb DW. Ethanol induces fatty acid synthesis pathways by activation of sterol regulatory element-binding protein (SREBP) J Biol Chem. 2002;277:29342–29347. doi: 10.1074/jbc.M202411200. [DOI] [PubMed] [Google Scholar]
- Zatz M, Dudley PA, Kloog Y, Markey SP. Nonpolar lipid methylation. Biosynthesis of fatty acid methyl esters by rat lung membranes using S-adenosylmethionine. J Biol Chem. 1981;256:10028–10032. [PubMed] [Google Scholar]
Associated Data
This section collects any data citations, data availability statements, or supplementary materials included in this article.