Abstract
The goal of this paper was to investigate the benefits that could be realistically achieved on a microCT imaging system with an energy-resolved photon-counting x-ray detector. To this end, we built and evaluated a prototype microCT system based on such a detector. The detector is based on cadmium telluride (CdTe) radiation sensors and application-specific integrated circuit (ASIC) readouts. Each detector pixel can simultaneously count x-ray photons above six energy thresholds, providing the capability for energy-selective x-ray imaging. We tested the spectroscopic performance of the system using polychromatic x-ray radiation and various filtering materials with Kabsorption edges. Tomographic images were then acquired of a cylindrical PMMA phantom containing holes filled with various materials. Results were also compared with those acquired using an intensity-integrating x-ray detector and single-energy (i.e. non-energy-selective) CT. This paper describes the functionality and performance of the system, and presents preliminary spectroscopic and tomographic results. The spectroscopic experiments showed that the energy-resolved photon-counting detector was capable of measuring energy spectra from polychromatic sources like a standard x-ray tube, and resolving absorption edges present in the energy range used for imaging. However, the spectral quality was degraded by spectral distortions resulting from degrading factors, including finite energy resolution and charge sharing. We developed a simple charge-sharing model to reproduce these distortions. The tomographic experiments showed that the availability of multiple energy thresholds in the photon-counting detector allowed us to simultaneously measure target-to-background contrasts in different energy ranges. Compared with single-energy CT with an integrating detector, this feature was especially useful to improve differentiation of materials with different attenuation coefficient energy dependences.
1. Introduction
Conventional x-ray detectors integrate the total electrical current produced in the radiation sensor and disregard the charge amplitude from individual photon detection events. The charge amplitude from each event is proportional to the photon’s detected energy. During this integration, both the detector leakage current and charges resulting from x-ray detection are summed and measured, and provide no information about the energy of individual photons or the dependence of the attenuation coefficients in the object.
A novel alternative to these detectors is photon-counting x-ray detectors that count individual x-ray photons interacting in each pixel of the detector. Energy-resolved photon counting with multiple energy thresholds provides the additional capability of counting photons based on their detected energies (Bert et al 2003, Beuville et al 1998, Schlomka et al 2008, Shikhaliev et al 2005). These capabilities have been made possible by the availability of fast semiconductor radiation sensor materials (e.g., Si, CdTe, GaAs), which support relatively short charge collection periods (e.g., 50 ns or less) and provide good energy resolution, combined with application-specific integrated circuits (ASICs) suitable for multi-pixel parallel readout and fast counting.
Photon-counting detectors have a number of potential advantages. First, photon counting provides more optimal weighting than intensity integrating, resulting in lower noise and better contrast (Frey et al 2007a). This capability can benefit either conventional (i.e. non-energy-selective) CT or energy-selective (e.g., dual-energy) CT.
Second, the ability to resolve energies allows energy-selective imaging with a single x-ray exposure. Such detectors acquire simultaneous measurements of the x-ray photon flux above one or more user-defined energy thresholds. These data can be used to obtain the x-ray photon flux in a set of non-overlapping energy windows. Therefore measurements from such detectors can be used to perform energy-selective x-ray CT imaging and provide information about the energy dependence of the attenuation coefficients of the materials in the object and, through these, about the chemical elements present (Feuerlein et al 2008, Alvarez and Macovski 1976). For example, different target materials can be more efficiently and quantitatively identified and differentiated (Schlomka et al 2008, Cormode et al 2010) using an energy-resolved photon-counting CT system.
In our previous work (Frey et al 2007b), simulations have shown that the advantage from photon counting (without energy resolving capability) was small for conventional CT and basis material decomposition. The largest advantage was from the energy resolving capability where better weighting improved the contrast-to-noise ratio and the multiple energy windows resulted in improved basis decomposition. Thus this paper will concentrate on applications that use the energy resolving capability in an effort to demonstrate the extent to which current photon-counting detectors can reach the potential seen in simulations and to determine challenges and problems that must be addressed to realize these potentials in the future.
In this study we used a detector that we developed and that is based on cadmium telluride (CdTe) radiation sensors and an ASIC for energy-resolved photon counting (Mikkelsen et al 2008). This paper will describe the detector hardware and system configuration and present results from studies characterizing its spectral performance. In previous work (Wang et al 2011) we concentrated on one method to use the energy information, i.e. the use of multiple energy windows to allow simultaneous separation of materials having K-absorption edges in the energy range used for imaging. Thus in this work we concentrate on the other potential use of the energy information, i.e. the potential to use the energy information to provide improved contrast between materials when appropriate energy windows are used.
Finally, in studying the spectral performance we observed some degradation in the energy spectrum at low energies that could reduce the utility of the energy information. We believe these degradations are due to charge-sharing effects, i.e. where energy from a photon incident in one detector pixel results in a count in both that pixel and a neighboring pixel with both counts having incorrect recorded energies. We developed a simple model of this effect that is able to reproduce the spectral distortions, and we discuss this model in the context of the physical effects that could result in charge sharing.
2. Methods
2.1. Energy-resolved photon-counting x-ray detector
The energy-resolved photon-counting detector used in this work is housed in a sealed aluminum enclosure.
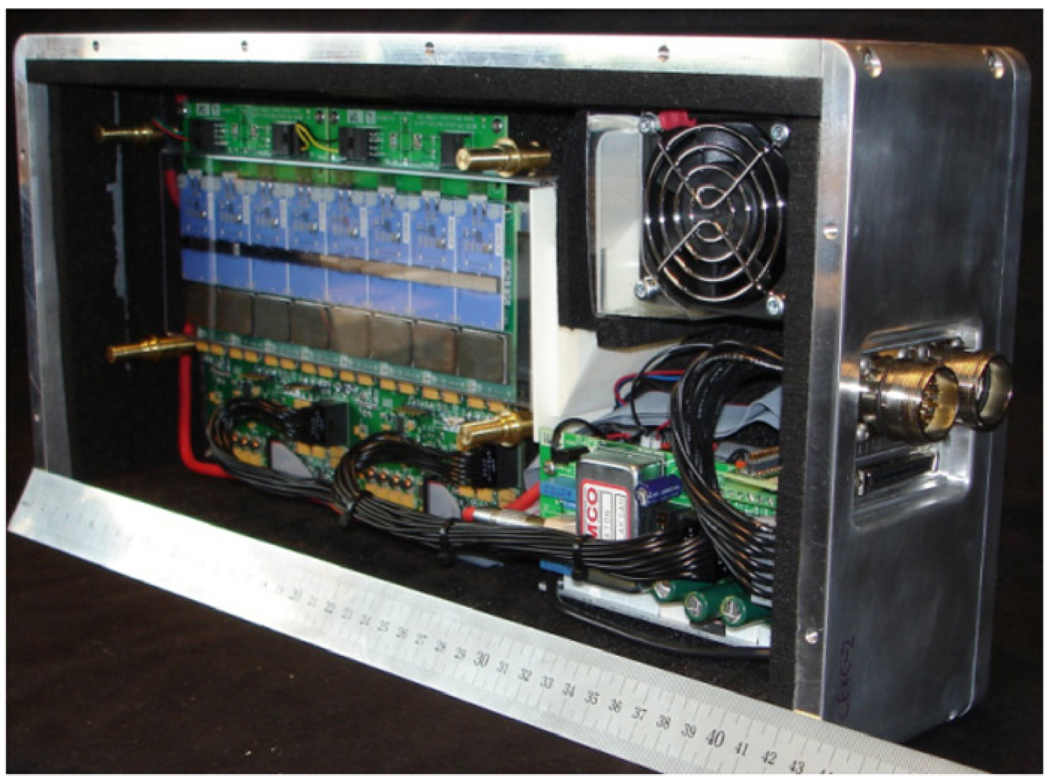
Figure 1 shows a picture of the radiation sensor and the electronics inside the detector enclosure with the aluminum cover and the radiation collimator removed. The specifications of the detector are summarized in table 1. The interior temperature of the detector is regulated by a Peltier-based cooler to maintain a stable interior air temperature of ~25 °C.
Figure 1.
Photograph of the energy-resolved photon-counting x-ray detector.
Table 1.
Specifications of the photon-counting detector.
| Enclosure size | 42 × 22 × 9 cm3 |
| Total weight | 10 kg (lead collimator incl.) |
| Supply voltage | ±5 V, and +12 V |
| Total power | 2.2 W |
| Operating temperature | Room temperature (~ 25 °C) |
| Radiation sensor | Cadmium telluride (CdTe) |
| Number of pixels | 512 |
| Pixel pitch | 0.4 mm |
| Sensor sensitive volume | 204.8 × 2.5 × 3 mm3 |
| Energy range | 25–122 keV |
| Energy resolution | 10 keV FWHM at 122 keV |
| Count rate | 106 cps/pixel at 20% loss 2.2 × 10⁶ cps/pixel at saturation |
| Readout | 16 32-channel ASICs |
| Counter dynamic range | 16-bit per counter (0–65535) 1 overflow bit |
| Number of energy thresholds | 6 |
2.1.1. Radiation sensor and collimator
The radiation sensor of the photon-counting detector is made from 3mmthick CdTe layer (Acrorad Co. Ltd, Japan) and forms a line with a sensitive length of 204.8 mm. The line detector has 512 imaging pixels, formed by a set of strip anodes with a pitch of 0.4 mm along the crystal length direction, and a width of 1.6 mm.
The incident x-ray beam is collimated by a lead slit collimator (not shown in figure 1) centered above the radiation sensor. The slit width is adjustable in the range of 0.5 to 1.5 mm. In this study we used a width of 1.2 mm. The aluminum-protective cover (not shown in figure 1) is milled down to a thickness of 2 mm where the opening slit of the collimator is located. Therefore the incident x-ray beam is always attenuated by a 2 mm aluminum layer. In the future we plan to remove this 2 mm aluminum layer from the detector entrance window and replace it with less attenuating materials.
2.1.2. ASICs
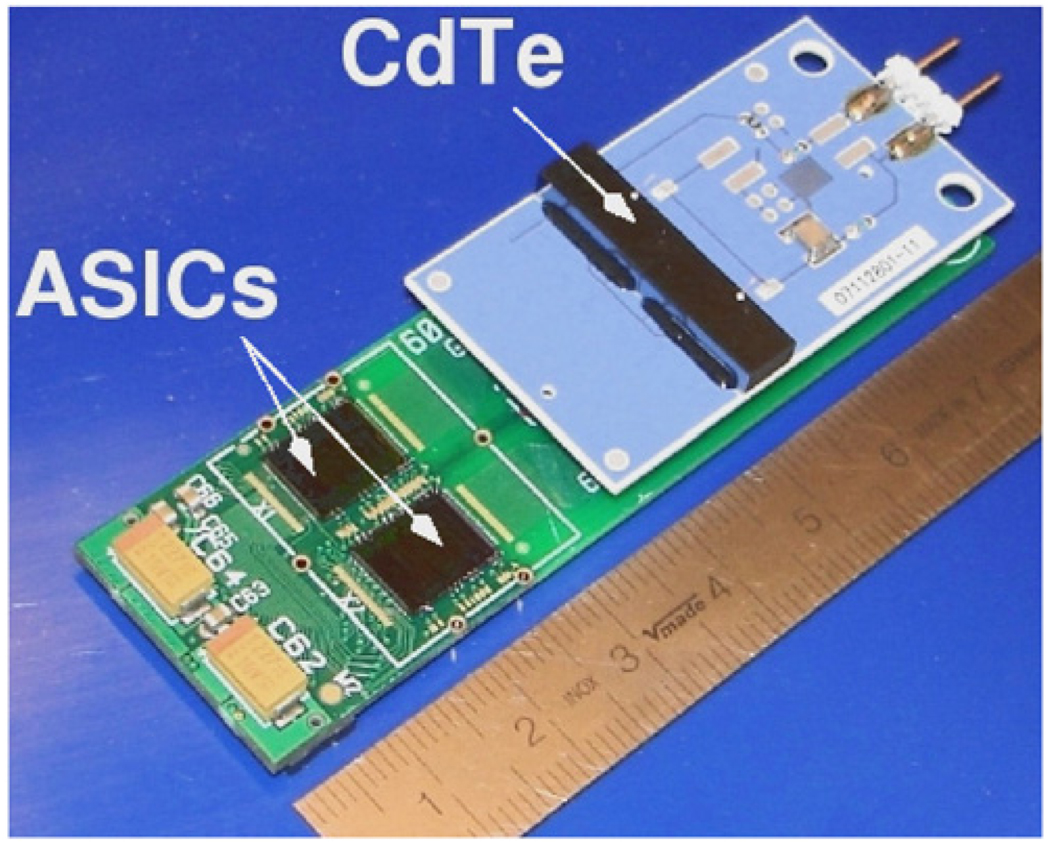
The row of 512 pixels is comprised of two detector modules each containing eight 32-channel custom-made ASICs. Figure 2 shows one piece of CdTe crystal and two ASICs. The crystal is bump bonded to a ceramic printed circuit board that has aluminum traces leading to a fine pitch connector. The connector plugs into a mating connector that is soldered to an FR4 printed circuit board. The ASICs are wire bonded onto this FR4 printed circuit board. Digital frame data can be transmitted from the ASICs at regular intervals to an external computer via an FPGA resident in the detector.
Figure 2.
Picture of the CdTe detection crystal and readout ASICs.
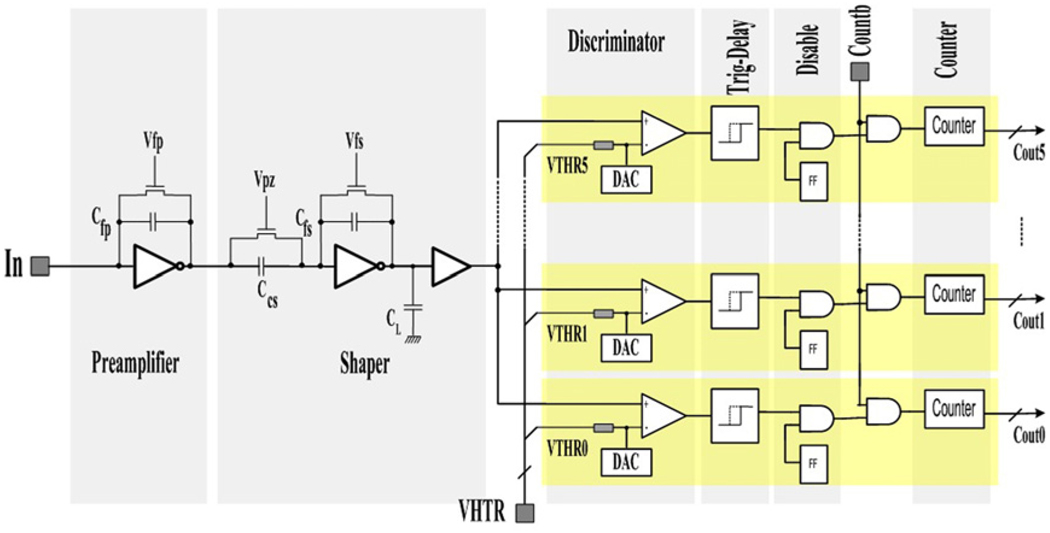
A schematic of the readout circuitry of a detector pixel is illustrated in figure 3. Each pixel is connected to a preamplifier followed by a CR-RC shaping amplifier with pole-zero compensation to improve the signal-to-noise ratio. The shaping time for the shaping amplifier was set to approximately 50 ns to provide high-count-rate performance.
Figure 3.
A schematic drawing of the ASIC readout of a detector pixel.
The output of the analog stage is connected to six amplitude discriminator circuits. The discriminator thresholds are globally programmable via a global digital-to-analog converter (DAC). In addition, each threshold for each pixel can be further adjusted via a trim-DAC. These trim-DACs allow one to individually adjust the thresholds so that they are aligned relative to each other. This allows compensation for differences in pixel gains and offset voltages arising from process variations during manufacturing process. The output of each discriminator is connected to a one-shot circuit with a pulse length set to ~250 ns. The net result is that when the input amplitude exceeds the threshold a single pulse is produced. Another pulse can be produced only after an interval of 250 ns and when the previous pulse falls below the threshold.
The pulses produced by the threshold circuit are counted by a 17-bit counter (the 17th bit is latched to detect overflow). Thus the counter increments only if the pulse height out of the analog stage exceeds the discriminator threshold, and at most one count is registered every 250 ns. There is a separate counter for each pixel and threshold. The digital counter values can be read out upon request. All the counters can be reset, started and stopped at the same time via a common control signal. Prior to readout to the computer, all counter values are transferred at high speed to a readout buffer so that the ASIC can continue counting during the time the counter values are read out by the computer.
The six discriminators for each pixel act in parallel, allowing simultaneous acquisition of counts above six independent energy thresholds. Subtracting the counts from pairs of thresholds provides the number of counts in an energy window defined by the two thresholds. As a result, six energy windows are available, with the highest window having no upper threshold. In this work we typically set the highest threshold at an energy corresponding to the x-ray tube voltage; the counts from the corresponding counter thus represented pulse pileup only and were discarded. The default energy thresholds were factory calibrated using photons emitted by Co-57 and Am-241 radionuclide sources.
2.2. X-ray microCT system prototype
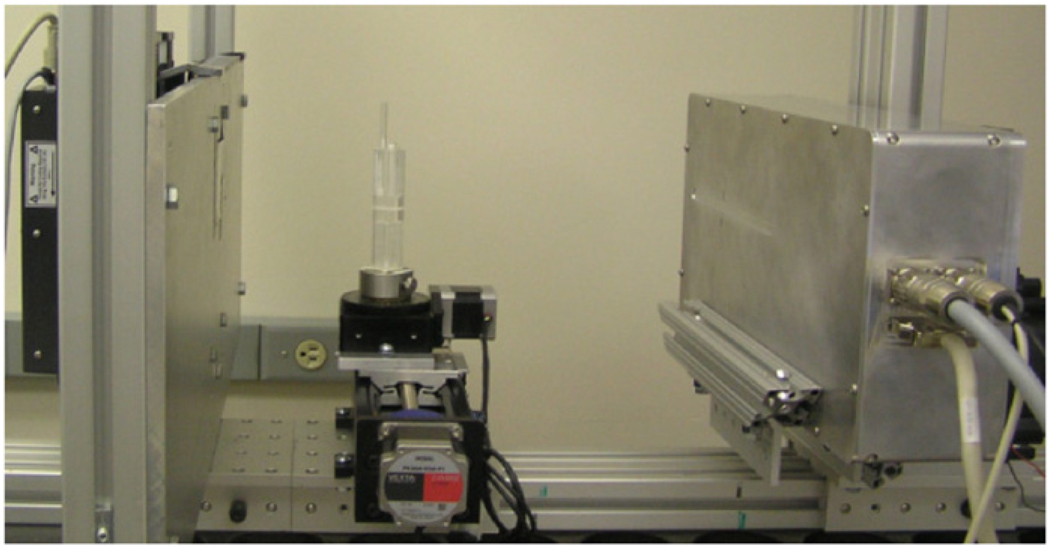
We installed the energy-resolved photon-counting detector in a benchtop microCT system (figure 4). This system consisted of a SourceRay SB-120–350 x-ray generator system (SourceRay Inc., Bohemia, NY) capable of tube currents and voltages of 350 µA and 120 kV, respectively. The tube had a 75 µm focal spot and a 0.75 mm thick beryllium exit window. Since the detector consisted of only one row of active pixels, the x-ray tube was collimated by a 1.6 mm wide lead slit to provide a fan beam of x-ray irradiation. We aligned the fan beam with the radiation sensor to maximize direct x-ray illumination of the detector. For some experiments, additional external filters were used to shape the output spectra as needed for the specific application.
Figure 4.
MicroCT experimental setup with the x-ray tube on the left, the rotary stage in the middle, and the detector on the right.
A commercial motor-controlled rotary stage (Velmex Inc., Bloomfield, NY) was positioned between the x-ray generator system and the detector in order to rotate the imaged object and acquire projections for tomographic reconstruction. In most acquisitions we positioned the detector 88.8 cm from the x-ray tube focal spot, while the phantom rotational stage was 20.3 cm from the tube focal spot. Hence magnification was ~4.37 and the expected spatial resolution at isocenter was ~0.09 mm. The field of view at isocenter was ~ 4.7 cm.
2.3. Phantom
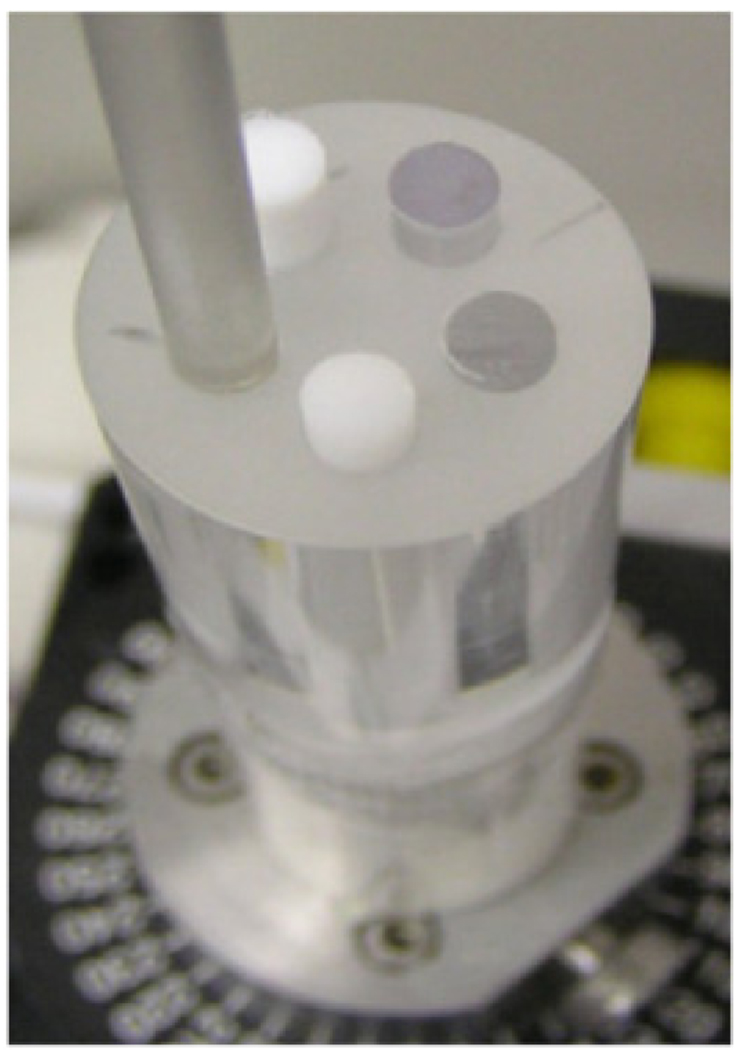
We used a cylindrical phantom with a 2.54 cm diameter circular cross section (figure 5). The phantom was made of polymethyl methacrylate (PMMA, or acrylic) and had five 4.8 mm diameter holes drilled at equiangular intervals parallel to the cylinder’s axis on a radius of 6.25 mm. The holes could be filled with various solid or liquid materials. Table 2 summarizes the materials that were imaged, which included the following three categories of materials:
soft-tissue-like materials: water, PMMA, polytetrafluoroethylene (PTFE), polyoxymethylene (POM), glycol-modified polyethylene terephthalate (PET) and polycarbonate;
bone-like material: bone-equivalent plastic;
contrast agents having K-edges in the energy range of interest: aqueous solutions of an iodated contrast agent, Omnipaque™350.
Figure 5.
The PMMA cylindrical phantom with holes containing various materials.
Table 2.
Summary of the investigated materials.
| Material name | Formula | Mass density (g cm−3) |
|---|---|---|
| Water | H2O | 1.00 |
| PMMA | (C5H2O8)n | 1.19 |
| POM | (CH2O)n | 1.40–1.50 |
| PTFE | CnF2n+2 | 2.20 |
| PET | (C10H8O4)n | 1.45 |
| Polycarbonate | (C16H14O3)n | 1.20 |
| Bone-equivalent plastic | N/A | 1.42 |
| Omnipaque™350 | C19H26I3N3O9 | N/A |
2.4. Spectroscopic experiments
This detector could be used to measure the spectra of polychromatic x-ray radiation. To achieve this, one or several threshold(s) were swept through a pre-set energy range with a small, pre-set energy step. By numerically differentiating the data we obtained the energy spectrum. In this study we used this method to measure the output x-ray spectra from the x-ray tube. The x-ray tube output was filtered with a 0.794 mm thick aluminum sheet. There was no other filtering between the tube and the detector. A tube current of 50 µA was used and the resulting count rate was approximately 4 × 10⁴ cps/pixel for the 80 kVp spectrum. For this study, we kept the count rate relatively low to reduce the effects of pulse pileup.
Furthermore, filtering materials with K-absorption edges in the energy range of interest were also used (table 3), in addition to the previously mentioned 0.794 mm aluminum sheet, in order to investigate the detector’s ability to resolve the discontinuous changes in x-ray attenuation and the resulting spectra at K-edge energies. To use liquids (i.e. Magnevist™ or Omnipaque™350) as filters, a syringe filled with the solution was placed in front of the x-ray tube exit window, and the thickness of the filter corresponded to the internal diameter of the syringe.
Table 3.
Filtering materials and their K-edge energies.
| Filtering material |
Thickness (mm) |
Element of interest |
K-edge energy (keV) |
|---|---|---|---|
| Tin sheet | 0.05 | Tin | 29.2 |
| 50% Magnevist™ solution | 10 | Gadolinium | 50.2 |
| 5% Omnipaque™350 solution | 10 | Iodine | 33.2 |
These spectral measurements provided important information to aid in understanding the spectral response of the detector and to model and compensate for the physical degrading factors present in the detector. The characteristic peaks and endpoints in the polychromatic x-ray spectra (section 3.1) were investigated in terms of their potential use for calibration of the energy threshold DAC values in units of keV. This is desirable as it would be more practical than using measurements from monochromatic radiation sources such as synchrotron radiation or radionuclide sources.
For comparison purposes, we also measured the spectra from the x-ray tube with the same source filters (0.794 mm aluminum sheet, and K-edge materials listed in table 3 when applicable) using a commercial spectrometer (XR-100T-CdTe, Amptek Inc., Bedford, MA). This spectrometer is comprised of a 1 mm thick CdTe radiation sensor, digital pulse processor and multi-channel analyzer. The count rate capability of this device is much lower than our photon-counting detector, so we used a 200 µm diameter collimator (provided by Amptek) in front of the spectrometer to reduce the photon flux. A 2 mm thick aluminum sheet was also placed in front of the spectrometer entrance window to mimic the effect of the 2 mm thick aluminum protection cover in front of the CdTe sensor of the energy-resolved photon-counting detector. Due to its superior energy resolution (<1.2 keV FWHM) and readout electronics, the spectrometer is capable of providing much more accurate measurements of the x-ray spectrum than photon-counting detectors intended for high count rate x-ray imaging. Therefore, measurements made using the spectrometer are, after correction for the sensor thickness, very good approximations of the true spectra. These results were compared with the spectra acquired using the energy-resolved photon-counting detector in order to show the spectral degradations. For convenience, in the remainder of this paper, we may use “photon-counting detector” to specifically refer to the energy-resolved photon-counting detector (although technically the spectrometer is also a photon-counting detector).
2.5. X-ray computed tomography experiments: ring reduction and contrast analysis
2.5.1. Tomographic acquisition
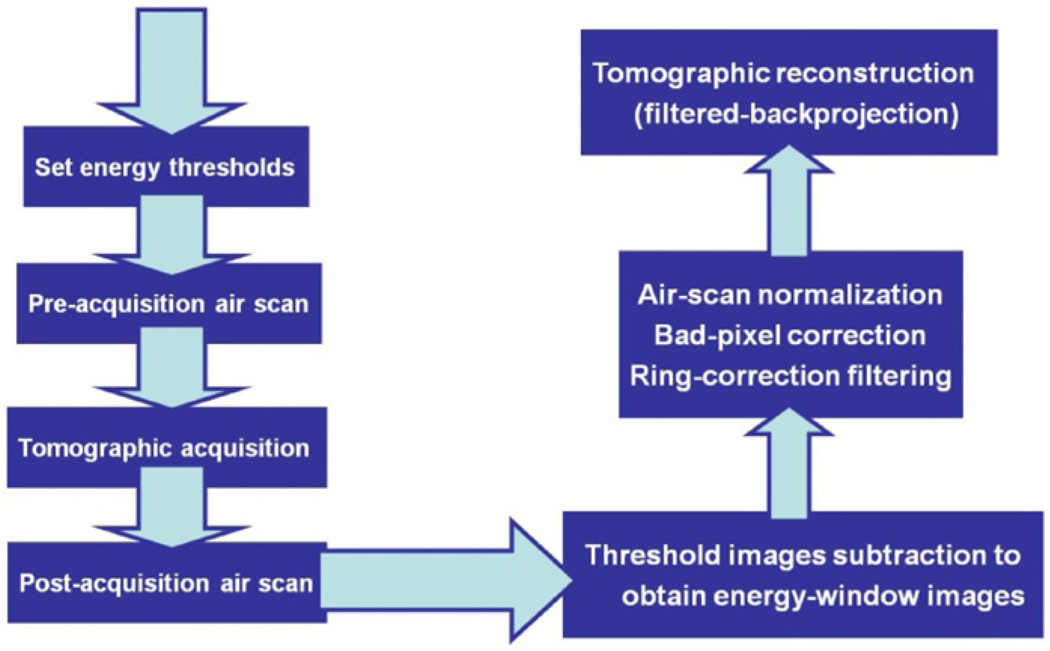
Figure 6 describes the procedure we used to obtain tomographic images from different x-ray energies. The x-ray tube output was filtered with a 0.794 mm thick aluminum sheet, as in the spectroscopic experiments. There was no other filtering between the tube and the phantom. During experiments involving contrast agents in the phantom, we usually set one energy threshold at each K-absorption edge, one at the tube voltage, and distributed the other thresholds such that the number of counts between adjacent energy thresholds was approximately equal. The counter for each energy threshold counted the number of photons with energies greater than the energy corresponding to the threshold voltage. Thus, subtracting the detected counts acquired using a higher energy threshold from those using the next lower threshold gave the projection in the corresponding energy window.
Figure 6.
Flowchart of the tomographic experiments.
We discarded any counts above the tube voltage threshold as they resulted from pulse pileup only. Combined with the aforementioned subtraction procedure for all thresholds, this provided us with projection data in five non-overlapping energy windows from a single x-ray exposure.
We acquired projection images of the phantom by rotating the phantom in 1° or 0.5° increments. For reconstruction simplicity, we acquired data from a full 360° rotation, even though a smaller angular range would have been sufficient for exact reconstruction. We divided the energy-binned projections by the corresponding air-scan images and took the negative logarithm to obtain the line integrals of the average linear attenuation coefficients μ̃ along the path:
| (1) |
Equation (1) is an approximation since polychromatic incident radiation was used. The attenuated intensity, Iout, was measured with the phantom in the beam, and the incident intensity, Iincident, was measured with the phantom removed from the beam (i.e. an air scan). Since the linear attenuation coefficient depends on the x-ray energy, the measured linear attenuation coefficient, μ̃, in (1) represents a weighted average attenuation over the energy window that depends on the incident spectrum and the thickness and types of materials along the path. Since the energy windows used were relatively narrow and the phantom was small, beam hardening effects were correspondingly small. Given ∫ μ̃ dl at various projection views, μ̃ within the object was reconstructed by fan-beam-filtered backprojection algorithms.
2.5.2. Ring artifacts reduction
In a previous study (Frey et al 2007b) using an earlier generation photon-counting x-ray detector, we observed visible ring artifacts due to energy-dependent detector sensitivity variations. One source of these inter-pixel variations may be variation of the actual energy thresholds among individual detector pixels (Wang et al 2008).
The current detector was equipped with threshold tuning trim-DACs (section 2.1 and figure 3). To provide better matching of the thresholds in the hope of reducing ring artifacts, we carefully adjusted the tuning circuits by varying the 4-bit trim-DAC values for each pixel to equalize, as best as possible, the energy response for all the good pixels in the detector.
To achieve this, before an object scan, we scanned the trim-DAC values for the pixels and obtained the number of counts above each threshold for x-ray tube kVp settings of 80 and 120 kVp. We selected the optimal trim-DAC setting as the one that gave the least variation across pixels in the ratio of the counts for 80 kVp divided by the counts for 120 kVp. Further ring suppression could be obtained with the use of post-acquisition ring correction methods such as a method based on basis material decomposition that corrects for inter-pixel variations in energy response in the sinogram (Wang et al 2008) and filters designed to suppress rings in the sinogram’s Fourier domain (Raven 1998).
2.5.3. Analysis of contrast energy dependence
To evaluate the effect of energy window on reconstructed image contrast, we computed the average linear attenuation coefficient, μ̃, for each of the different target materials and the PMMA cylinder background over 20 × 10 pixel2 rectangular regions of interest in reconstructed images for every energy window. The corresponding standard deviation, σ, was computed over multiple noise realizations via bootstrapping. Both the photon-counting detector and Shad-o-Box™1024 (introduced below) were programmed to acquire multiple frames of data sequentially at one projection position, with each frame statistically independent of the others. The bootstrapping was implemented by randomly sampling from the multiple frames (e.g., 400 out of 2000 frames) acquired at one projection and summing them to obtain one noise realization.
For each energy window the contrast and the contrast-to-noise ratio (CNR)were computed using
| (2) |
| (3) |
To demonstrate the potential of energy-selective imaging using a photon-counting detector, we also performed non-energy-selective tomographic imaging using an intensity-integrating x-ray detector (Shad-o-Box™1024, by Rad-icon Imaging Corp., Sunnyvale, CA). The Shad-o-Box™1024 is a commercial intensity-integrating x-ray detector consisting of a Gd2O2S scintillator screen and a CMOS photodiode array for light readout. It has 1024 × 1024 square pixels with a 48 µm pitch. Given its small sensor area (50 × 50 mm2), during experiments with the Shad-o-Box™1024, the phantom was placed very close to the camera (magnification ~1.05). The FOV at the isocenter was approximately 4.76 cm, similar to that of the photon-counting detector.
Based on the differences in pixel pitch between the two detectors and the current system magnification, projection data from Shad-o-Box™1024 were binned into larger pixels such that the effective pixel size at the isocenter was approximately identical for two detectors.
Due to the low sensitivity and low fluorescence yield of the phosphor screen and the resulting low overall efficiency, shot noise due to statistical variations in the number of detected fluorescence photons, and the dark current and electronic noise, the Shad-o-Box™1024 requires a much larger incident x-ray flux to produce an image with the same noise level as a semiconductor-based direct-conversion detector such as the photon-counting detector and the spectrometer. As a result, the Shad-o-Box™1024 was operated with a larger x-ray tube current to minimize these effects and provide images with qualitatively similar noise properties. By contrast, operation in counting mode eliminates dark currents and shot noise and the higher conversion efficiency of semiconductor sensors allows the use of a much lower photon flux (Knoll 1999). We used lower tube currents when imaging with the photon-counting detector in order to minimize pulse pileup effects (Frey et al 2007b, Taguchi et al 2010).
3. Results
3.1. Spectroscopic experiments
3.1.1. Measuring polychromatic spectra from an x-ray tube
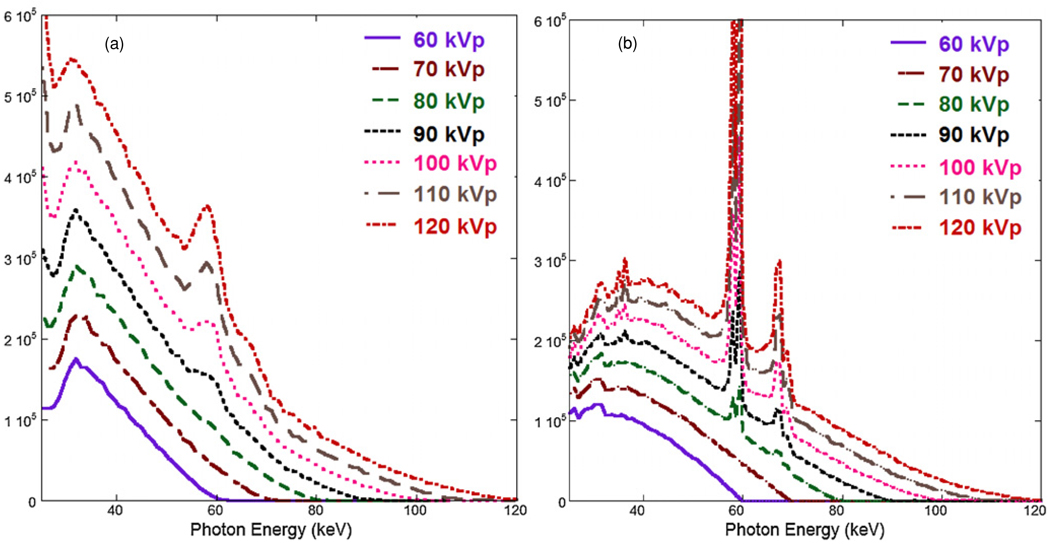
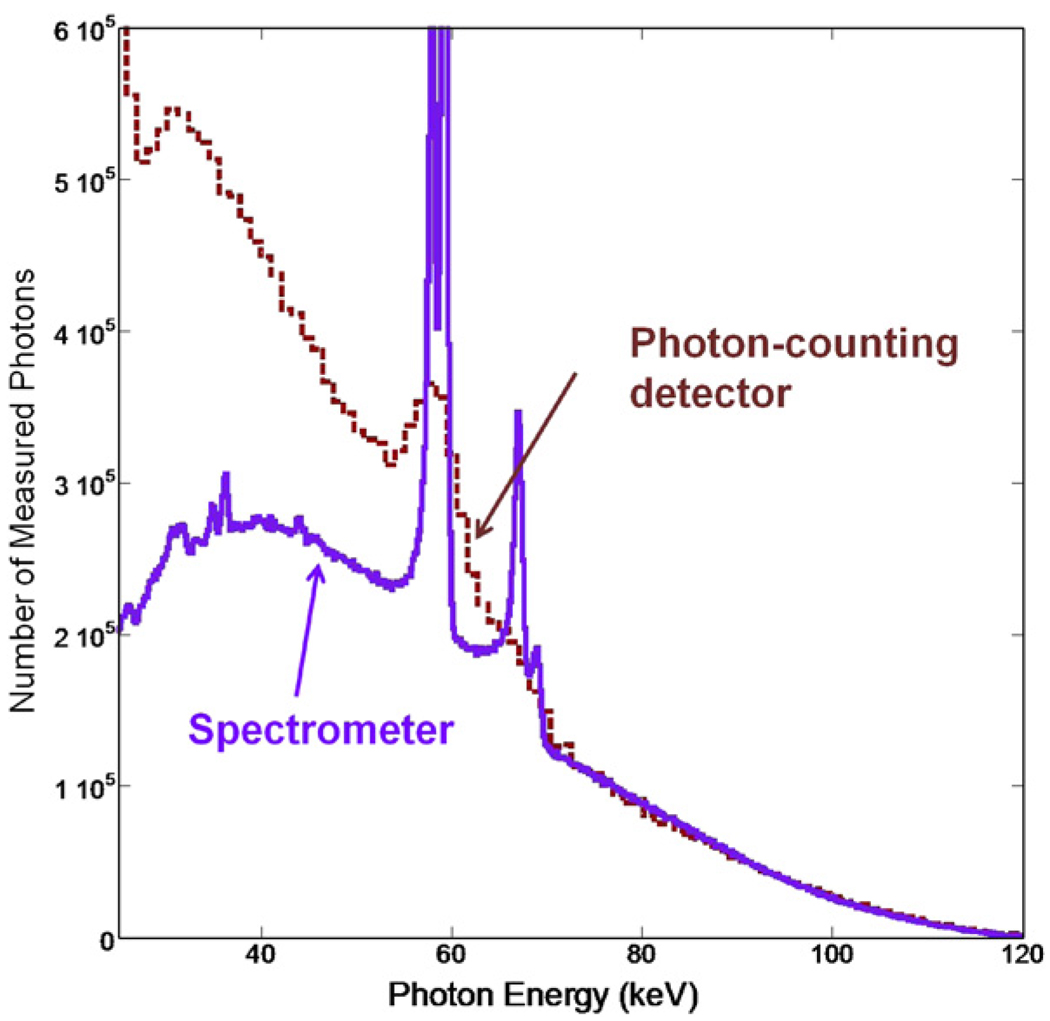
Figure 7(a) plots the polychromatic spectra measured with the energy-resolved photon-counting detector for tube voltages from 60 to 120 kV (50 µA) in steps of 10 kV for a typical pixel. The spectra were normalized to the same mAs before plotting to illustrate the spectral shape. Figure 7(b) shows spectra obtained from the spectrometer with the same tube voltage. To provide direct comparison, figure 8 simultaneously plots the 120 kVp (50 µA) measurements from both devices.
Figure 7.
Output spectra of the SB-120–350 x-ray generator system measured with (a) the energy-resolved photon-counting detector and (b) the spectrometer.
Figure 8.
120 kVp (50 µA) tube spectrum measured with the energy-resolved photon-counting detector and the spectrometer.
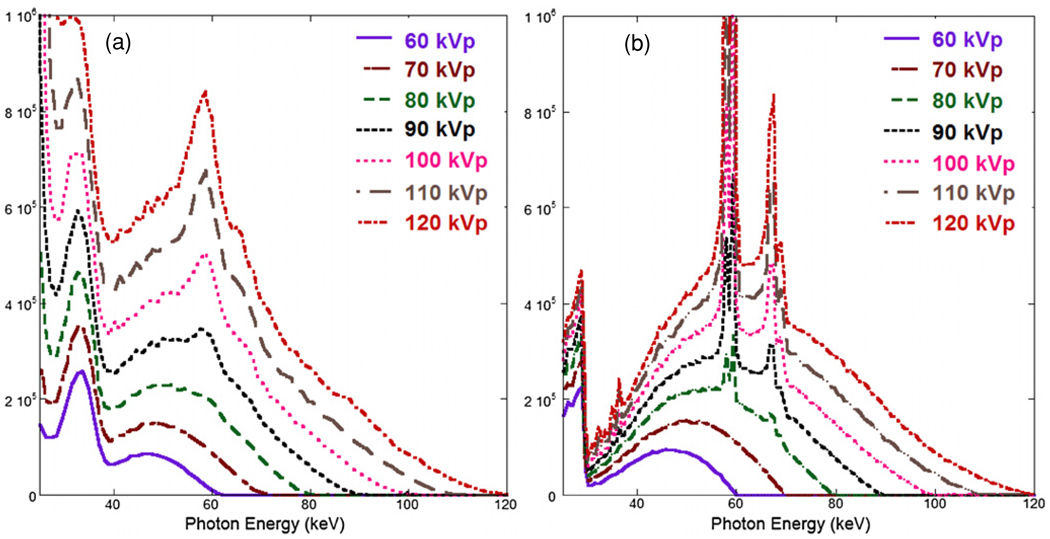
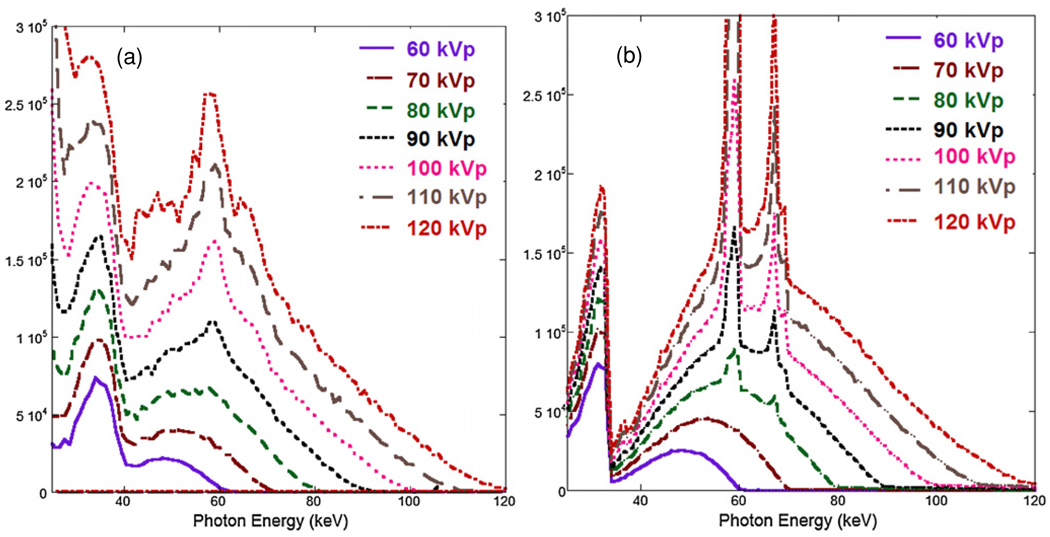
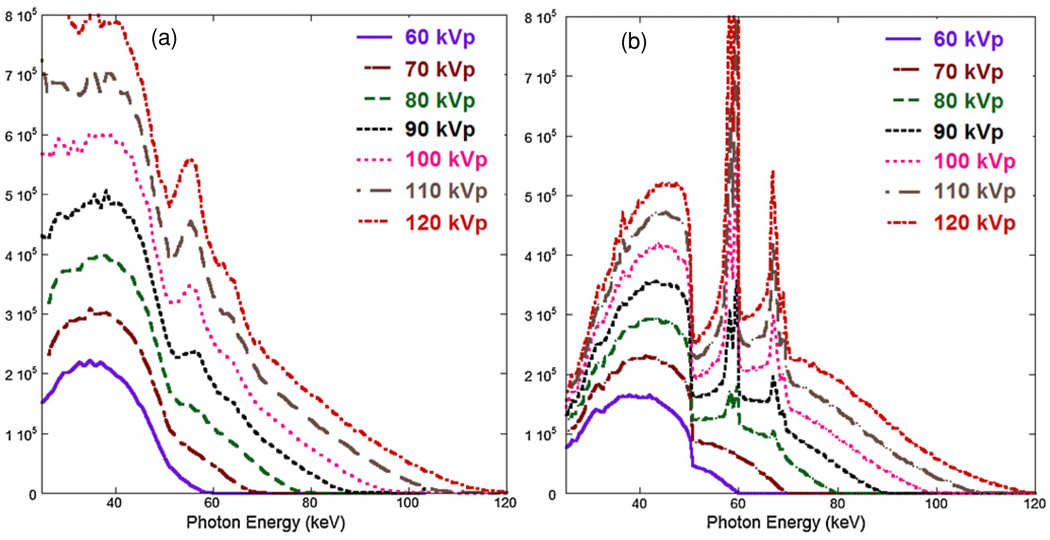
For the energy-resolved photon-counting detector, the tungsten characteristic x-ray Kα lines (57–59 keV) were visible for tube voltages above 90 kV. Due to its inferior energy resolution (~10 keV FWHM at 122 keV) compared with the spectrometer, in the spectra from the photon-counting detector the peaks were significantly broadened and the lower abundance Kβ lines (67–68 keV) were not visible (only a bump). This difference is understandable, since the single-pixel spectrometer was optimized for energy resolution and supported by sophisticated signal processing circuits, which are not feasible on a multi-pixel x-ray detector designed for imaging purposes. In comparison, the photon-counting detector was primarily optimized for count rate performance.
In addition to degradation due to poorer energy resolution, spectra from the photon-counting detector exhibited a significant excess of detected events at lower energies. Degrading factors such as energy resolution and pulse pileup do not account for these discrepancies. We suspect a combination of charge sharing and electronic noise to be the major contributors. This will be further discussed in section 3.1.3.
3.1.2. Measuring K-absorption edges in polychromatic spectra
Figures 9–11 show the energy spectra measured with the energy-resolved detector and the spectrometer for various tube voltages filtered through absorbers containing tin (figure 9), gadolinium (figure 10) and iodine (figure 11). The energy-resolved photon-counting detector was capable of effectively resolving the K-absorption edges for various target materials, but the edges were blurred and widened compared to the spectrometer due to its inferior energy resolution, just as for the tungsten characteristic x-ray lines. One major difference, consistent with the findings in section 3.1.1, is the excess of detected photons at lower energies in spectra from the photon-counting detector.
Figure 9.
X-ray tube output spectra filtered by a tin sheet, and measured with (a) the energy-resolved photon-counting detector and (b) the spectrometer.
Figure 11.
X-ray tube output spectra filtered by the Omnipaque™350 iodine-based contrast agent solution, and measured with (a) the energy-resolved photon-counting detector and (b) the spectrometer.
Figure 10.
X-ray tube output spectra filtered by the Magnevist™ gadolinium-based contrast agent solution, and measured with (a) the energy-resolved photon-counting detector and (b) the spectrometer.
The capability to resolve the K-edges can be potentially useful for calibration of the energy threshold DAC values using a polychromatic x-ray source. Energy calibration is often done using radionuclide sources whose discrete energies are used as calibration points. However, regulatory issues, low count rates, and cost associated with radionuclide sources limit their practicality. Thus the features provided by K-absorption edges and polychromatic beams may be a convenient alternative.
3.1.3. Spectral distortions due to charge sharing
We conjectured that the increased low-energy counts observed previously for the photon-counting detector were due to charge sharing between detector pixels. Since the radiation sensor is electrically, not physically, pixelated, the carrier charge generated from x-ray interactions can undergo a non-negligible spreading as it drifts toward the electrode, and induce current signals in more than one pixel. In addition, energetic photoelectrons and characteristic x-rays can result in energy deposition in neighboring pixels.
For example, significant charge sharing was reported in CdZnTe pixel (Gaskin et al 2003, He et al 2000) and strip detectors (Kalemci and Matteson 2002) with pitches, crystal thicknesses and bias voltages similar to the photon-counting detector used in this study. On the other hand, significant charge sharing was also observed in a CdTe pixel detector with a 55 µm pitch (Maiorino et al 2006, Pennicard et al 2009). However, since differences in carrier behaviors between CdZnTe and CdTe can be non-negligible due to crystal quality (Del Sordo et al 2009), and there is a large difference in detector pitches (55 versus 400 µm) between the CdTe detectors studied in the references and the one in this paper, directly based on the findings in the above references it is still unclear how much charge sharing can affect the energy-resolved photon-counting detector investigated in this study.
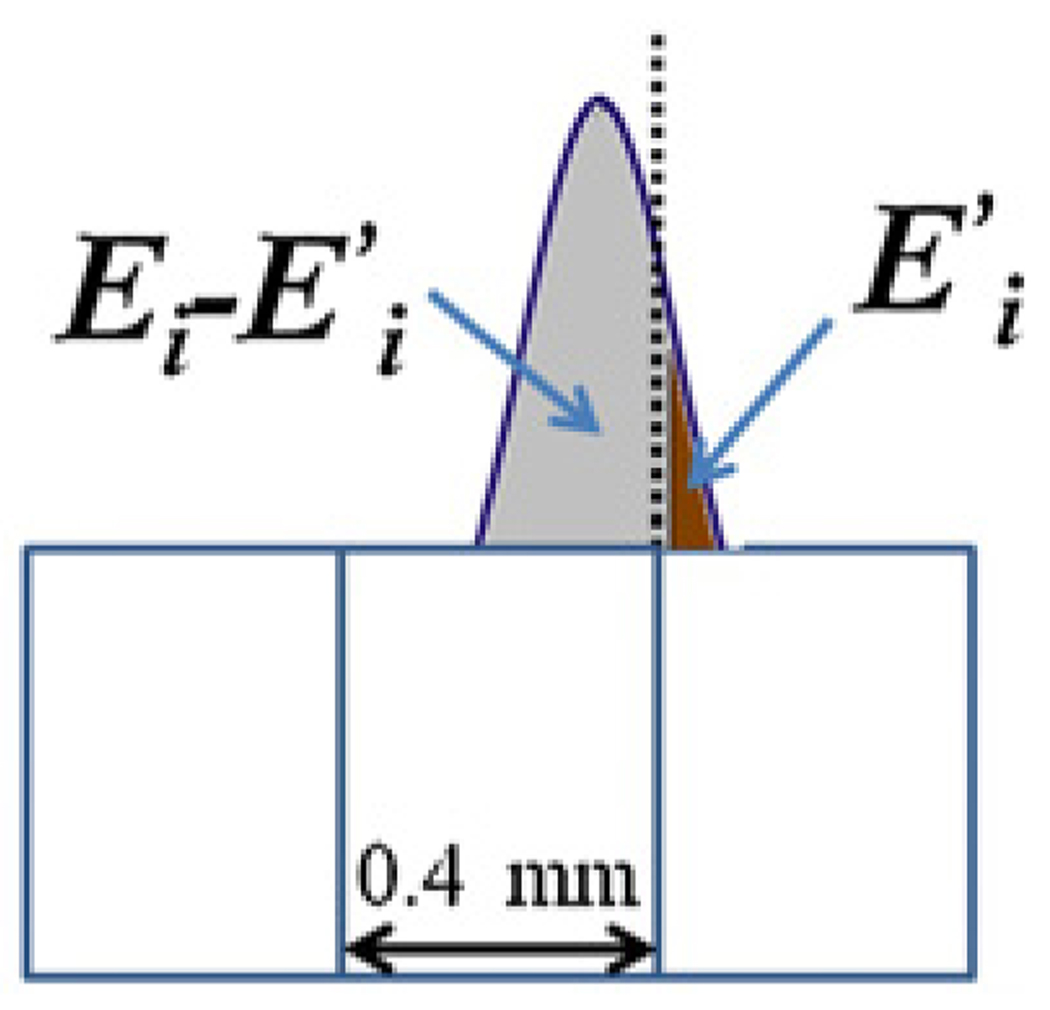
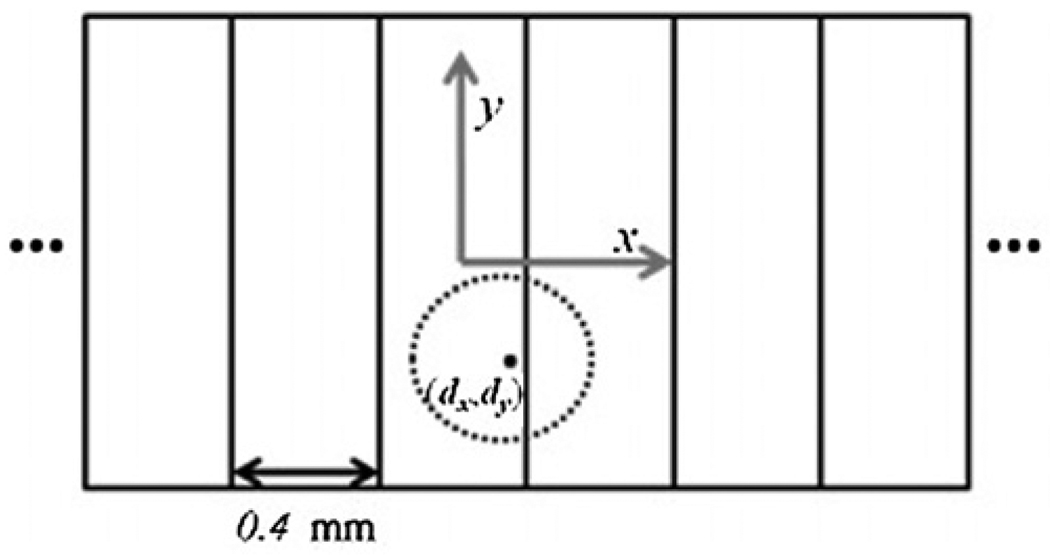
To study the spectral effect of charge sharing and see whether they could produce the observed distortions, we developed a simple model. The model assumed 2DisotropicGaussian dispersion of the measured charge at the electrodes (resulting from and proportional to the carrier charge in the crystal). The cloud was centered at the lateral location where the electron-hold pairs were generated. That is
| (4) |
where the scaling factor, A, was chosen such that
| (5) |
In other words, an incident photon with energy Ei will be detected in the neighboring pixel with an energy that is proportional to the underlying area of this Gaussian spread that spilled into that neighboring pixel. The rest of the incident energy, , will be detected in the incident pixel. For demonstration purposes, figure 12 plots sharing with only one neighboring pixel although, in practice, any neighboring pixel can share part of the incident energy.
Figure 12.
The charge cloud modeled as a Gaussian spread.
Given that the width (axial direction) of the detector pixel (1.6 mm, y-axis) was much larger than the length (transaxial direction, 0.4 mm, x-axis), and the line of pixels extended in the length dimension (x-direction, figure 13), we only considered spread of the incident photon energy into the neighboring pixels on the right and left although the model could be easily extended to a 2D pixel array. In this case we have
| (6) |
and
| (7) |
where the origin was chosen as the center of the pixel with which the original x-ray photon was incident. Thus an energy of was deposited in the original incident pixel. In this study, the resulting spectrum was further distorted by energy resolution, modeled by convolution with an energy-independent Gaussian.
Figure 13.
is determined by the incident energy, Ei, and the location of interaction, (dx, dy).
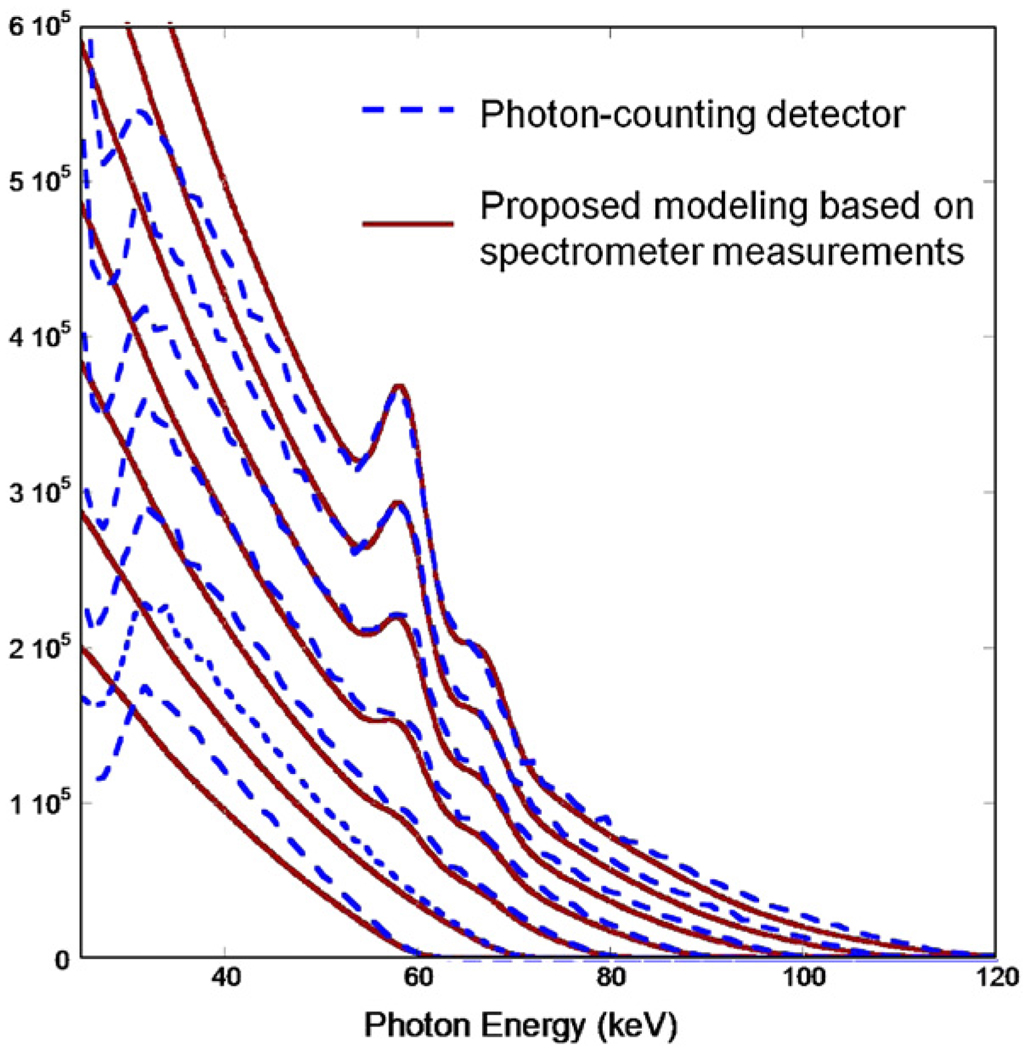
We approximated the ideal incident spectra by those measured with the previously introduced spectrometer (as in figure 7(b), energy resolution FWHM ~ 1.3 keV at 122 keV) and distorted them with the above charge sharing and energy resolution models. Different FWHM of the charge cloud dispersion and detector energy resolution were investigated in order to find the combination giving the best match with the photon-counting detector measurements (figure 7(a)). Figure 14 plots the simulated and measured energy spectra for FWHMs of 0.4 mm (σ = 0.16 mm) for charge sharing and 4.5 keV for detector energy resolution. This combination produced good agreement in the width of the tungsten K-characteristic x-ray peaks as well as in the low energy range of the spectra. The data in figure 14 suggest that the proposed empirical charge-sharing model reproduced the large number of events recorded with low energies and achieved good agreement with the experimental results.
Figure 14.
X-ray tube output spectra (60–120 kVp) measured with the photon-counting detector compared with that obtained using the charge sharing and energy resolution simulation.
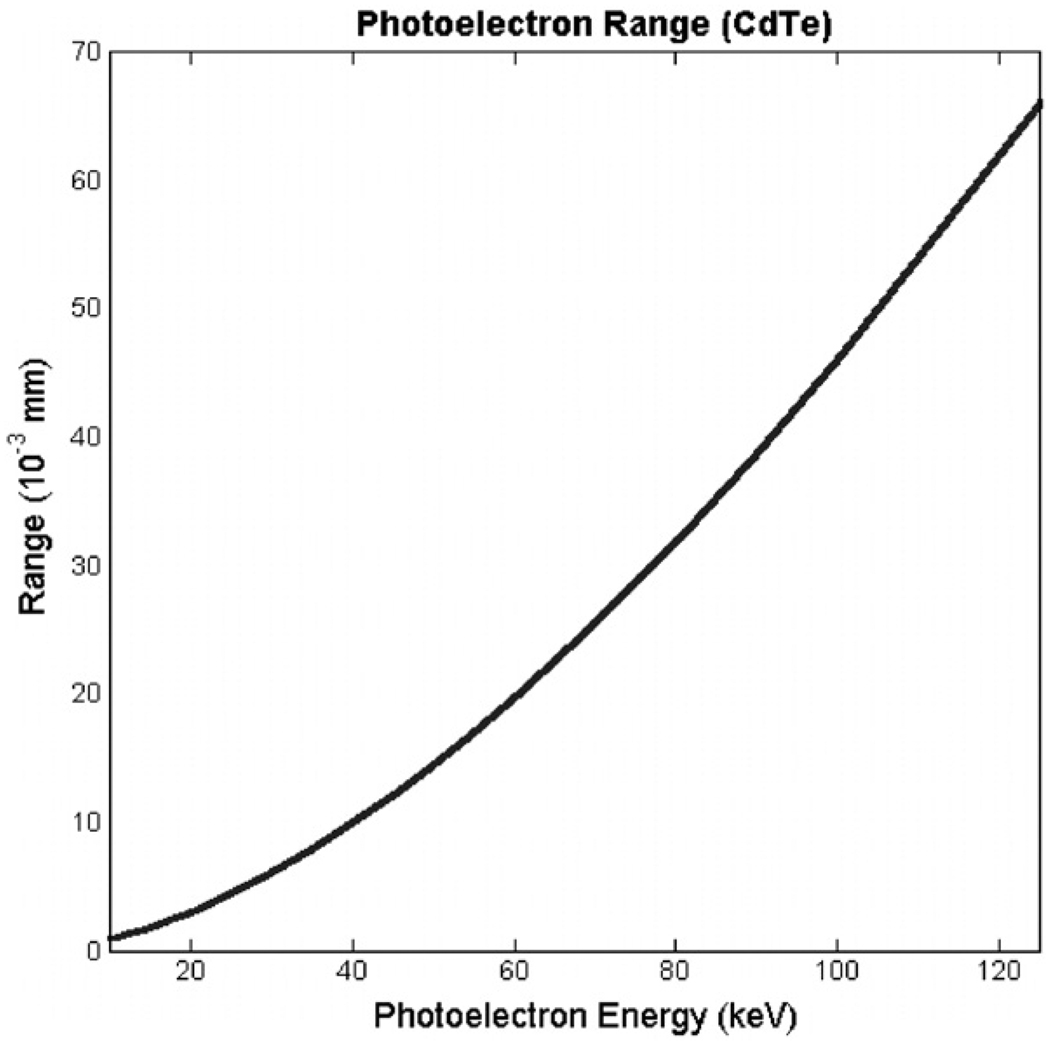
Major factors that result in charge sharing include photoelectron range, characteristic x-ray emission and carrier diffusion along the path to the electrodes. Photoelectron range refers to the phenomenon that, as a result of the photoelectric absorption of the incoming x-ray photon in the detector crystal, a photoelectron is generated with non-zero energy and travels a non-zero distance before its energy is dissipated and absorbed. Electron-hole pairs are generated along the photoelectron trajectory as it loses energy. What complicates the analysis is that (1) the photoelectron trajectory is not a straight line (e.g., figure 4 in He et al (2000)) and (2) the distribution of electron-hole pairs along the trajectory is not uniform. In this study, we used the NIST ESTAR Database (Berger et al 1998a) to obtain the photoelectron range in CdTe for photoelectron energies ranging from 10 to 120 keV (figure 15). For energies below 100 keV, the photoelectron range is no more than 40 µm.
Figure 15.
Photoelectron range in CdTe for the energy range of diagnostic x-ray (data obtained from the NIST ESTAR Database).
The second factor, characteristic x-ray emission occurs when the incident x-ray photon is absorbed by the detector crystal via photoelectric absorption and the ionized atom later relaxes via the emission of a characteristic x-ray photon. This characteristic x-ray photon may exit the detector crystal, or it may be reabsorbed in the crystal. The energies of the characteristic x-rays in CdTe are listed in table 4. Note that the L-shell x-ray energies for CdTe are low (<5 keV) so we considered them locally absorbed.
Table 4.
Characteristic x-ray energies (keV) for Cd and Te.
| Kα1 | Kα2 | Kβ1 | Kβ3 | |
|---|---|---|---|---|
| Cd (Z = 48) | 23.17 | 22.98 | 26.09 | 26.06 |
| Te (Z = 52) | 27.47 | 27.20 | 30.99 | 30.95 |
The emitted K-shell characteristic x-ray may travel a non-zero distance within the crystal before being reabsorbed. This photon range can also contribute to the spread of the charge cloud. Given the photon energy E*, its mean free path can be computed by l = 1/μCdTe(E*), where μCdTe(E*) is the linear attenuation coefficient of CdTe at energy E*. For the K-shell energies listed in table 4, the mean free path is approximately 116 µm for 23 keV, 161 µm for 26 keV, 60 µm for 27 keV and 85 µm for 31 keV.
The third factor, carrier diffusion, takes place after the electron–hole pairs are generated. Under the applied electric field, the electrons are pulled (drift) toward the anode and the holes toward the cathode, during which time displacement currents are induced on the electrodes, resulting in an electrical current signal. During the time of this carrier drift, however, the size of the charge cloud will increase, due to the diffusion effect. The carrier distributions are described by the ambipolar transport equations (Schetzina and McKelvey 1970). For electron carriers, it has been established that the solution to the equations is a 2D isotropic Gaussian with (Knoll 1999). Here Dn is the diffusion coefficient for electrons, μn is the electron mobility, and Td is the drift time for the electron carriers to reach the anode. Td can be computed using , where d is the crystal thickness, V is the bias voltage applied in the thickness z-direction, and z0 is the distance between the point of interaction and the anode.
An incident x-ray photon with energy E* is absorbed at a mean depth in the crystal of 1/μCdTe(E*). Thus, z0 = d − 1/μCdTe(E*) (in the detector used in this study, the anode is on the opposite side of the crystal from the entrance side). By the time the carrier charge reaches the anode, . Using the Einstein relation, D/μ = kT/e, we have
| (8) |
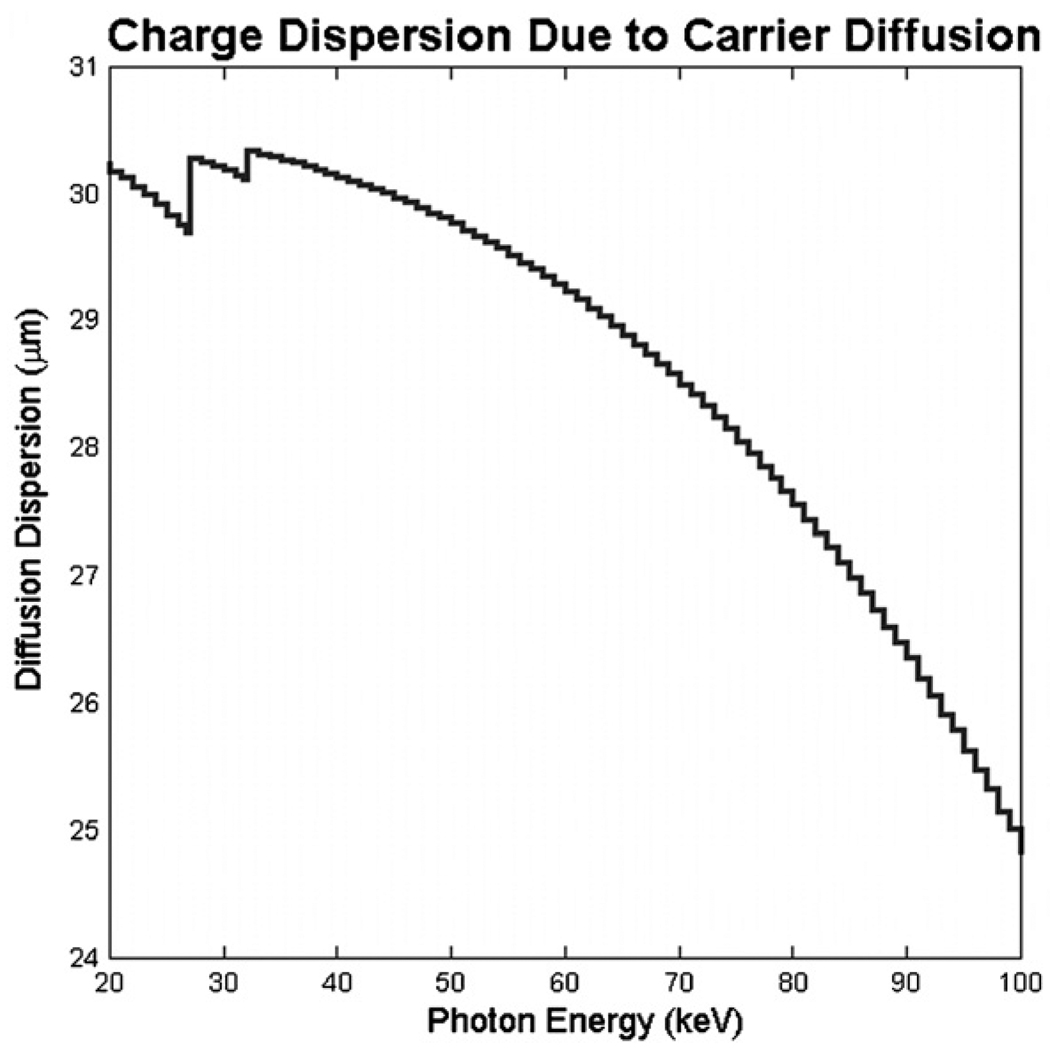
At room temperature (300 K), kT/e = 0.026 V. With d = 3 mm and V = 500 V, the average charge dispersion, σ, measured at the collecting anode in CdTe was computed for the energy range 20–120 keV and is plotted in figure 16. For energies below 100 keV, the diffusion dispersion is less than σ = 30 µm, and even smaller before it reaches the anode.
Figure 16.
The average charge dispersion σ resulting from carrier diffusion for different incident x-ray photon energies. The CdTe attenuation coefficients were obtained from the NIST XCOM Database (Berger et al 1998b).
From the above discussion and estimates, all three effects (photoelectron range, characteristic x-ray emission and carrier diffusion) have some role in the charge spread, with characteristic x-ray having the largest spatial extent. However, none of these effects is large enough to explain the 0.4 mm FWHM required to provide the best fit between the estimated and measured spectrum (figure 14). Better estimates of the individual and combined effects are needed.
In addition, the model used to generate figure 14 does not include a number of degrading factors including pulse pileup and electronics noise, though the former is largely expected to degrade the high energy portion of the spectrum. Also, the model assumes a Gaussian charge spread, which may not be accurate for the photoelectron and characteristic x-ray components, and that the dispersion is energy and depth dependent. Nevertheless, even this simple empirical model indicates that charge sharing can have a significant impact on the photons detected in the low energy windows. Further characterization of the detector response and development of more sophisticated models are needed to fully understand this behavior and to develop correction methods.
3.2. X-ray computed tomography experiment
We imaged the cylindrical phantom filled with the various materials introduced in table 2. In this paper, emphasis was given to reducing the ring artifacts, which are relatively common for photon-counting detectors, and the energy dependence of the contrast achievable by energy-resolved photon-counting detectors.
3.2.1. Ring artifacts reduction
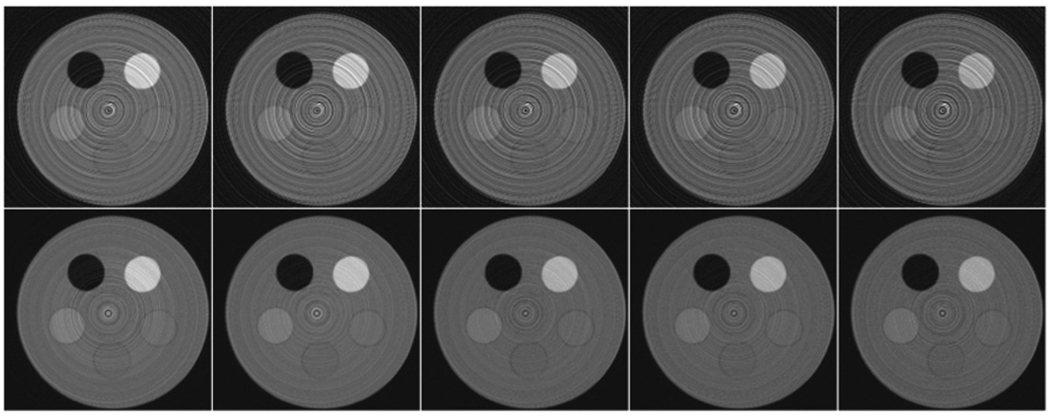
To quantitatively investigate the effectiveness of the proposed tuning strategy, we acquired images of the cylindrical phantom with the compartments containing four different insert materials: PTFE, POM, polycarbonate, PET, and air (figure 17). The applied x-ray spectrum was 80 kVp with a tube current of 100 µA (1.6 mAs/view and 360 views). The global energy thresholds were set to 27, 32, 38, 43, 50, and 80 keV.
Figure 17.
Tomographic images obtained without (top row) and with (bottom row) threshold tuning (left to right, lower threshold to higher threshold, 27, 32, 38, 43 and 50). The inserts were (starting at 11 o’clock and proceeding clockwise) air, PTFE, polycarbonate, PET and POM.
We acquired data using the detector with the manufacturer-provided threshold tuning as well as after applying the proposed tuning method. The manufacturer tuning set the global and trim-DAC values such that the positions of the energy peaks in a global threshold DAC scan of two radionuclide sources (Co-57, 122 keV, and Am-241, 59.5 keV) were the same. However, the configuration parameters provided by the manufacturer tuning were not adequate to eliminate inter-pixel variations due to factors including detector temporal instability and threshold nonlinearity.
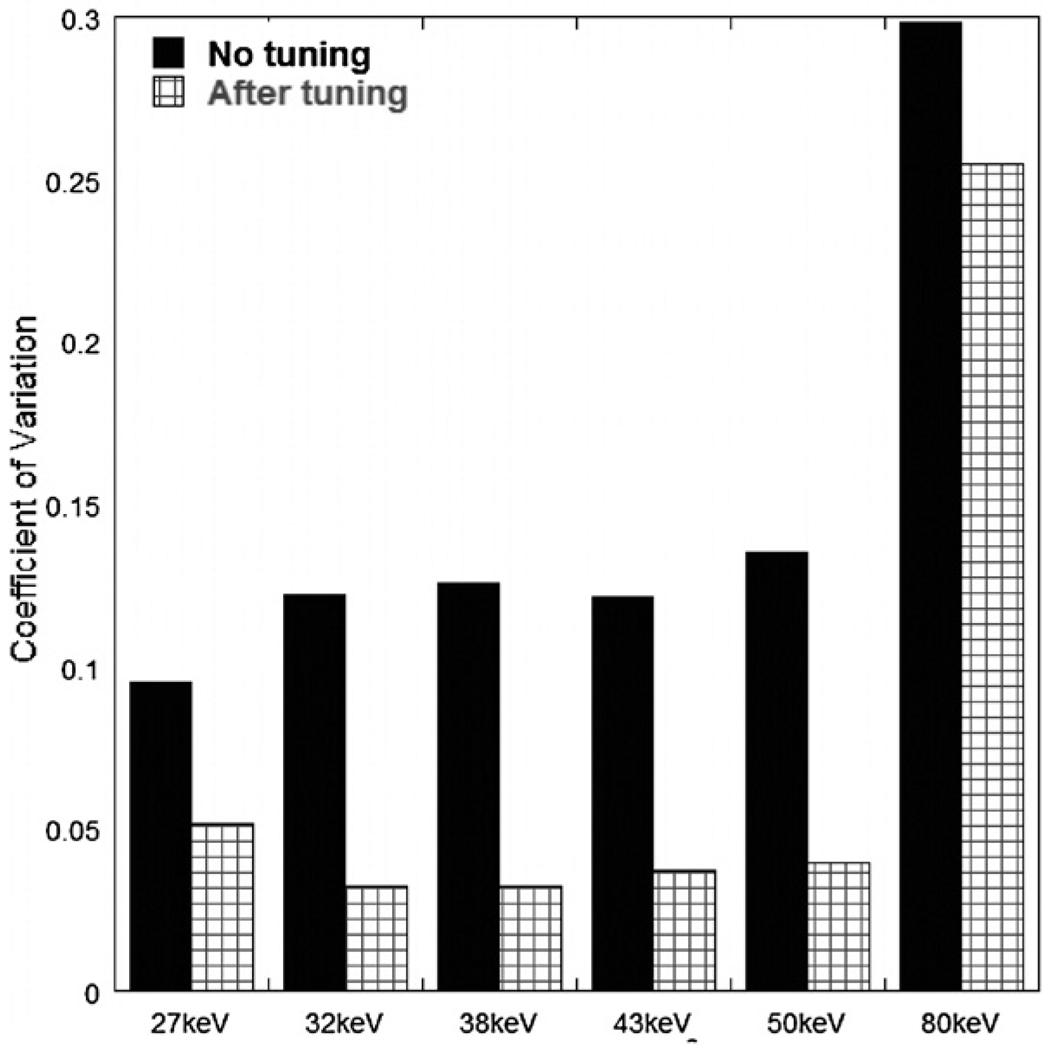
We quantitatively assessed the degree of ring reduction by calculating the coefficient of variation (COV), equal to the standard deviation divided by the mean, in five 20 × 10 pixel2 rectangular regions of interest (ROIs). One ROI was placed over each of the four rod inserts and one over the PMMA background. This ratio measured the observed variations in a region and, in a ring-free image, would be close to zero (or at least dominated by noise). The results for the PTFE region are plotted in figure 18 and show reduced variations after tuning for all six thresholds except for the highest threshold (80 keV), which measured only pulse pileup. These measurements were in agreement with the visual observation that ring artifacts were substantially reduced. Similar reductions were observed for the other materials.
Figure 18.
Standard deviation-to-mean ratio for a 20 × 10 pixel2 rectangular region over the PTFE insert in the cylindrical phantom measured before and after threshold tuning. Other inserts showed a similar trend.
However, ring artifacts were not completely eliminated, indicating the need for additional post-acquisition ring correction. The remaining ring artifacts could result from the limited precision of the threshold tuning, which is determined by the number and voltage step size of available trim-DAC bits. With the current 4-bit trim-DAC, the resolution is approximately 1 keV. This study and a previous simulation study (Wang et al 2008) suggest that this level of precision is not high enough to guarantee ring-free images. More trim-DACs bits and finer adjustment increments are needed in future detectors to allow further ring reduction.
3.2.2. Energy-dependent contrast
To quantitatively analyze the CNRs in the different energy windows, we used the cylindrical phantom with the compartments filled with PTFE, POM, water, and 2% and 5% (volume concentrations) Omnipaque™350 solutions (effective iodine concentrations of 6.8 and 17 mg ml−1, respectively). The x-ray tube voltage was 80 kV with a tube current of 100 µA. The global energy thresholds were set to 30, 33, 38, 44, 50, and 80 keV.
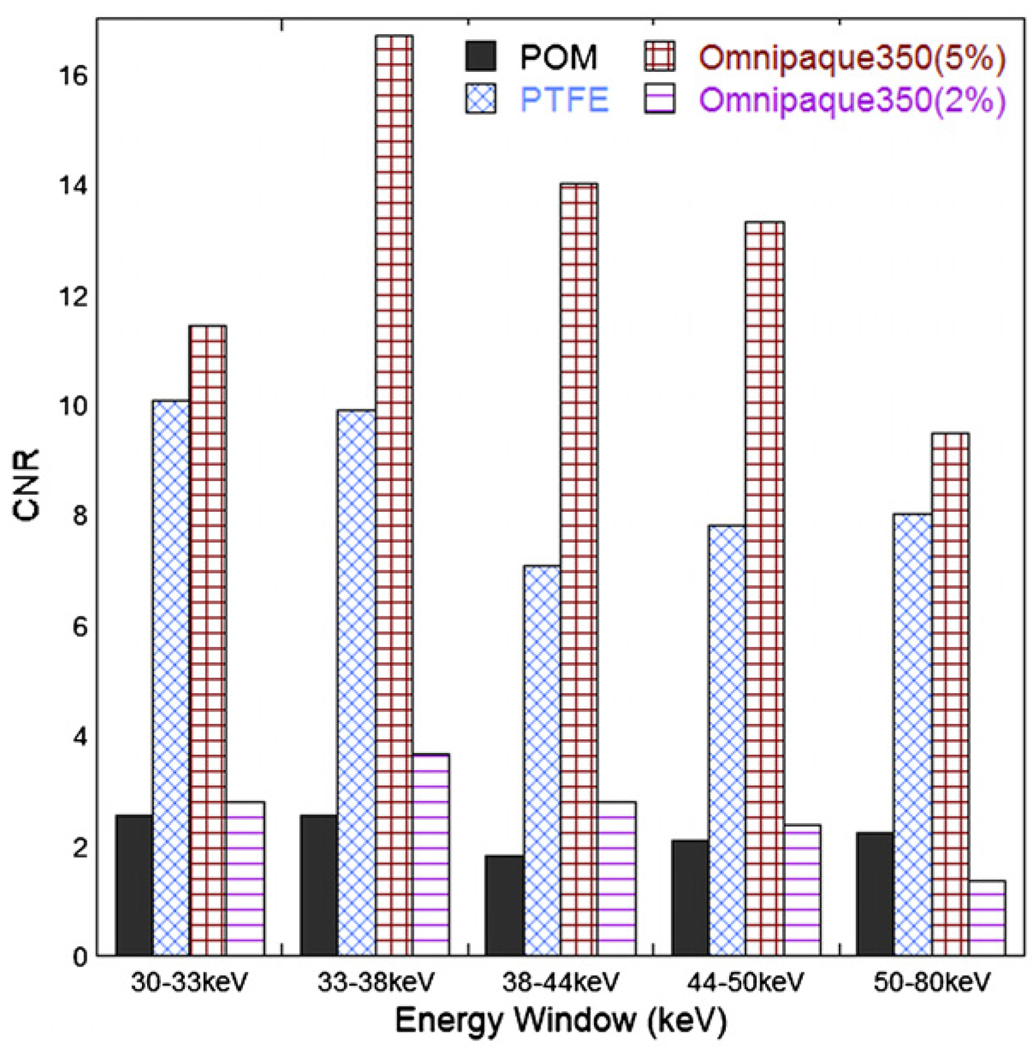
Figure 19 shows tomographic images from the five energy windows. Again a 20 × 10 pixel2 rectangular ROI was drawn over each of the five inserts and the PMMA background. Pixel-by-pixel variances were measured using bootstrapping over 40 noise realizations and averaged in each region of interest. Figure 20 plots the CNR relative to the background for each region (except water, which behaved similarly to POM and PTFE) as a function of energy window. Data above the 80 keV threshold are not presented since they represent pulse pileup.
Figure 19.
Reconstructions from 30–33, 33–38, 38–44, 44–50 and 50–80 keV energy windows. The materials in the five holes were 5% Omnipaque™350 solution (2 o’clock), POM (12 o’clock), PTFE (10 o’clock), water (8 o’clock) and 2% Omnipaque™350 solution (5 o’clock).
Figure 20.
Measured contrast-to-noise ratio from figure 19 for the four different insert materials (excluding water), in each energy window.
We observed that the CNR depended on energy as well as the material imaged and that CNR changed differently depending on the material. For instance, PTFE and the 5%-Omnipaque™350 solution had very similar CNR values in the 30–33 keV window, while the latter displayed a dramatic increase in CNR above 33 keV, due to the K-edge of iodine at 33.2 keV.
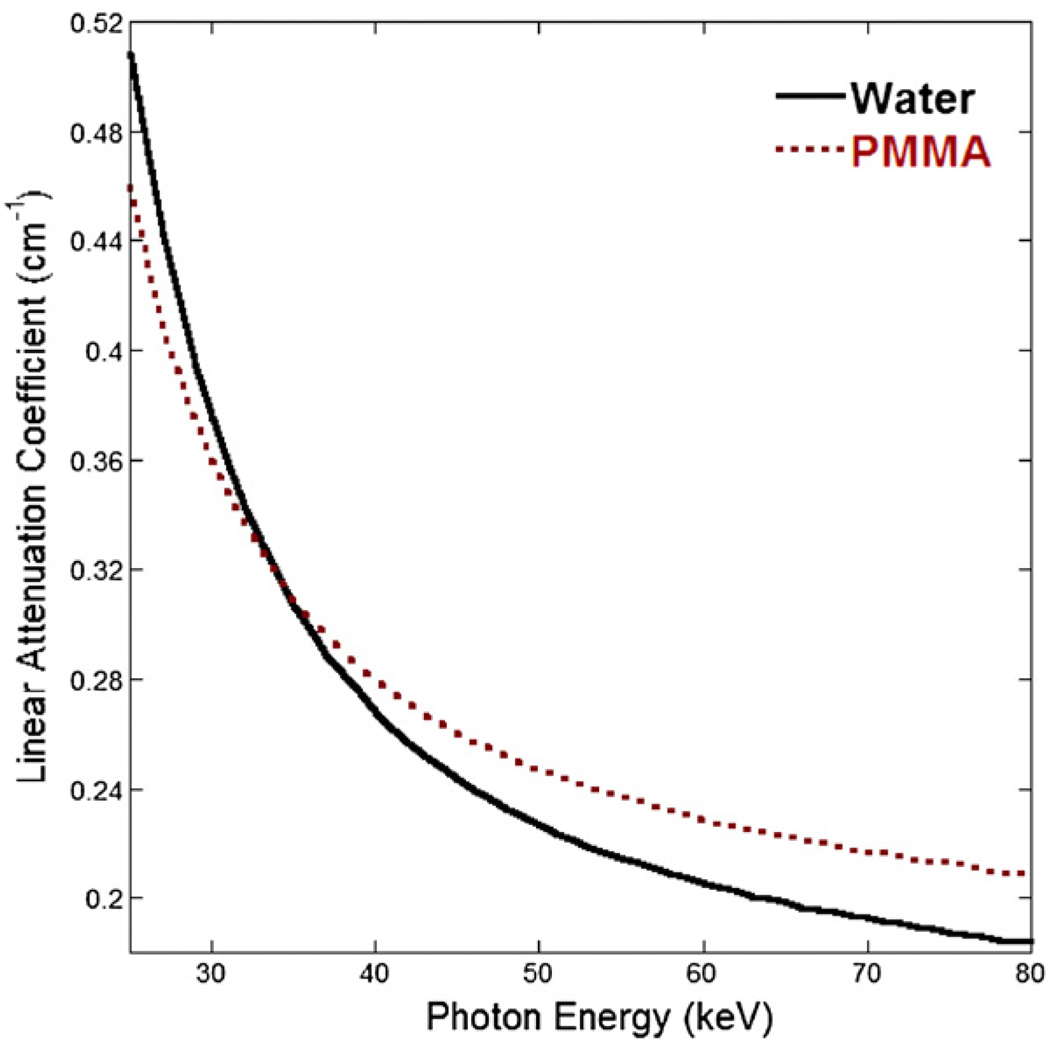
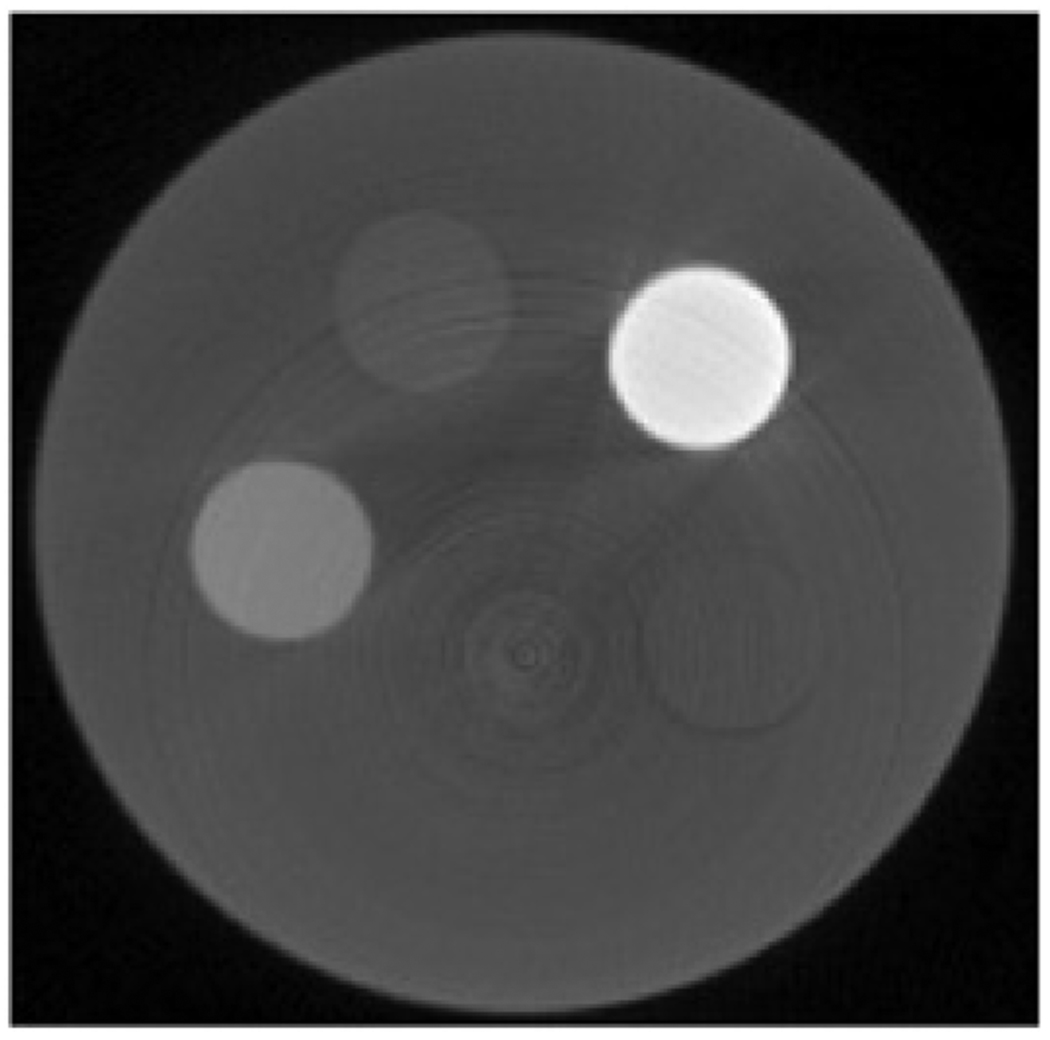
In addition to resolving the abrupt changes in linear attenuation around the K-absorption edges, the energy-resolved detector was also capable of capturing more subtle differences in energy dependence of the linear attenuation coefficients. For example, the linear attenuation coefficients of water and PMMA are close in the energy range of 25–80 keV, as shown in figure 21. Water has higher attenuation below 35 keV, and PMMA has higher attenuation above 35 keV. As a result, in a single-energy CT image obtained using an 80 kVp spectrum and an intensity-integrating detector, an average linear attenuation coefficient is measured, which is very close for water and PMMA. This is confirmed in figure 22, in which the PMMA cylindrical phantom was filled with water and other materials and imaged using the Shad-o-Box™1024 (4.38 mAs/view and 360 views). The mean energy of the incident x-ray spectrum was 39.5 keV. In this image, the water-filled hole at 6 o’clock position was not visible.
Figure 21.
The linear attenuation coefficient values for water and PMMA.
Figure 22.
Reconstruction of the cylindrical phantom with projections from the intensity-integrating Shad-o-Box™1024 detector. The holes were filled with (starting at 1 o’clock, proceeding clockwise) bone-equivalent plastic, polycarbonate, water, PTFE and POM.
Figure 23 shows images of the same phantom as in figure 22 acquired using the same x-ray spectrum and the energy-resolved photon-counting detector (6.4 mAs/view and 360 views). Taking into consideration the 2 mm thick aluminum cover in front of the CdTe sensor (which could be removed and replaced with less attenuating materials), the effective mAs in figure 23 was lower than that in figure 22. The lower attenuation of water is clearly visible in the image from 50 to 80 keV. It is barely visible in the lower energy windows because the differences in their attenuation coefficients are not as large (figure 21) and the ring artifacts are present.
Figure 23.
Reconstructions of the cylindrical phantom from CT acquisition with the energy-resolved photon-counting detector. The phantom is identical to that used in figure 22. The images are from energy windows (left to right) of 27–33, 33–38, 38–44, 44–50, and 50–80 keV.
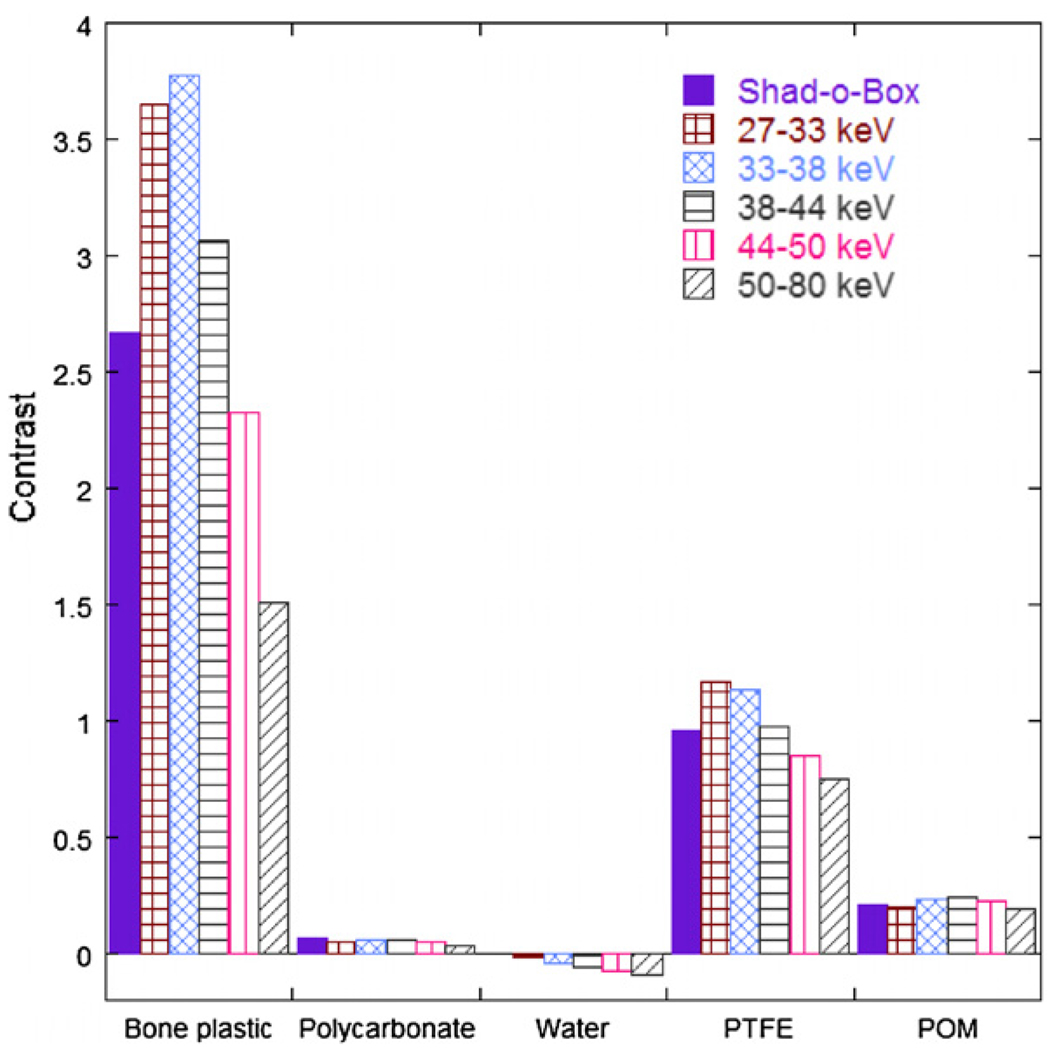
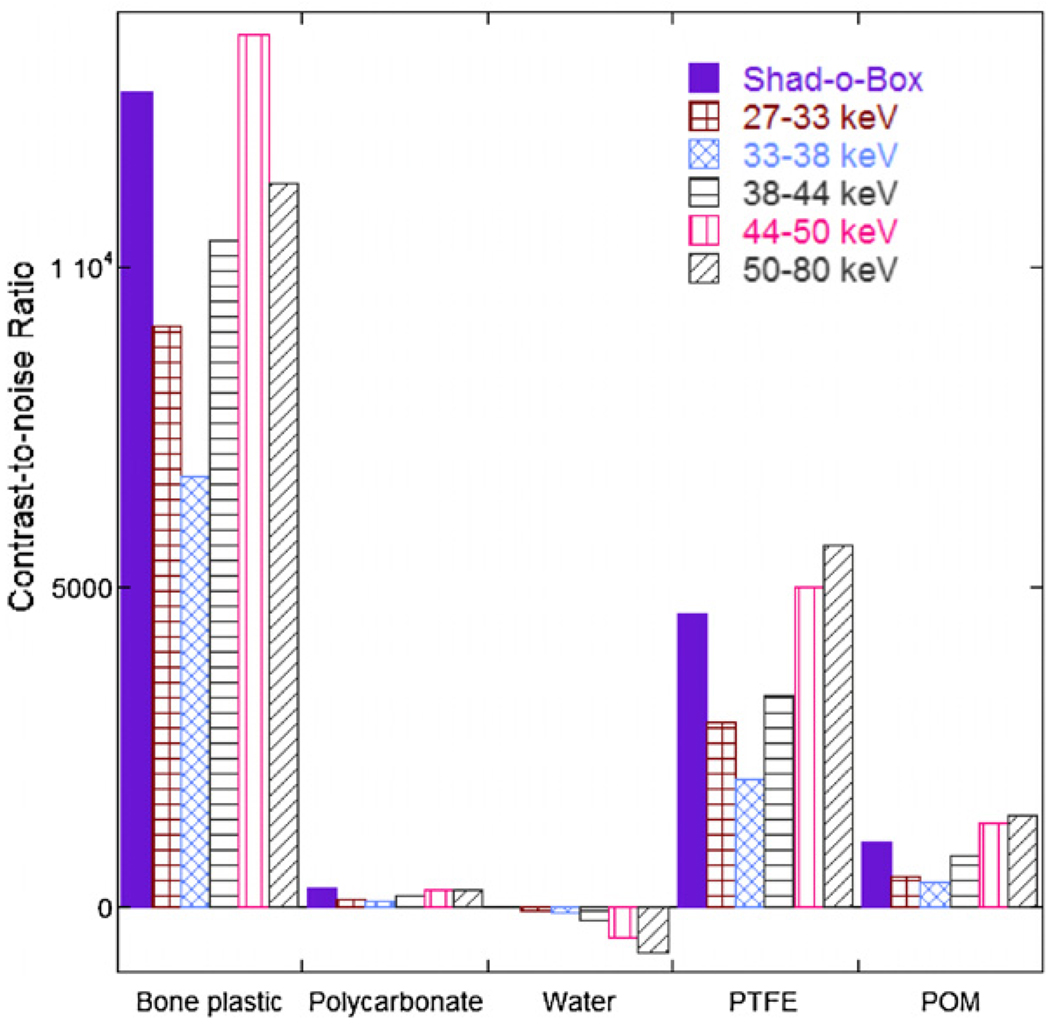
For a more quantitative comparison, the contrast and CNR relative to the PMMA background for both detectors were computed and are plotted in figures 24 and 25. The raw measurements that were used to compute the contrasts and CNRs are summarized in tables 5 and 6. Consistent with figure 20, these data demonstrate that CT imaging using energy-resolved detectors was able to capture and make use of the energy dependence of the attenuation coefficient and the resulting energy-dependent contrast. This capability is useful in allowing the differentiation of materials with different energy dependences.
Figure 24.
Contrasts of the five materials in figures 22 and 23 were computed with respect to the PMMA background.
Figure 25.
Contrast-to-noise ratios (CNR) of the five materials in figures 22 and 23 were computed with respect to the PMMA background.
Table 5.
The measured mean and standard deviation (SD) values from images in figures 22 and 23.
| The energy-resolved photon-counting detector | ||||||
|---|---|---|---|---|---|---|
| Shad-o-Box™1024 | 27–33 keV | 33–38 keV | ||||
| Mean | SD | Mean | SD | Mean | SD | |
| PMMA | 0.0036 | 0.000 209 11 | 0.002 874 | 0.000 402 | 0.002 506 | 0.000 56 |
| Bone plastic | 0.013 | 0.000 350 89 | 0.013 369 | 0.000 871 | 0.011 965 | 0.000 93 |
| Polycarbonate | 0.0038 | 0.000 224 13 | 0.003 031 | 0.000 599 | 0.002 647 | 0.001 36 |
| Water | 0.0036 | 0.000 211 11 | 0.002 825 | 0.000 751 | 0.002 41 | 0.000 975 |
| PTFE | 0.007 | 0.000 211 67 | 0.006 235 | 0.000 391 | 0.005 345 | 0.000 664 |
| POM | 0.0043 | 0.000 286 28 | 0.003 445 | 0.000 419 | 0.003 083 | 0.000 426 |
Table 6.
The measured mean and standard deviation (SD) values from images in figures 22 and 23 (continued from table 5).
| The energy-resolved photon-counting detector | ||||||
|---|---|---|---|---|---|---|
| 38–44 keV | 44–50 keV | 50–80 keV | ||||
| Mean | SD | Mean | SD | Mean | SD | |
| PMMA | 0.002 236 | 0.000 294 | 0.002 068 | 0.000 17 | 0.001 904 | 0.000 133 |
| Bone plastic | 0.009 103 | 0.000 988 | 0.006 874 | 0.000 82 | 0.004 769 | 0.000 266 |
| Polycarbonate | 0.002 365 | 0.000 903 | 0.002 172 | 0.000 535 | 0.001 973 | 0.000 224 |
| Water | 0.002 115 | 0.000 511 | 0.001 906 | 0.000 248 | 0.001 727 | 0.000 173 |
| PTFE | 0.004 42 | 0.000 382 | 0.003 831 | 0.000 199 | 0.003 338 | 0.000 112 |
| POM | 0.002 775 | 0.000 389 | 0.002 535 | 0.000 319 | 0.002 266 | 0.000 16 |
A comparison with figures 24 and 25 illustrates that the potential of energy-resolved photon-counting detectors can be significantly limited by ring artifacts. Ring artifacts result in nonuniformity and unwanted structured noise, significantly decreasing the system’s capability to visualize differences between linear attenuation coefficients for various target materials. As can be seen from (3), this also directly results in a degraded CNR.
Furthermore, any energy spectral distortion like those described in section 3.1.3 can also impact the performance of energy-resolved detectors, which rely on accurately measuring the energy dependence of the attenuation coefficient of the target. For instance, due to charge sharing, high-energy photons (which contribute less contrast) are counted in low-energy windows, directly resulting in reduced contrast and CNR.
4. Conclusions
We built and evaluated a prototype microCT system based on an energy-resolved photon-counting x-ray detector, in order to investigate the magnitude of benefits and advantages that can be achieved with a real photon-counting CT system. We characterized the detector’s spectroscopic performance using polychromatic beams from an x-ray tube source and various filtering materials with K-absorption edges. We also used the detector to acquire data for tomographic experiments using a phantom containing inserts of different materials, and compared the results with an intensity-integrating detector using single-energy CT.
The spectroscopic experiments showed that the energy-resolved photon-counting detector was capable of measuring spectra from polychromatic sources like a standard x-ray tube and resolving absorption edges present in the energy ranged used for imaging. These features could be potentially useful for energy calibration without the use of monochromatic sources. The ability to resolve absorption edges is also a good indication that the detector would be useful to identify and separate different materials in tomographic imaging based on the energy dependence of the linear attenuation coefficient.
The spectroscopic experiments also indicated that charge sharing between adjacent detector pixels could result in significant spectral distortions, especially in the low energy range. We developed a simple charge-sharing model that reproduced the spectral degradation in simulation experiments and achieved relatively good fitting between the simulated and measured spectra. Further investigation is needed to more completely understand and model the spectral distortions.
In the tomographic experiments, we showed that careful energy threshold tuning could substantially reduce energy-dependent variations in sensitivity and therefore reduce ring artifacts in the reconstructed images. The amount of reduction, however, was limited by the 1 keV precision of the tuning circuits, indicating the need for finer adjustment in future detectors.
We also found that, in agreement with theory, the contrast and contrast-to-noise ratio (CNR) between a material of interest and the background varied with energy and the composition of the material. The availability of multiple energy thresholds allowed us to measure simultaneously target contrast in different energy ranges. Compared with single-energy CT with an intensity-integrating detector, this feature may be especially useful to improve differentiation of materials with different attenuation coefficient energy dependences.
Taken together, these results indicate that energy-resolved photon-counting x-ray detectors have the potential to provide improved microCT imaging. Several technical challenges were also identified, including the need for improved hardware and correction algorithms to reduce ring artifacts and spectral distortions.
Acknowledgments
This work was funded by NIHNCRR grant no 2R44021794. The authors are grateful to Martin Stumpf for writing the controller programs that greatly facilitated the experiments presented in this manuscript. They also thank the anonymous reviewers for their careful review and constructive suggestions that improved the quality of this manuscript.
References
- Alvarez RE, Macovski A. Energy-selective reconstructions in x-ray computerized tomography. Phys. Med. Biol. 1976;21:733–744. doi: 10.1088/0031-9155/21/5/002. [DOI] [PubMed] [Google Scholar]
- Berger MJ, Coursey JS, Zucker MA, Chang J. Stopping-power and range tables for electrons, protons, and helium ions. NIST Standard Reference Database 124. 1998a [Google Scholar]
- Berger MJ, Hubbell JH, Seltzer SM, Chang J, Coursey JS, Sukumar R, Zucker DS. XCOM: photon cross section database. NIST Standard Reference Database 8. 1998b [Google Scholar]
- Bert C, Niederlöhner D, Giersch J, Pfeiffer KF, Anton G. Computed tomography using the Medipix1 chip. Nucl. Instrum. Methods Phys. Res. A. 2003;509:240–250. [Google Scholar]
- Beuville E, Cederström B, Danielsson M, Luo L, Nygren D, Oltman E, Vestlund J. In application specific integrated circuit and data acquisition system for digital x-ray imaging. Nucl. Instrum. Methods Phys. Res. A. 1998;406:337–342. [Google Scholar]
- Cormode DP, et al. Atherosclerotic plaque composition: analysis with multicolor CT and targeted gold nanoparticles. Radiology. 2010;256:774–782. doi: 10.1148/radiol.10092473. [DOI] [PMC free article] [PubMed] [Google Scholar]
- Del Sordo S, Abbene L, Caroli E, Mancini AM, Zappettini A, Ubertini P. Progress in the development of CdTe and CdZnTe semiconductor radiation detectors for astrophysical and medical applications. Sensors. 2009;9:3491–3526. doi: 10.3390/s90503491. [DOI] [PMC free article] [PubMed] [Google Scholar]
- Feuerlein S, Roessl E, Proksa R, Martens G, Klass O, Jeltsch M, Rasche V, Brambs HJ, Hoffmann MH, Schlomka JP. Multienergy photon-counting K-edge imaging: potential for improved luminal depiction in vascular imaging. Radiology. 2008;249:1010–1016. doi: 10.1148/radiol.2492080560. [DOI] [PubMed] [Google Scholar]
- Frey EC, Taguchi K, Kapusta M, Xu J, Orskaug T, Ninive I, Wagenaar DJ, Patt BE, Tsui BM. MicroComputed tomography with a photon-counting x-ray detector. Proc. SPIE. 2007a;6510:65101R. [Google Scholar]
- Frey EC, Wang X, Du Y, Taguchi K, Xu J, Tsui BMW. Investigation of the use of photon counting x-ray detectors with energy discrimination capability for material decomposition in micro-computed tomography. Proc. SPIE. 2007b;6510:65100A. [Google Scholar]
- Gaskin J, Sharma D, Ramsey B. Charge sharing and charge loss in a cadmium-zinc-telluride fine-pixel detector array. Nucl. Instrum. Methods Phys. Res. A. 2003;505:122–125. [Google Scholar]
- He Z, Li W, Knoll GF, Wehe DK, Du YF. Effects of charge sharing in 3D position sensitive CdZnTe gamma-ray spectrometers. Nucl. Instrum. Methods Phys. Res. A. 2000;439:619–624. [Google Scholar]
- Kalemci E, Matteson JL. Investigation of charge sharing among electrode strips for a CdZnTe detector. Nucl. Instrum. Methods Phys. Res. A. 2002;478:527–537. [Google Scholar]
- Knoll GF. Radiation Detection and Measurement. New York: Wiley; 1999. [Google Scholar]
- Maiorino M, Pellegrini G, Blanchot G, Chmeissani M, Garcia J, Martinez R, Lozano M, Puigdengoles C, Ullan M. Charge-sharing observations with a CdTe pixel detector irradiated with a 57Co source. Nucl. Instrum. Methods Phys. Res. A. 2006;563:177–181. [Google Scholar]
- Mikkelsen S, Meier D, Maehlum GE, Oya P, Sundal BM, Talebi J. An ASIC for multi-energy x-ray counting. IEEE Nuclear Science Symp. and Medical Imaging Conf. Record. 2008:1996–2001. N30-4. [Google Scholar]
- Pennicard D, Fleta C, Bates R, O’Shea V, Parkes C, Pellegrini G, Lozano M, Marchal J, Tartoni N. Charge sharing in double-sided 3D Medipix2 detectors. Nucl. Instrum. Methods Phys. Res. A. 2009;604:412–415. [Google Scholar]
- Raven C. Numerical removal of ring artifacts in microtomography. Rev. Sci. Instrum. 1998;69:2978–2980. [Google Scholar]
- Schetzina JF, McKelvey JP. Ambipolar transport of electrons and holes in anisotropic crystals. Phys. Rev. B. 1970;2:6. [Google Scholar]
- Schlomka JP, et al. Experimental feasibility of multi-energy photon-counting K-edge imaging in pre-clinical computed tomography. Phys. Med. Biol. 2008;53:4031–4047. doi: 10.1088/0031-9155/53/15/002. [DOI] [PubMed] [Google Scholar]
- Shikhaliev PM, Xu T, Molloi S. Photon counting computed tomography: concept and initial results. Med. Phys. 2005;32:427. doi: 10.1118/1.1854779. [DOI] [PubMed] [Google Scholar]
- Taguchi K, Frey EC, Wang X, Iwanczyk JS, Barber WC. An analytical model of the effects of pulse pileup on the energy spectrum recorded by energy resolved photon counting x-ray detectors. Med. Phys. 2010;37:3957–3969. doi: 10.1118/1.3429056. [DOI] [PMC free article] [PubMed] [Google Scholar]
- Wang X, He X, Taguchi K, Patt BE, Wagenaar DJ, Frey EC. Uniformity correction in photon-counting x-ray detector based on basis material decomposition. IEEE Nuclear Science Symp. and Medical Imaging Conf. Record. 2008:4902–4905. M10-198. [Google Scholar]
- Wang X, Meier D, Taguchi K, Wagenaar DJ, Patt BE, Frey EC. Material separation in x-ray CT with energy resolved photon-counting detectors. Med. Phys. 2011;38:1534–1546. doi: 10.1118/1.3553401. [DOI] [PMC free article] [PubMed] [Google Scholar]


