Abstract
Circadian changes in cardiovascular function during the progression of diabetes mellitus in the diabetes prone rat (BBDP) (n = 8) were studied. Age-matched diabetes-resistant rats (BBDR) served as controls. BP was recorded via telemetry in contiguous 4 hr time periods over 24 hours starting with 12 midnight to 4 am as period zero (P0). Prior to onset of diabetes BP was high at P0, peaked at P2, and then fell again at P3; BP and heart rate (HR) then increased gradually at P4 and leveled off at P5, thereby exhibiting a bipodal rhythm. These patterns changed during long-term diabetes. The cross-correlation coefficient of BP and HR was not significantly different across groups at onset, but it fell significantly at 9 months of duration of diabetes (BBDP: 0.39 ± 0.06; BBDR: 0.65 ± 0.03; P < .05). These results show that changes in circadian cardiovascular rhythms in diabetes mellitus became significant at the late stage of the disease.
1. Introduction
Circadian variations in most bodily functions have been recognized. The circadian variation enables the organism, system, and individual organs to maximize efficiency by ensuring optimal performance with minimal energy expenditure. The diurnal variation in blood pressure rhythm has been demonstrated in man [1–3] and various mammalian species [4–6]. Some variations in the circadian blood pressure patterns have been attributed to endocrine influences [7, 8] while others are thought to be of neural origin [9]. Blood pressure and heart rate are thought to vary in different ways, with diurnal changes in weather, time of day, and temperature. Circadian rhythm involves changes in autonomic function controlled by the hypothalamus and influenced by the higher brain centers. Therefore variation in circadian rhythm may also be an indicator of autonomic changes. Vinik and Erbas [10] have stressed the importance of recognizing and treating autonomic neuropathy in diabetes, but early detection of autonomic neuropathy is difficult with current assessment techniques. The search for more sensitive, less invasive, and less stressful markers of autonomic and cardiovascular dysfunction is still imperative.
Young et al. [11] have reported that the heart possesses an internal circadian clock, which is associated with gene expression, metabolism, and contractile performance. They reported loss of synchronization in the phases of these circadian rhythms in streptozotocin-induced diabetes in rats. Loss of circadian rhythm of blood pressure following acute stroke has been reported in human patients [12–14]. Diabetes mellitus is known to produce autonomic neuropathy, which results in functional and anatomical changes in the autonomic and cardiovascular system [15]. Clinical studies have used beat-to-beat variation of heart rate during deep breathing and during the Valsalva maneuver to show the altered parasympathetic nervous control of the heart in diabetes [16, 17]. Other experimental studies have been carried out in streptozotocin- or alloxan-treated rats [11, 18]. The autonomic nervous system plays an important role in the regulation of cardiovascular function in health and disease [19]. However the effect of the development of diabetes and diabetic neuropathy on regulation of cardiovascular function and the circadian variability of blood pressure and heart rate has not been convincingly elucidated. The development of an animal model of spontaneous autoimmune diabetes mellitus, the BBDP rat, provides a good opportunity for the study of the phenomenological changes in autonomic and cardiovascular function and the circadian variations in these parameters during the progression of type 1 diabetes mellitus.
This study was designed to investigate the circadian variations in blood pressure, heart rate, and blood pressure and heart rate cross-correlation (xcorr) in BBDP rats. We posit that the circadian rhythm of blood pressure, heart rate, and heart rate-blood pressure cross-correlation in diabetic rats will differ from those of the control (i.e., diabetes-resistant) rats.
2. Materials and Methods
2.1. Animals
Male, genetically diabetes-prone (BBDP) (n = 8) and diabetes-resistant (BBDR) (n = 8) rats obtained from the Biomedical Models Inc. (Rutland MA) were used in the study. The experiments were performed in accordance with the National Institutes of Health guidelines for care and use of experimental animals [20] and were approved by the Institutional Animal Care and Use Committee of the University Of Kentucky College Of Medicine. These BBDP rats spontaneously develop an autoimmune, abrupt onset type 1 diabetes mellitus between 50–120 days of age. The diabetes is characterized by polydipsia, polyurea, and hyperglycemia. The rats were obtained from the vendor at 31–45 days of age. They were housed in an isolated room where the temperature was controlled at 72 degrees Fahrenheit (22°C), 56% humidity, and a 12/12-hour light/dark cycle. The rats were fed on standard rat chow (Harlan Teklad 2018, Madison, WI, USA) and had access to water ad libitum. The diabetic animals were weighed each morning, and blood glucose was measured. Briefly a drop of blood from the saphenous vein was placed on the reagent strip of the One-Touch Ultra glucometer (LifeScan Inc., Milpitas, CA, USA) and read within 5 seconds.
2.2. Surgery
All procedures were appropriate for rodent survival surgery. The rats were anaesthetized with sodium pentobarbital (65 mg/kg, IP). The abdominal aorta was accessed via a laparotomy. The sensory element of a Data Sciences International (DSI) probe (model TA11PA-C40) was placed into the aorta via a puncture such that the tip pointed towards the heart. The catheter containing the sensitive element of the probe was secured in place with surgical glue. The body of the probe that contains the sensor, transmitter, and battery was secured to the interior abdominal wall with sutures. The incision was closed and the rat monitored until it roused from the anesthetic.
2.3. Experimental Protocol
The body weight and the blood glucose level were monitored each morning at about 9 am. The day the animal first showed a morning blood glucose level above 250 mg/dL was taken as onset of diabetes mellitus and designated “day 0.” The diabetic age was calculated from this point, which occurred at about 65 days of age. The diabetic rats were maintained on an insulin dose schedule developed by the breeder. This involved giving Protamine-Zinc Insulin (PZI) 0.9 U/100 g/day, subcutaneously. The dose was increased or reduced by 0.2 units per day, depending on weight gain or loss and plasma glucose level. Blood pressure was monitored continuously throughout the period or in some cases continuously for two-week intervals each month. The latter arrangement or rotation helps increase the number of animals monitored and also prolongs battery life of the telemeter, as the telemetry unit is switched off.
2.4. Data Acquisition and Analysis
The telemetry data were obtained using the PhysioTel RPC 1 receiver. The received signal was fed into a DSI Data Exchange Matrix to which was connected an ambient pressure reference (APR 1). The output from the matrix was fed, via a Dataquest PCI card, into the Pentium IV computer-based workstation running a Dataquest A.R.T system software program. The output from this computer was cross-fed into an analog-output Data Exchange Matrix. The analog output of the DEM was passed through a BNC-2110 A-D converter (National Instruments) into an analysis and output computer for further processing or display. The data stream was analyzed using an in-house developed computer program (ViiSoftware, Lexington) running on a Pentium IV based computer. Heart rate (HR) was computed from the pulsatile BP signal. For data analysis the 24-hour day was divided into six 4-hour periods starting from 12 : 00 midnight (P0, P1, P2, P3, P4, and P5). The blood pressure and heart rate were plotted to reveal any diurnal variations and cyclic variations. The cross-correlation coefficient between heart rate and blood pressure was computed [21]. Data are presented as mean ± SEM unless specifically noted otherwise. Two-factor between group analysis of variance (ANOVA) was applied to the strains (BBDP and BBDR). One-way ANOVA was used for individual changes and appropriate t-tests applied. Significance was taken as P < .05.
3. Results
Table 1 shows the parameters of the spontaneously diabetic rats (BBDP) at the onset of diabetes and the age-matched diabetes-resistant control rats (BBDR). The diabetes-prone rats had a slightly, but significantly, lower body weight than the control rats. As expected, the diabetic rats had a significantly higher blood glucose level. We report elsewhere [22] that, aside from the consistent between-group difference in absolute weight, both groups exhibited similar growth patterns during the study period. Likewise, we reported [22] that baseline mean arterial pressure (MAP) did not differ between groups and that HR was minimally, but significantly, lower in the diabetic animals versus the controls for the first 6 months after the BBDP became diabetic. One diabetic rat died about day 120 of diabetic duration and another at day 244.
Table 1.
Demographic and laboratory variables (MEAN ± SD) of diabetic rats (BBDP) and resistant rats (BBDR) at onset of diabetes.
| Variable | BBDP | BBDR |
|---|---|---|
| Age at onset (weeks) | 9 | 9 |
| Numbers (16) | 8 | 8 |
| Weight (g) | 280 ± 25 | 320 ± 12* |
| Blood sugar (mg%) | 347 ± 48 | 87 ± 5.4* |
*P < .05.
3.1. Circadian Changes in BP and HR in BBDP and BBDR Rats
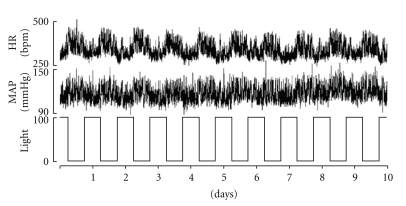
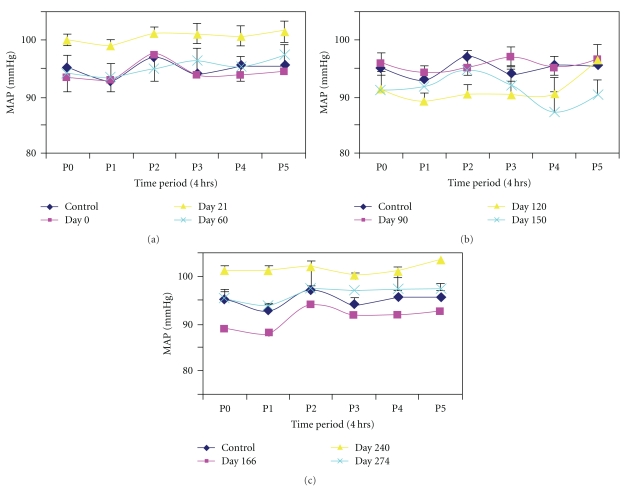
Figure 1 shows ten days of mean arterial pressure (MAP), HR, and light/dark cycles for a diabetes-resistant animal. The circadian variations in blood pressure and heart rate are demonstrably out of phase with the light/dark rhythm (i.e., lowest MAP and HR during light on), as would be expected for an animal that is most active during the dark. Panels a, b, and c of Figure 2 graph MAP recorded for the time periods P0 (12 midnight–4 am), P1 (4 am–8 am), P2 (8 am–12 noon), P3 (12–4 pm), P4 (4 pm–8 pm), and P5 (8 pm–12 midnight) in the BBDP rats at the indicated days following their becoming diabetic. Each point is an across-rats average, in turn derived from a beat-by-beat average over the four-hour recordings for each time period for each subject. The results show that prior to conversion (top-left panel) to the diabetic state (i.e., control, dark blue) blood pressure was high at P0, was lower at P1, and rose to a peak at P2 and then fell again at P3. Thereafter MAP increased gradually at P4 and leveled off at P5. A similar circadian pattern was recorded for the onset of diabetes at day 0 (Panel a, maroon) and again at Day 21 (yellow). By Day 60 (light blue) the peak diurnal blood pressure was shifted to period P3 (12–4 pm) while the night time peak increased (P5; 97.4 ± 5.2 mmHg). The circadian BP rhythms for diabetic duration 3–5 months are shown in Figure 2(b) (top-right panel). The diurnal peak of BP remained at P3 at 90 days (maroon) and 120 days (yellow) while the nighttime peak was still at P5. At 150 days (light blue) peak diurnal BP was at P2; however BP at P4 fell below the early morning dip at P1. The pattern of circadian changes in BP appeared to normalize later in diabetes, but the amplitudes of the changes are greatly reduced especially in the P3 to P4 period (Figure 2(c)).
Figure 1.
Compressed recording showing heart rate and blood pressure variations with the light and dark cycles in BBDP rats, over ten days. Note the circadian pattern with increased HR and BP over the dark periods, typical of nocturnal animals.
Figure 2.
Circadian variations in blood pressure in six diurnal periods (P0–P5) at (a) 0, 21, 60 days, (b) 90–150 days, (c) 166–274 days of diabetes duration. Values are mean ± S.E.M.
The diabetes-resistant rats BBDR showed no appreciable shifts in the diurnal peak period over the study period.
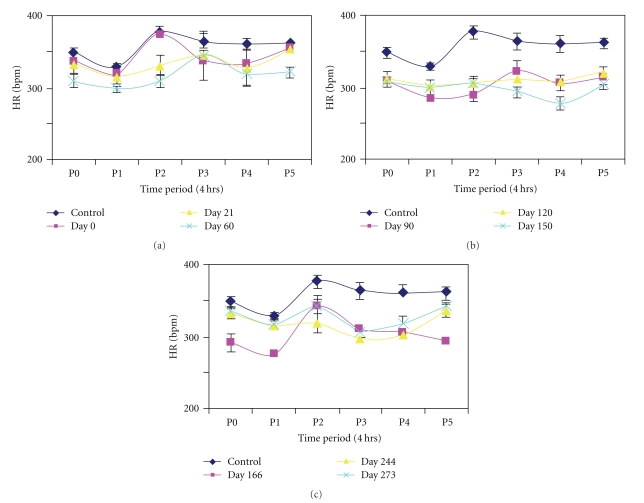
Circadian changes in heart rate (Figure 3) followed a pattern similar to that of mean arterial pressure. Prior to conversion and at day 0 heart rate was high at P0 followed by a dip at P1 and increasing to a peak at P2 (Figure 3(a), top-left). However from day 21 to day 90 the peak shifted to midafternoon at P3. Beyond Day 150 there was a return to normal pattern with a dip at P1 and peak at P2, another dip at P3, and gradual rise to P4 and P5 in the night (Figures 3(b) and 3(c)).
Figure 3.
Circadian variations in heart rate (HR) in six diurnal (4 hour) periods (P0–P5) at (a) 0–60 days, (b) 90–150 days, (c)166–274 days after diabetic conversion. Values are means ± SEM. Note the near consistent relationships with changes in arterial pressure findings (Figure 2) in terms of fluctuations.
3.2. Circadian Changes in Cross Correlation Coefficient in Diabetes
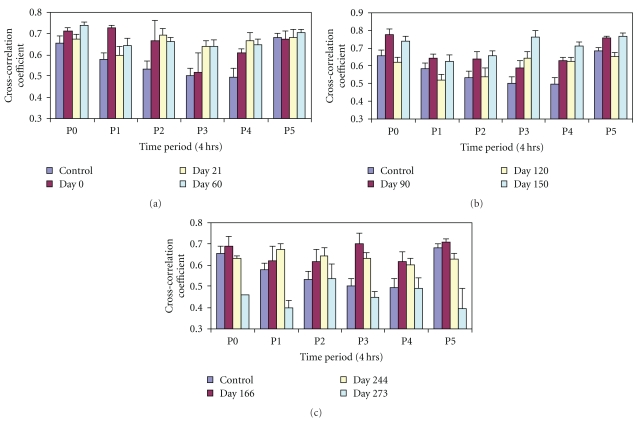
The cross-correlation coefficient of heart rate and blood pressure [21] in the diabetic animals in the six time periods looks “parabolic” with P0 and P5 having the highest values (P0: 0.65 ± 0.031; P5: 0.68 ± 0.019), while the periods P3 and P4 had the lowest values (0.49 ± 0.036, 0.50 ± 0.04, resp.) in the control recording (Figure 4(a)). The cross-correlation coefficient was elevated relative to control at P1 and P2 at the onset of diabetes (i.e., day 0, maroon). By days 21 and 60 there was a midday peak at P2 with dips at P1 and P3 showing a change in pattern. The late diurnal coefficient showed little or no change from P3 to P5 at diabetic age 120–150 days (Figure 4(b)). With an increase in diabetic age the amplitude of the variation in cross-correlation coefficient across the 24-hour day was reduced by day 244, but overall values remained high. However, by the 9th month the cross-correlation coefficient fell significantly with a peak at P2 and lowest dip at P5 (0.39 ± 0.06) (Figure 4(c)) suggesting impairment or degeneration of integrative functions. In contrast the nondiabetic control rats maintained a higher cross-correlation coefficient and did not manifest a dip at P5 (BBDR: 0.65 ± 0.03, P < .05 versus BBDP, 0.39 ± 0.06).
Figure 4.
Graph showing circadian variations of cross-correlation coefficients (Xcorr) of blood pressure and heart rate in six periods P0–P5 at (a) 0–60 days (b) 90–150 (c) 166–273 days of diabetic conversion. The prediabetic control values were taken from n14 to n1 days. Values are mean ± SEM. *P < .05.
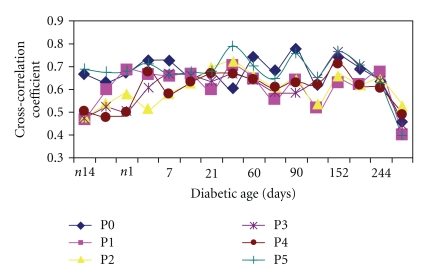
Figure 5 shows the effect of diabetic age on the circadian cross-correlation coefficient in the diabetic rats. Note that, in the pre-conversion period (i.e., n14 to n1), there was considerable daily fluctuation in the cross-correlation coefficient (0.46 to 0.69). After conversion the range of the daily fluctuation narrowed, and by day 21 all the periods had converged (0.6 to 0.67); thereafter (day 60 to day166) the cross-correlation coefficient again showed a wide circadian fluctuation which was sometimes higher than the pre-conversion values. Around day 244 a reduction in the diurnal range was noticeable. This reduction was steady and continued as the cross-correlation coefficient started to decline by day 273. The nondiabetic rats showed less fluctuation in their cross-correlation coefficients. The graph shows that apart from the daily rhythm, there is also a long-term periodic cycle of about one-month duration exhibited by this parameter. This fairly regular pattern was diminished later (from day 180) in the diabetes.
Figure 5.
Graph showing longitudinal effect of diabetic age on cross-correlation coefficient of BP and HR in the 6 diurnal periods over the 9-month period. Values are means ± SD. (n = 8). Note the wide differences before onset of diabetes and the fall and convergence towards the last stage (273 days).
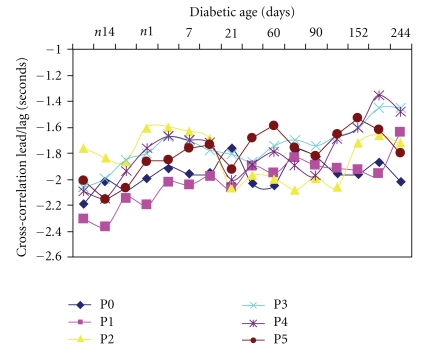
The lead/lag times of the cross-correlation between HR and BP in the circadian period of the diabetic rats are shown in Figure 6. The negative values of the Lead/Lag plot indicate that heart rate changes led blood pressure changes by the indicated value (in sec.). In the pre conversion period the values for the night and early morning periods (P0, P1, P4, and P5) were generally higher (−2.0 to −2.3 sec) while those for midday (P2 and P3) were lower (−1.6 to −2.0 sec). However about day 21 in the postconversion period there was a change in the trend with the continued reduction of the nighttime lead values, especially between Day 21 and Day 90. There was gradual reduction in the lead/lag time for the various periods as the diabetes progressed; however, by day 244 the diurnal circadian variation was significant with P0 (nighttime) having the highest lead (−2.0 ± 0.06 sec) while P3 (afternoon) had the lowest (1.45 ± 0.07 sec). When the changes were aggregated (Figures 7(a) and 7(b)) the average cross-correlation coefficients of the peak (Figure 7(a)) and nadir (Figure 7(b)) showed less fluctuation in the control diabetic-resistant rats suggesting that the between group differences are not primarily due to maturation.
Figure 6.
Changes in circadian rhythms of cross correlation lead/lag time of HR and BP in BBDP rats over the nine months diabetic period. Values are mean ± SEM. (n = 8). Note the gradual reduction in the lead/lag times with duration of diabetes.
Figure 7.
Bar charts showing average overall cross-correlation coefficients of blood pressure and heart rate in diabetes-prone (BBDP) and diabetes-resistant (BBDR) control rats. These are aggregate results averaged over 9 months. (a) shows the average peak Xcorr while (b) shows the average nadir Xcorr values. Values are means ± SEM. (n = 8 in each group). *P < .05.
4. Discussion
Results from this study in an animal model of spontaneous type 1 diabetes mellitus are associated with changes in resting circadian cardiovascular and autonomic functions. The heart is said to possess a fully functional internal clock [23]. It is also established that central suprachiasmatic nucleus and related structures act as circadian pacemakers for the whole body [24, 25]. The interplay of the central and peripheral oscillators enables the organism to adjust the activities of its organs to maximize efficiency while functioning optimally in a changing environment. Our results show that at the onset of diabetes up to the 3rd diabetic week blood pressure had two peaks at midnight/morning, and midafternoon, interlaced with a dip in the morning and followed by another dip late afternoon. This gave way to a gradual rise through the evening and late night. In this longitudinal study a phase shift was seen by the 2nd diabetic month in which the diurnal blood pressure peak shifted from midafternoon to late afternoon (P3). This new pattern was sustained to the third and fourth months of the duration of diabetes. The prediabetic pattern of blood pressure changes was displayed beyond the fifth month, but the amplitude of the rhythm was reduced. Similar circadian rhythm behavior was demonstrated in heart rate by the diabetic rats. The cross-correlation coefficient of heart rate and blood pressure showed wide circadian variation in the pre-conversion period, and the amplitude of the rhythm reduced in the postconversion period and showed little or no fluctuation in the late afternoon-night section during the third to the fifth diabetic month. A sharp fall in the cross-correlation coefficient followed in the 9-10th month with reduction of the diurnal range. Our results suggest that there is also a seasonal rhythm of oscillation in cross-correlation coefficient with a periodicity of about sixty days. This rhythm also diminished late in the study.
The lead time of the peak lead/lag plot of the cross-correlation coefficient was negative throughout the study showing that heart rate change was leading blood pressure change [21]. This value diminished with diabetic age but did not overturn, suggesting that sympathetic efferent control of the cardiovascular system was maintained, but with reduction in effectiveness [21]. The diurnal rhythm showed that the heart rate lead over blood pressure was longer in the morning period (P1) before and at onset of diabetes. This lead became reduced in most periods as the diabetes progressed.
The combination of the spontaneously diabetic rat model and telemetry has proven advantageous for this long-term longitudinal study of the circadian cardiovascular and autonomic function in diabetes. Our findings are consonant with earlier reports of time-dependent alterations in heart rate, circadian variation, pulse pressure, and cardiac autonomic control in streptozotocin- (STZ-) treated rats [18, 26, 27]. Young et al. [11] have also reported alteration of internal circadian clock in the heart of STZ-treated rats. The former were acute studies or intermittent-duration studies lasting one day, 8 weeks, and ten weeks, respectively, and some used indwelling arterial cannula for blood pressure measurement. To the best of our knowledge the present study is unique because we not only measured continuous prediabetic data, but we also recorded during the diabetic conversion period and, thereafter, continuous, long-term cardiovascular function. Our observations reveal that there is yet another rhythmic long-term variation of cardiovascular function. This rhythm has a periodicity of about sixty days which is not obvious in diabetes-resistant rats. The mechanisms underlying the reported changes in cardiovascular function were thought to be in the heart and/or neuroendocrine control. It has been recognized that STZ-induced alterations of the circadian clock of the heart may be independent of diabetes development [11]. Our results do not show a dramatic change in heart rate at onset of diabetes. This is in contrast with the severe bradycardia of about 20% [18] and 30% [28] in earlier reports that used STZ. Other reports on isolated cardiac preparations have associated STZ diabetes with depression of basal spontaneous pacemaker rate [29–31], which was not affected by nadolol or atropine [31, 32]. These findings indicated that the recorded changes were not mediated by endogenous neurotransmitter release. It was thought that changes in electrophysiological properties of the sinoatrial (SA) node of the heart, such as maximum diastolic potential, threshold, or slope of diastolic depolarization, were responsible [18].
It is not certain how these factors affect circadian rhythm in vivo. Our results show bipodal peaks in circadian rhythms over 24 hours. This may be due to central effect(s) on cardiovascular system via the autonomic nervous system.
We have applied computational cross-correlation coefficient analysis of the changes in heart rate and blood pressure to the circadian rhythm and the long-term variability of heart rate and blood pressure in these animals. This method has been shown to be advantageous for investigating dynamic arterial blood pressure and heart rate control [21, 33]. This method revealed different changes in circadian rhythms at different times in the development of diabetes. In the control period the circadian rhythm consisted of a unipodal curve with a peak in the night and a dip in the midday. Immediately at conversion to diabetes the circadian rhythm showed a sustained peak of the cross-correlation coefficient into the mornings. However by the second month the relationship changed to a bipodal curve with peaks in the night and midday and dips in the morning and afternoon. These observations point to changes in autonomic cardiovascular control. This pattern was maintained through the 8th month when the peaks were flattened. The cross-correlation coefficient remained positive indicating [21] that sympathetic control was maintained, though with fluctuations. Thus it can be surmised that in this period permanent damage to autonomic regulatory mechanisms may not have occurred, but some destabilization of the resting tone may be in place. In the ninth month we observed a significant reduction in cross-correlation coefficient and a phase shift in the peaks and dips with the nighttime having the lowest dip, and this did not occur in the diabetes-resistant rats. This may mark the beginning of irreversible impairment of autonomic and cardiovascular function.
In classic blood pressure driven changes as in baroreflex tests, haemorrhage and postural change, BP change is followed reflexly by a compensatory change in HR yielding a negative cross-correlation with BP leading HR. While this is true for volume expansion, compartment reduction via vasoconstriction or vasodilation, this appears not to hold true for euvolemic and nonbaroreflex adjustments [34].
In conclusion, our observations show that in the development of diabetes the circadian cardiovascular rhythms show slight alterations, though these changes only became significant at the late stage of the disease. This is consistent with impairment of integration and/or functional autonomic capacity in prolonged diabetes mellitus.
Acknowledgment
This paper was supported by NIH Grant RO1 NS039774 to the University of Kentucky.
References
- 1.Middeke M, Schrader J. Nocturnal blood pressure in normotensive subjects and those with white coat, primary, and secondary hypertension. British Medical Journal. 1994;308(6929):630–632. doi: 10.1136/bmj.308.6929.630. [DOI] [PMC free article] [PubMed] [Google Scholar]
- 2.Sander D, Klingelhöfer J. Changes of circadian blood pressure patterns after hemodynamic and thromboembolic brain infarction. Stroke. 1994;25(9):1730–1737. doi: 10.1161/01.str.25.9.1730. [DOI] [PubMed] [Google Scholar]
- 3.Edery I. Circadian rhythms in a nutshell. Physiological Genomics. 2000;3:59–74. doi: 10.1152/physiolgenomics.2000.3.2.59. [DOI] [PubMed] [Google Scholar]
- 4.Sato K, Chatani F, Sato S. Circadian and short-term variabilities in blood pressure and heart rate measured by telemetry in rabbits and rats. Journal of the Autonomic Nervous System. 1995;54(3):235–246. doi: 10.1016/0165-1838(95)00016-q. [DOI] [PubMed] [Google Scholar]
- 5.Mishina M, Watanabe T, Matsuoka S, et al. Diurnal variations of blood pressure in dogs. Journal of Veterinary Medical Science. 1999;61(6):643–647. doi: 10.1292/jvms.61.643. [DOI] [PubMed] [Google Scholar]
- 6.Gross V, Milia AF, Plehm R, Inagami T, Luft FC. Long-term blood pressure telemetry in AT receptor-disrupted mice. Journal of Hypertension. 2000;18(7):955–961. doi: 10.1097/00004872-200018070-00018. [DOI] [PubMed] [Google Scholar]
- 7.Widimsky J, Jr., Krsek M, Marek J. Altered circadian blood pressure rhythm in endocrine diseases. Experimental and Clinical Cardiology. 1996;1:108–112. [Google Scholar]
- 8.Middeke M, Kluglich M, Holzgreve H. Circadian blood pressure rhythm in primary and secondary hypertension. Chronobiology International. 1991;8(6):451–459. doi: 10.3109/07420529109059181. [DOI] [PubMed] [Google Scholar]
- 9.Duarte DPF, Silva VL, Jaguaribe AM, Gilmore DP, Da Costa CP. Circadian rhythms in blood pressure in free-ranging three-toed sloths (Bradypus variegatus) Brazilian Journal of Medical and Biological Research. 2003;36(2):273–278. doi: 10.1590/s0100-879x2003000200016. [DOI] [PubMed] [Google Scholar]
- 10.Vinik AI, Erbas T. Recognizing and treating diabetic autonomic neuropathy. Cleveland Clinic Journal of Medicine. 2001;68(11):928–944. doi: 10.3949/ccjm.68.11.928. [DOI] [PubMed] [Google Scholar]
- 11.Young ME, Wilson CR, Razeghi P, Guthrie PH, Taegtmeyer H. Alterations of the circadian clock in the heart by streptozotocin-induced diabetes. Journal of Molecular and Cellular Cardiology. 2002;34(2):223–231. doi: 10.1006/jmcc.2001.1504. [DOI] [PubMed] [Google Scholar]
- 12.Jain S, Namboodri KKN, Kumari S, Prabhakar S. Loss of circadian rhythm of blood pressure following acute stroke. BMC Neurology. 2004;4:1–6. doi: 10.1186/1471-2377-4-1. [DOI] [PMC free article] [PubMed] [Google Scholar]
- 13.Dawson SL, Evans SN, Manktelow BN, Fotherby MD, Robinson TG, Potter JF. Diurnal blood pressure change varies with stroke subtype in the acute phase. Stroke. 1998;29(8):1519–1524. doi: 10.1161/01.str.29.8.1519. [DOI] [PubMed] [Google Scholar]
- 14.Korpelainen JT, Sotaniemi KA, Huikuri HV, Myllylä VV. Circadian rhythm of heart rate variability is reversibly abolished in ischemic stroke. Stroke. 1997;28(11):2150–2154. doi: 10.1161/01.str.28.11.2150. [DOI] [PubMed] [Google Scholar]
- 15.Vinik AI, Maser RE, Mitchell BD, Freeman R. Diabetic autonomic neuropathy. Diabetes Care. 2003;26(5):1553–1579. doi: 10.2337/diacare.26.5.1553. [DOI] [PubMed] [Google Scholar]
- 16.Eckberg DL, Harkins SW, Fritsch JM, Musgrave GE, Gardner DF. Baroreflex control of plasma norepinephrine and heart period in healthy in healthy subjects and diabetic patients. The Journal of Clinical Investigation. 1986;78:366–374. doi: 10.1172/JCI112586. [DOI] [PMC free article] [PubMed] [Google Scholar]
- 17.Lishner M, Akselrod S, Mor Avi V, Oz O, Divon M, Ravid M. Spectral analysis of heart rate fluctuations. A non-invasive, sensitive method for the early diagnosis of autonomic neuropathy in diabetes mellitus. Journal of the Autonomic Nervous System. 1987;19(2):119–125. doi: 10.1016/0165-1838(87)90005-1. [DOI] [PubMed] [Google Scholar]
- 18.Hicks KK, Seifen E, Stimers JR, Kennedy RH. Effects of streptozotocin-induced diabetes on heart rate, blood pressure and cardiac autonomic nervous control. Journal of the Autonomic Nervous System. 1998;69(1):21–30. doi: 10.1016/s0165-1838(98)00004-6. [DOI] [PubMed] [Google Scholar]
- 19.Anigbogu CN, Adigun SA. Blood pressure, heart rate and autonomic reflexes in Plasmodium berghei malaria infection. Nigerian Quarterly J of Hospital Medicine. 1996;6:47–51. [Google Scholar]
- 20.National Research Council. Guide for the Care and Use of Laboratory Animals. Washington, DC, USA: National Academy Press; 1996. [Google Scholar]
- 21.Baldridge BR, Burgess DE, Zimmerman EE, et al. Heart rate-arterial blood pressure relationship in conscious rat before vs. after spinal cord transaction. American Journal of Physiology. 2002;283:R748–R756. doi: 10.1152/ajpregu.00003.2002. [DOI] [PubMed] [Google Scholar]
- 22.Anigbogu CN, Speakman RO, Silcox DL, et al. Extended longitudinal analysis of arterial blood pressure and heart rate in unanesthetized rats with type 1 diabetes mellitus and in age-matched controls. submitted to American Journal of Physiology. [Google Scholar]
- 23.Young ME, Razeghi P, Taegtmeyer H. Clock genes in the heart: characterization and attenuation with hypertrophy. Circulation Research. 2001;88(11):1142–1150. doi: 10.1161/hh1101.091190. [DOI] [PubMed] [Google Scholar]
- 24.Damiola F, Le Minli N, Preitner N, Kornmann B, Fleury-Olela F, Schibler U. Restricted feeding uncouples circadian oscillators in peripheral tissues from the central pacemaker in the suprachiasmatic nucleus. Genes and Development. 2000;14(23):2950–2961. doi: 10.1101/gad.183500. [DOI] [PMC free article] [PubMed] [Google Scholar]
- 25.Yamazaki S, Numano R, Abe M, et al. Resetting central and peripheral circadian oscillators in transgenic rats. Science. 2000;288(5466):682–685. doi: 10.1126/science.288.5466.682. [DOI] [PubMed] [Google Scholar]
- 26.Dowell RT, Atkins FL, Love S. Integrative nature and time course of cardiovascular alterations in the diabetic rat. The Journal of Clinical Investigation. 1986;78:366–374. doi: 10.1097/00005344-198603000-00026. [DOI] [PubMed] [Google Scholar]
- 27.Ramanadham S, Tenner TE., Jr. Chronic effects of streptozotocin diabetes on myocardial sensitivity in the rat. Diabetologia. 1986;29(10):741–748. doi: 10.1007/BF00870285. [DOI] [PubMed] [Google Scholar]
- 28.Dobrzynski E, Montanari D, Agata J, Zhu J, Chao J, Chao L. Adrenomedullin improves cardiac function and prevents renal damage in streptozotocin-induced diabetic rats. American Journal of Physiology. 2002;283(6):E1291–E1298. doi: 10.1152/ajpendo.00147.2002. [DOI] [PubMed] [Google Scholar]
- 29.Young ME, Wilson CR, Razeghi P, Guthrie PH, Taegtmeyer H. Alterations of the circadian clock in the heart by streptozotocin-induced diabetes. Journal of Molecular and Cellular Cardiology. 2002;34(2):223–231. doi: 10.1006/jmcc.2001.1504. [DOI] [PubMed] [Google Scholar]
- 30.Akiyama N, Okumura K, Watanabe Y, et al. Altered acethlcholine and norepinephrine concentrations in diabetic rat hearts. Role of parasympathetic nervous system in diabetic cardiomyopathy. Diabetes. 1989;38(2):231–236. doi: 10.2337/diab.38.2.231. [DOI] [PubMed] [Google Scholar]
- 31.Li X, Tanz RD, Chang KSK. Effect of age and methacholine on the rate and coronary flow of isolated hearts of diabetic rats. British Journal of Pharmacology. 1989;97(4):1209–1217. doi: 10.1111/j.1476-5381.1989.tb12580.x. [DOI] [PMC free article] [PubMed] [Google Scholar]
- 32.Kimball KA, Kennedy RH, Seifen E. Diabetes and the control of cardiac pacemaking activity. The FASEB Journal. 1991;5, article A1257 [Google Scholar]
- 33.Randall DC, Burgess DE, Zimmerman EE, et al. BP and HR cross correlations in rat before vs after spinal cord transection. The FASEB Journal. 2001;15, article A1145 [Google Scholar]
- 34.Brown L, Brown D, Randall D, Knapp C. Correlation of arterial pressure, heart rate and physical activity in rats. Federation Proceedings. 1987;46, article A1252 [Google Scholar]


