Abstract
The use of the harmonic mean model for predicting the activities of a given mixture and its constituents has not previously been explored in the context of combinatorial libraries and drug discovery. Herein, the analyses of historical data confirm the harmonic mean as an accurate predictor of mixture activity. The implications of these results are discussed.
Introduction
The use of mixtures is not a new concept in drug discovery; for example, approximately a 1,000 extracts derived from plants and used for the treatment of ailments are written about on tablets dating back to 2600 BC1. In modern drug discovery efforts mixtures are still being assessed in order to identify active compounds. These mixture samples include natural product extracts as well as systematically arranged mixtures of many compounds (such as mixture-based libraries2–3) and mixtures of few compounds such as cassette dosing and pooling4–6. In all these methods there is the need to distinguish the activity of one mixture sample from another. The activity of a mixture is of course driven by the individual components comprising the mixture. To this extent it is critical to understand how the individual components of a mixture contribute to the overall activity of the mixture sample. The predictive capabilities of averaging models on such mixtures are examined here using 36 case studies from eight different publications.
Methods
The use of the harmonic mean as a method of modeling the activity of a mixture, given the activity of that mixture’s constituents, is not new7–11. As first described by Finney7, the use of the harmonic mean as an averaging method is most mathematically suitable to model conditions based on the assumption of simple independent action. In fact, previous studies10–11 have used the harmonic mean as a metric for determining the extent to which simple independent action is present in a mixture. Its usefulness when applied to modeling the behavior of mixture-based combinatorial libraries associated specifically with drug discovery, however, is worthy of study. In particular, the effect of the mathematical properties of the harmonic mean on the efficacy of the use of mixture-based combinatorial libraries in drug discovery merits explicit exploration. This study therefore begins with a comparison of how the harmonic mean differs from other classical averaging methods, and these methods’ relative accuracies when applied to biological data where the assumption of simple independent action is appropriate.
The classical methods of averaging compared herein are the arithmetic mean, the geometric mean, and the harmonic mean. The arithmetic mean is defined by the equation:
where fi is the proportion of the ith mixture constituent with dosing point Xi. N is the total number of mixture constituents; if constituents are present in equal numbers, then fi = 1/N for all i. Similarly, the geometric mean is given by:
and the harmonic mean by:
Arithmetic meaning has been applied to simulated combinatorial libraries12. The geometric mean was calculated as an additional point of comparison, since it represents the use of the arithmetic mean on, for example, log10(IC50) values. In this study, because of the synthetic methods used to prepare the mixtures13–14, we assume that mixture constituents are present in equal proportions.
To demonstrate the relative effectiveness of the three above addition models, we use historical data which utilized the iterative process of deconvolution of mixture based libraries13–20 reported by our laboratories and other groups. These data are ideal to compare the performances of each averaging method as a model for the activity of mixtures, because both the IC50 value of each of the mixtures and all of the constituent submixtures (or individual compounds) in most cases were determined and have been reported. In total, 36 different mixtures, each consisting of 4 to 20 constituents, were analyzed. The number of compounds in the constituents of the mixtures studied ranged from 20 to 8,000. In most cases, the measured IC50 value was reported and was used for this analysis. For those constituents whose IC50 is large and is only published as a lower bound, we use this lower bound as that constituent’s IC50 if it is greater than the best IC50 of the previous iterative step. For example, in Houghten et. al.13 the mixture Ac-DVPAXX-NH2 is reported as having an IC50 value “>1,400 μM,” and Ac-DVPXXX-NH2 has a reported IC50 value of 41 μM, which is less than 1,400 μM, so the mixture Ac-DVPAXX-NH2 was assigned a value of 1,400 μM. In contrast, in Davis et. al.19 (egCB)(dG)XXT has a reported IC50 of “>10 μM” and (egCB)XXXT has a reported IC50 value of 40 μM, which is greater than 10. Data such as this is discarded since no averaging method could return an accurate result; if the constituents were assigned values which made them all more active than the mixture itself, the average would necessarily have to be as well. For those constituents whose IC50 was too large to have any published data, we assign to them the IC50 of the least active measured compound. For example, in Dooley et. al.14 the IC50 value of Ac-rfgxxx-NH2 is reported as “ND” since it was inactive at the highest dose tested. It is thus assigned a value of 69,000 nM, that of the least active measured constituent.
Results
For each mixture, the constituents of that mixture were added using each of the three addition models, and the results were compared to actual experimentally obtained mixture value. An example of these data, along with the outputs of each of the three addition models, is provided in Table 1. A summary of the results from all sources is presented in Table 2. The data in its entirety is in Table S1a–h in the supplementary section. Data points which were altered to have assigned values (as described above) are shown in italics.
Table 1.
An example of data used in this study.14
| Mixture | IC50 nM | |
|---|---|---|
| Ac-rfwinx-NH2 | 110 | |
| Constituent Compounds | IC50 nM | |
| Ac-rfwink-NH2 | 18 | |
| Ac-rfwinr-NH2 | 27 | |
| Ac-rfwina-NH2 | 37 | |
| Ac-rfwins-NH2 | 130 | |
| Ac-rfwinp-NH2 | 130 | |
| Ac-rfwinn-NH2 | 130 | |
| Ac-rfwinq-NH2 | 140 | |
| Ac-rfwing-NH2 | 170 | |
| Ac-rfwinm-NH2 | 180 | |
| Ac-rfwinh-NH2 | 200 | |
| Ac-rfwint-NH2 | 230 | |
| Ac-rfwihy-NH2 | 460 | |
| Ac-rfwinl-NH2 | 680 | |
| Ac-rfwinc-NH2 | 720 | |
| Ac-rfwinf-NH2 | 770 | |
| Ac-rfwinw-NH2 | 790 | |
| Ac-rfwine-NH2 | 960 | |
| Ac-rfwind-NH2 | 1,100 | |
| Ac-rfwinv-NH2 | 1,300 | |
| Ac-rfwini-NH2 | 5,600 | |
| Predicted Value | Scale Error | |
| Arithmetic Mean | 689 | 5.26 |
| Geometric Mean | 279 | 1.54 |
| Harmonic Mean | 110 | 0.00 |
Table 2.
A summary of the results of the prediction models
| Reference | Mixture Value | Arithmetic Mean | Scaled Error | Geometric Mean | Scaled Error | Harmonic Mean | Scaled Error |
|---|---|---|---|---|---|---|---|
| Houghten et. al. 13 | 250 | 1,123 | 3.49 | 872 | 2.49 | 399 | 0.60 |
| 41 | 1,330 | 31.44 | 1,050 | 24.60 | 83 | 1.03 | |
| 4.4 | 1,330.0 | 301.28 | 928.6 | 210.04 | 7.6 | 0.72 | |
| 0.38 | 11.72 | 29.85 | 4.94 | 12.01 | 0.48 | 0.26 | |
| Dooley et. al.14 | 14,000 | 22,000 | 0.57 | 12,268 | 0.12 | 5,740 | 0.59 |
| 1,500 | 4,510 | 2.01 | 2,439 | 0.63 | 1,587 | 0.06 | |
| 480 | 2,067 | 3.31 | 1,165 | 1.43 | 755 | 0.57 | |
| 110 | 689 | 5.26 | 279 | 1.54 | 110 | 0.00 | |
| Dooley et. al. 15 | 2,701 | 14,654 | 4.43 | 8,027 | 1.97 | 4,066 | 0.51 |
| 907 | 1,303 | 0.44 | 1,068 | 0.18 | 832 | 0.08 | |
| 106 | 460 | 3.34 | 263 | 1.48 | 158 | 0.50 | |
| 24 | 33 | 0.36 | 21 | 0.14 | 14 | 0.42 | |
| Pinilla et. al. 16 | 1,000 | 721,855 | 720.86 | 176,361 | 175.36 | 910 | 0.09 |
| 400 | 4,233 | 9.58 | 3,139 | 6.85 | 1,928 | 3.82 | |
| 48 | 69 | 0.43 | 41 | 0.15 | 25 | 0.47 | |
| 6.6 | 10.0 | 0.51 | 8.2 | 0.25 | 7.1 | 0.08 | |
| Houghten et. al. 17 | 3,452 | 21,731 | 5.30 | 15,245 | 3.42 | 11,392 | 2.30 |
| 3,254 | 27,728 | 7.52 | 15,564 | 3.78 | 1,841 | 0.43 | |
| 153 | 617 | 3.03 | 365 | 1.38 | 171 | 0.11 | |
| 28 | 86 | 2.07 | 62 | 1.23 | 50 | 0.77 | |
| Appel et. al. 18 | 20,000 | 1,261,005 | 62.05 | 851,322 | 41.57 | 87,893 | 3.39 |
| 7,329 | 800,864 | 108.27 | 194,739 | 25.57 | 6,083 | 0.17 | |
| 376 | 516 | 0.37 | 461 | 0.23 | 412 | 0.10 | |
| 257 | 292 | 0.14 | 248 | 0.03 | 224 | 0.13 | |
| 12,780 | 624,420 | 47.86 | 304,492 | 22.83 | 7,870 | 0.38 | |
| 408 | 859,080 | 2,104.59 | 396,499 | 970.81 | 739 | 0.81 | |
| 37 | 5,825 | 156.42 | 737 | 18.93 | 28 | 0.24 | |
| Davis et. al. 19 | 30 | 83 | 1.75 | 73 | 1.45 | 61 | 1.03 |
| 20 | 41 | 1.04 | 36 | 0.82 | 30 | 0.50 | |
| Ecker et. al. 20 | 4 | 8 | 0.91 | 5 | 0.18 | 2 | 0.57 |
| 0.5 | 7.5 | 14.08 | 3.5 | 6.00 | 0.6 | 0.15 | |
| 0.15 | 0.62 | 3.13 | 0.42 | 1.82 | 0.24 | 0.57 | |
| 0.08 | 0.28 | 2.53 | 0.18 | 1.22 | 0.11 | 0.37 | |
| 0.05 | 0.08 | 0.65 | 0.07 | 0.48 | 0.06 | 0.26 | |
| 0.03 | 0.04 | 0.35 | 0.04 | 0.27 | 0.04 | 0.17 | |
| 0.02 | 0.03 | 0.38 | 0.02 | 0.17 | 0.02 | 0.02 |
Because the data is taken across mixtures with varying complexities and activities, the numerical scale for each data point varies widely. If the error in a model-predicted value were simply the difference between the prediction and the experimental value, they would not be numerically comparable. Therefore, the error was scaled by the experimental value, so that
Thus, the scaled error is as a fraction of the experimental value. The scaled error for each prediction is also included in Table 1 and 2. The average scaled error for the arithmetic mean model is 101.10, the average scaled error for the geometric mean model is 42.82, and the average error for the harmonic mean model is 0.62. Thus the harmonic mean was the only addition model that consistently was capable of capturing to within an order of magnitude the IC50 value of the resultant mixture given the IC50 value of that mixture’s constituents. The maximum harmonic mean scaled error was only 3.82, as compared to maximum scaled errors of 970.81 for the geometric mean and 2104.59 for the arithmetic mean. The harmonic mean has lower scaled errors than both other methods for all but five of the analyzed mixtures; in those five cases, the scaled error is below 0.60 for the harmonic mean as well, meaning both other methods gave reasonably good approximations.
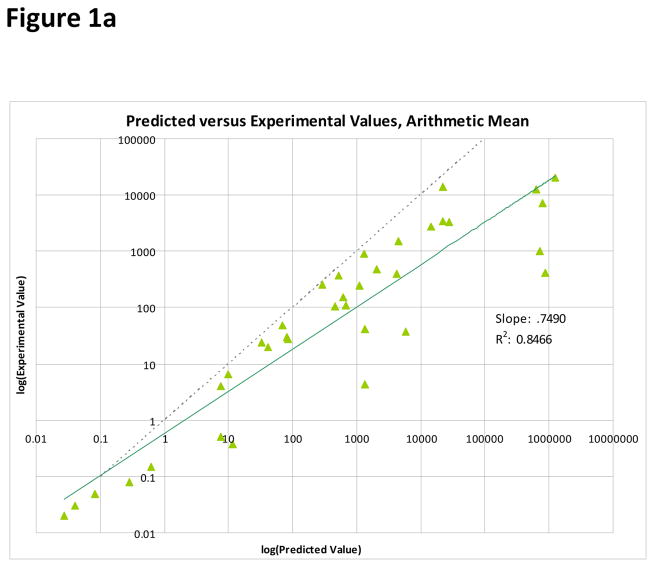
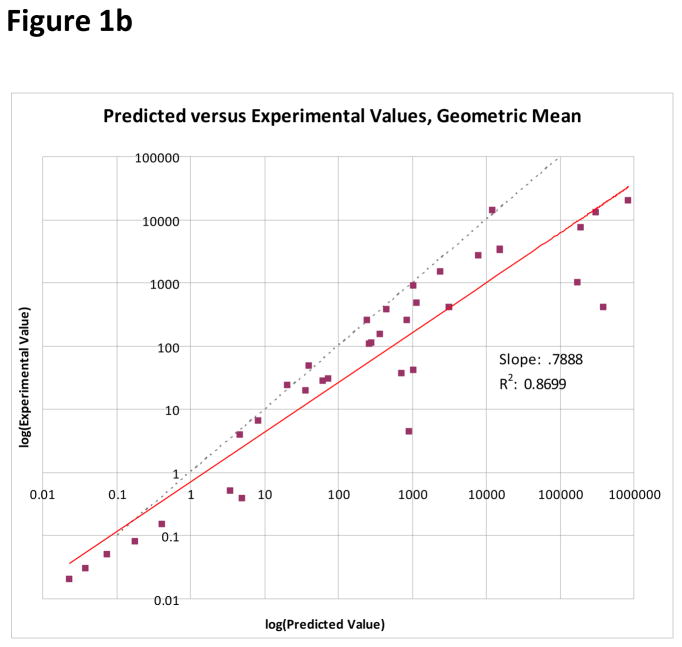
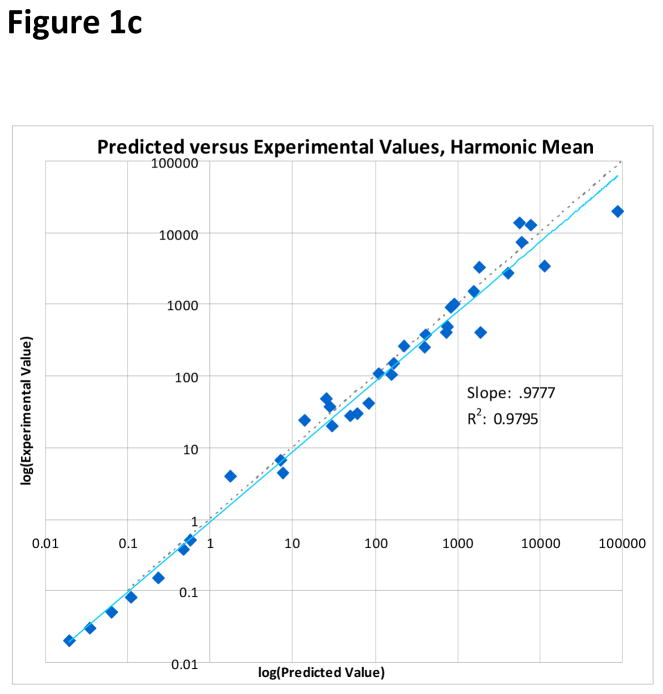
To compare the ability of each of the three averaging models to predict the experimental mixture IC50 value, a least-squares linear regression was performed. Least-squares linear regression allows each model to be evaluated as a whole, rather than looking at individual predictions. Because of the large difference in scale amongst the data points, the regression was performed on the logarithms of the IC50 values. The functional form of the fit curves was therefore
Clearly, for a perfect model log(Experimental IC50) = log(Model IC50), and so a measure of how well the addition model is predicting the mixture IC50 is how close a1 is to one and a0 is to zero. Additionally, each fit also includes an R2 value. The R2 value is a measure of the goodness-of-fit, and represents the percentage of variance in the data that is explained by the model. For the arithmetic mean model, a1 = 0.7490, a0 = −0.2278, and R2 = 0.8466. For the geometric mean model, a1 = 0.7888, a0 = −0.1549, and R2 = 0.8699. For the harmonic mean model, a1 = 0.9777, a0 = −0.0390, and R2 = 0.9795. Plots of each of the addition model’s predictions against the experimental values, along with the least-squares linear regression best fit line, are in Figure 1. The harmonic mean model both provides a better fit to the data given its superior R2 value, and also provides a slope and intercept very close to ideal.
Figure 1.
The Implications of a Harmonic Mean Model
The above analyses strongly suggest that the theory7, 9–10 which predicts the harmonic mean as the averaging methodology for mixtures under the assumption of simple independent action is valid in the data analyzed above. It should be noted that in the data surveyed above the complexity of both the parent mixture and its constituents varies drastically from case to case. See Table 3: this variation does not affect the accuracy of the harmonic mean, which yielded significantly more accurate results than the other two standard averaging methodologies studied. In most cases the harmonic mean predicted the experimental results with high precision. This fact strongly suggests that the harmonic mean is an appropriate way of modeling the behavior of many of the mixture-based combinatorial libraries used in basic research and drug discovery12–21. The ability to predict the outcomes of combinatorial mixture-based experiments is useful for a variety of practical dosing and experimental design applications, such as deviation from the harmonic mean as a metric for determining the existence of synergy or antagonism10–11. In the context of positional scanning, where each position is a different arrangement of the same constituents, the harmonic mean of the IC50 values at each position ought to equal one another. For example, Dooley and Houghten[21] presents positional scanning data for six positions, which has been reproduced in Table S2. Each position consists of eighteen mixtures, each of which contains 1,889,568 individual compounds. The harmonic means of the IC50s of these mixtures at each position are 340, 271, 168, 248, 263, and 211. Thus it can be seen that the maximal scaled error in this set is only 1.02, and that most pair-wise comparisons have significantly smaller scaled errors.
Table 3.
Mixture complexities and prediction model errors
| Reference | Mixture Constituents | Compounds per Constituent | Arithmetic Scaled Error | Geometric Scaled Error | Harmonic Scaled Error |
|---|---|---|---|---|---|
| Houghten et. al. 13 | 20 | 8000 | 3.49 | 2.49 | 0.60 |
| 20 | 400 | 31.44 | 24.60 | 1.03 | |
| 20 | 20 | 301.28 | 210.04 | 0.72 | |
| 20 | 1 | 29.85 | 12.01 | 0.26 | |
| Dooley et. al.14 | 20 | 8000 | 0.57 | 0.12 | 0.59 |
| 20 | 400 | 2.01 | 0.63 | 0.06 | |
| 20 | 20 | 3.31 | 1.43 | 0.57 | |
| 20 | 1 | 5.26 | 1.54 | 0.00 | |
| Dooley et. al. 15 | 20 | 8000 | 4.43 | 1.97 | 0.51 |
| 20 | 400 | 0.44 | 0.18 | 0.08 | |
| 20 | 20 | 3.34 | 1.48 | 0.50 | |
| 20 | 1 | 0.36 | 0.14 | 0.42 | |
| Pinilla et. al. 16 | 20 | 400 | 720.86 | 175.36 | 0.09 |
| 20 | 400 | 9.58 | 6.85 | 3.82 | |
| 20 | 20 | 0.43 | 0.15 | 0.47 | |
| 20 | 1 | 0.51 | 0.25 | 0.08 | |
| Houghten et. al. 17 | 20 | 8000 | 5.30 | 3.42 | 2.30 |
| 20 | 400 | 7.52 | 3.78 | 0.43 | |
| 20 | 20 | 3.03 | 1.38 | 0.11 | |
| 20 | 1 | 2.07 | 1.23 | 0.77 | |
| Appel et. al. 18 | 20 | 8000 | 62.05 | 41.57 | 3.39 |
| 20 | 400 | 108.27 | 25.57 | 0.17 | |
| 20 | 20 | 0.37 | 0.23 | 0.10 | |
| 20 | 1 | 0.14 | 0.03 | 0.13 | |
| 20 | 400 | 47.86 | 22.83 | 0.38 | |
| 20 | 20 | 2,104.59 | 970.81 | 0.81 | |
| 20 | 1 | 156.42 | 18.93 | 0.24 | |
| Davis et. al. 19 | 12 | 144 | 1.75 | 1.45 | 1.03 |
| 12 | 12 | 1.04 | 0.82 | 0.50 | |
| Ecker et. al. 20 | 4 | 4096 | 0.91 | 0.18 | 0.57 |
| 4 | 1024 | 14.08 | 6.00 | 0.15 | |
| 4 | 256 | 3.13 | 1.82 | 0.57 | |
| 4 | 64 | 2.53 | 1.22 | 0.37 | |
| 4 | 16 | 0.65 | 0.48 | 0.26 | |
| 4 | 4 | 0.35 | 0.27 | 0.17 | |
| 4 | 1 | 0.38 | 0.17 | 0.02 |
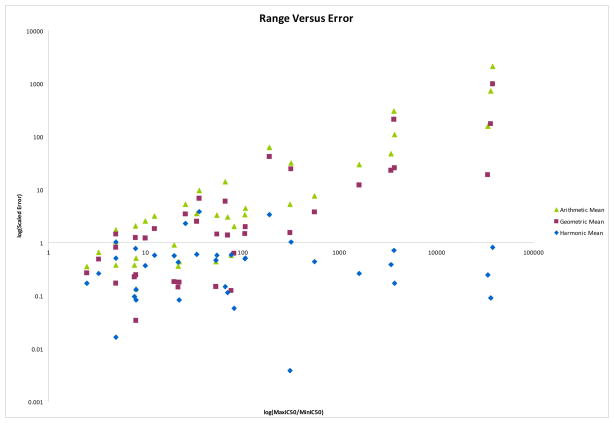
In addition to the above, the mathematical properties of the various averaging methods can help validate the usage of combinatorial mixture libraries in basic research and drug discovery and explain the impressive successes the process has already achieved2–6, 13–21. The harmonic mean model differs from the other models primarily in its treatment of extreme numerical ranges within the data. Here the range of the data is defined to be the ratio of the highest constituent IC50 value to the lowest. A log-log plot of this value versus the scaled error for each of the three addition models is shown in Figure 2. This plot shows how the harmonic mean is able to outperform the other addition models: while at low ranges (with a ratio of most to least active less than 100) all three methods perform similarly, the scaled error of the arithmetic and geometric models rises steadily as the range increases, while the harmonic mean maintains a similar level of scaled error throughout. In particular, the harmonic mean is more influenced by active compounds having smaller IC50 values than the other addition methods; that the experimental data is well-predicted by the harmonic mean indicates that the experimental behavior of mixture based combinatorial libraries behaves similarly, with active compounds driving the activity rather than inactive compounds diluting it.
Figure 2.
To further elucidate this point, we consider the hypothetical situation in which we define an active compound to have a fixed IC50 value of α and an inactive compound to have a fixed IC50 value of β. Then the IC50 of a mixture containing Nα active compounds and Nβ inactive compounds is given by
for the arithmetic mean model,
for the geometric mean model, and
for the harmonic mean model. From these equations, one can evaluate the ability to detect active compounds in a mixture governed by the harmonic mean model, and compare it to the abilities of the arithmetic and geometric mean models.
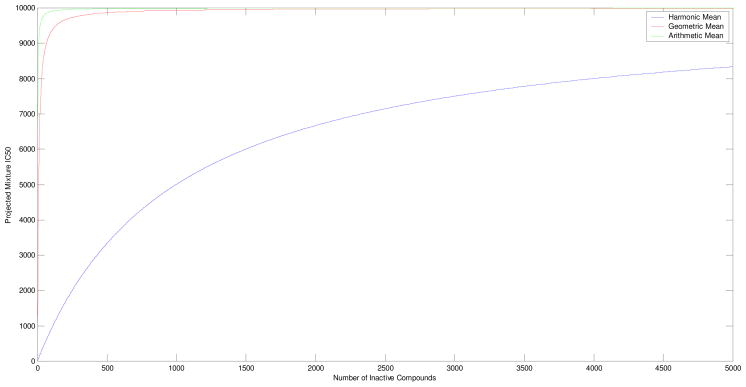
For example, if a single highly active compound with an IC50 of 10 nM (α=10 and Nα=1) were in a mixture with a number of inactive compounds with IC50s of 10,000 nM (β=10,000), the aforementioned equations would yield a predicted value for the IC50 of the resultant mixture. Figure 3 is a plot of the number of inactive compounds versus the resulting activity of the mixture, given each of the averaging models. As is clear from the graph, the IC50 of the resultant mixture increases much more slowly for the harmonic mean than for the other two methodologies; therefore, mixtures that are modeled by harmonic mean averaging are projected to be significantly more active than if the arithmetic or geometric mean were used. A mixture comprised solely of poorly active compounds (all having an IC50 of 10,000nM) would have an IC50 of 10,000 nM in this scenario, so in order for the active compound to be detected the resulting mixture must have an IC50 value small enough to distinguish itself from the 10,000 nM mixture inclusive of experimental error. For example, if the experimental error is approximately 20%, then in order to ensure the mixture containing the active compound is more active than the 10,000 nM mixture when tested, it must have a true IC50 value of 6,600 nM or below. The arithmetic mean model would predict that only three 10,000 nM compounds would be needed to make the mixture with the 10 nM compound have an IC50 greater than 6,600 nM. Similarly, the geometric mean model would predict that only seventeen 10,000 nM compounds would be needed. In contrast, the harmonic mean model indicates that 1,939 compounds, each having an activity of 10,000 nM, would be needed. Since these numbers are independent of scale, these results may be restated: Under the arithmetic mean model, a mixture containing less than 25.0% active compounds would not be detected. Under the geometric mean model, a mixture containing less than 5.5% active compounds would not be detected. But under the harmonic mean model, a mixture containing 0.052% of active compounds would still be detectable. It should be noted that this observation can be applied to mixtures in which the constituents comprising the mixture are not present in the same concentration as in the case of natural product extracts. In other words as long as 0.052% of the total composition of the mixture contains an “active component” that mixture will be distinguishable from a totally inactive mixture sample.
Figure 3.
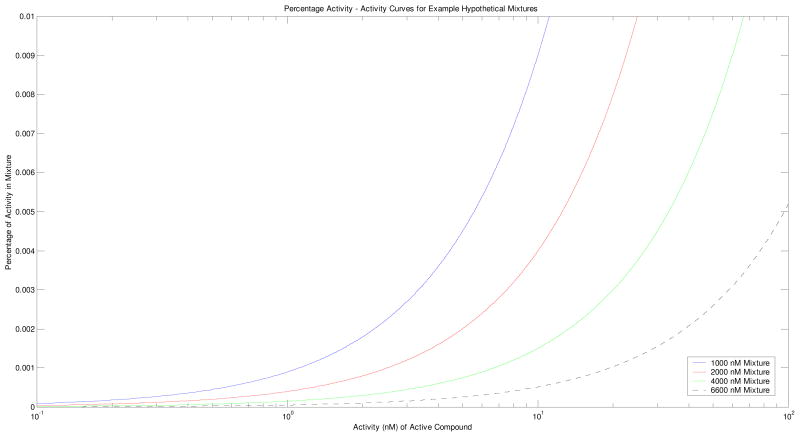
It is also possible to use the above arguments in a reversed fashion. If we continue with the above example in which an inactive compound has an IC50 of 10,000 nM, and we assume the validity of the harmonic mean, then given a mixture activity it is possible to mathematically derive a range of activity percentages associated with different activity levels of individual compounds. Such relationships are plotted in Figure 4 for differing mixture activity values. A mixture with an IC50 of 1000 nM, for example, may contain 1% of individual compounds with IC50s of 10 nM, or 0.1% of individual compounds with IC50s of 1 nM. The maximal IC50 in order to guarantee detectability in this example is again 6600 nM, and so we can see such a mixture may contain 0.5% of individual compounds with IC50s of 100 nM, 0.05% of individual compounds with IC50s of 10 nM, or 0.005% of individual compounds with IC50s of 1 nM. Conversely, a mixture that is indistinguishable from inactive because its IC50 exceeds 6600 nM cannot even contain 0.5% of individual compounds with IC50 values of 100 nM, justifying the exclusion of such a mixture in further testing.
Figure 4.
Discussion
The analyses presented here have significant implications on how mixtures can be used in drug discovery and, in part, explains the previous successes of research efforts where mixtures have been used, such as natural product extracts and systematically arranged mixtures2–3, 13–23. The active compounds isolated in various natural product studies24–27 are often a very small percentage of the original material, and yet are still detectable. A clear distinction in the activity of mixtures containing highly active compounds and those that do not has been observed even in cases where the mixtures contained thousands of separate components. In the past, one of the reasons for this distinction has been posited as an abundance of similarly active compounds in a given mixture28. While this can a valid statement in systematically arranged mixtures, it is surely not necessarily true in natural products, and to a large degree the reason for this distinction can rather be attributed to the harmonic meaning of the individual components. Indeed, the reactions occurring in living organisms mirror qualitatively this behavior, with only trace amounts of specific substances playing vital biological roles29.
There are several additional applications of the harmonic mean currently being explored for future studies. As discussed above, in synthetic libraries arrayed in positional scanning format, the harmonic mean of the IC50 values at each position ought to equal one another; therefore, the integrity of the synthesis of a positional scanning library may be determined by comparing the harmonic means at each position and looking for significant deviation. A similar usage for the harmonic mean may be applied to pooling strategies. Algorithms could be developed for determining how to pool compounds in a given library in such a way as to identify large deviations from predicted harmonic means. Such deviations may indicate possible problems coming from pipetting errors or aggregation, and so these samples could be flagged for retesting. Finally, the harmonic mean could be used to determine if multiple compounds act in a simple competitive manner when tested in a given assay. If constituent compounds of known concentration are mixed, a substantial deviation of this mixture’s activity from the expected harmonic mean could provide insights into possible synergy, antagonism, or multiple paths of action.
Although in this report the analysis was restricted to biological assays where a simple independent action is assumed, theory7, 9–10 suggests that, qualitatively, the harmonic mean’s tendency to weight active compounds heavily is more widely applicable. The implications of other mathematical models, such as those for situations which are synergistic or anti-synergistic in nature, on the behavior of mixture-based combinatorial libraries associated with basic research and drug discovery are also currently being explored.
Supplementary Material
Acknowledgments
This work is supported in part by the State of Florida, Executive Office of the Governor’s Office of Tourism, Trade, and Economic Development as well as NIDA R21 DA019620 and Multiple Sclerosis National Research Institute.
Footnotes
Supporting Information Available: All data compiled in the study is available in a supporting section. This material is available free of charge via the Internet at http://pubs.acs.org.
References
- 1.Newman DJ, Cragg GM, Snader KM. The influence of natural products upon drug discovery. Nat Prod Rep. 2000;17:215–234. doi: 10.1039/a902202c. [DOI] [PubMed] [Google Scholar]
- 2.Nagasaki H. The pharmacological properties of novel MCH1 receptor antagonist isolated from combinatorial libraries. Eur J Pharmacol. 2009;602:194–202. doi: 10.1016/j.ejphar.2008.10.068. [DOI] [PMC free article] [PubMed] [Google Scholar]
- 3.Houghten RA, Pinilla C, Giulianotti MA, Appel JR, Dooley CT, Nefzi A, Ostresh JM, Yu Y, Maggiora GM, Medina-Franco JL, Brunner D, Schneider J. Strategies for the use of mixture-based synthetic combinatorial libraries: Scaffold ranking direct testing in vivo enhanced deconvolution by computational methods. J Comb Chem. 2008;10:3–19. doi: 10.1021/cc7001205. [DOI] [PubMed] [Google Scholar]
- 4.Kainkaryam RM, Woolf PJ. Pooling in high-throughput drug screening. Cur Opin Drug Discov Devel. 2009;12:339–350. [PMC free article] [PubMed] [Google Scholar]
- 5.Wolf KK, Vora S, Webster LO, Generaux GT, Polli JW, Brouwer KL. Use of cassette dosing in sandwich-cultured rat and human hepatocytes to identify drugs that inhibit bile acid transport. Toxicol in Vitro. 2010;24:297–309. doi: 10.1016/j.tiv.2009.08.009. [DOI] [PMC free article] [PubMed] [Google Scholar]
- 6.Smith NF, Raynaud FI, Workman P. The application of cassette dosing for pharmacokinetic screening in small-molecule cancer drug discovery. Mol Cancer Ther. 2007;6:428–440. doi: 10.1158/1535-7163.MCT-06-0324. [DOI] [PubMed] [Google Scholar]
- 7.Finney DJ. Probit Analysis. 3. Cambridge University Press; Cambridge: 1971. [Google Scholar]
- 8.Smyth HF, Jr, Weil CS, Carpenter CP. An exploration of joint toxic action: twenty-seven industrial chemicals intubated in rats in all possible pairs. Toxicol Appl Pharmacol. 1969;14:340–347. doi: 10.1016/0041-008x(69)90115-x. [DOI] [PubMed] [Google Scholar]
- 9.Hoel DG. Statistical Aspects of Chemical Mixtures. In: Vouk VB, Butler GC, Upton AC, Parke DV, Asher SC, editors. Methods for Assessing the Effects of Mixtures of Chemicals. Wiley; New York: 1987. pp. 369–377. [Google Scholar]
- 10.Talalay P, Chou T. Quantitative analysis of dose-effect relationships: The combined effects of multiple drugs or enzyme inhibitors. In: Webber G, editor. Advances in Enzyme Regulation. Vol. 22. Pergamon; New York: 1984. pp. 27–55. [DOI] [PubMed] [Google Scholar]
- 11.Feng BY, Shiochet BK. Synergy and antagonism of promiscuous inhibition in multiple-compound mixtures. J Med Chem. 2006;49:2151–2154. doi: 10.1021/jm060029z. [DOI] [PMC free article] [PubMed] [Google Scholar]
- 12.Frier SM, Konings DAM, Wyatt JR, Ecker DJ. Deconvolution of combinatorial libraries for drug discovery: a model system. J Med Chem. 1995;38:344–352. doi: 10.1021/jm00002a016. [DOI] [PubMed] [Google Scholar]
- 13.Houghten RA, Pinilla C, Blondelle SE, Appel JR, Dooley CT, Cuervo JH. Generation and use of synthetic peptide combinatorial libraries for basic research and drug discovery. Nature. 1991;354:84–86. doi: 10.1038/354084a0. [DOI] [PubMed] [Google Scholar]
- 14.Dooley CT, Chung NN, Wilkes BC, Schiller PW, Bidlack JM, Pasternak GW, Houghten RA. An all D-amino acid opioid peptide with central analgesic activity from a combinatorial library. Science. 1994;266:2019–2022. doi: 10.1126/science.7801131. [DOI] [PubMed] [Google Scholar]
- 15.Dooley CT, Chung NN, Schiller PW, Houghten RA. Acetalins: Opioid receptor antagonists determined through the use of synthetic peptide combinatorial libraries. Proc Natl Acad Sci US A. 1993;90:10811–10815. doi: 10.1073/pnas.90.22.10811. [DOI] [PMC free article] [PubMed] [Google Scholar]
- 16.Pinilla C, Appel JR, Houghten RA. Synthetic peptide combinatorial libraries (SPCLs): identification of the antigenic determinant of β-endorphin recognized by monoclonal antibody 3E7. Gene. 1993;128:71–76. doi: 10.1016/0378-1119(93)90155-v. [DOI] [PubMed] [Google Scholar]
- 17.Houghten RA, Appel JR, Blondelle SE, Cuervo CT, Dooley CT, Pinilla C. The use of synthetic peptide combinatorial libraries for the identification of bioactive peptides. Biotechniques. 1992;13:412–421. [PubMed] [Google Scholar]
- 18.Appel JR, Pinilla C, Houghten RA. Identification of related peptides recognized by a monoclonal antibody using a synthetic peptide combinatorial library. Immunomethods. 1992;1:17–23. [Google Scholar]
- 19.Davis PW, Vickers TA, Wilson-Lingardo L, Wyatt JR, Guinosso CJ, Sanghvi YS, DeBaets EA, Acevedo OL, Cook PD, Ecker DJ. Drug leads from combinatorial phosphodiester libraries. J Med Chem. 1995;38:4363–4366. doi: 10.1021/jm00022a002. [DOI] [PubMed] [Google Scholar]
- 20.Ecker DJ, Vickers TA, Hanecak R, Driver V, Anderson K. Rational screening of oligonucleotide combinatorial libraries for drug discovery. Nucleic Acids Res. 1993;21:1853–1856. doi: 10.1093/nar/21.8.1853. [DOI] [PMC free article] [PubMed] [Google Scholar]
- 21.Dooley CT, Houghten RA. The use of positional scanning synthetic peptide combinatorial libraries for the rapid determination of opioid receptor ligands. Life Sci. 1993;52:1509–1517. doi: 10.1016/0024-3205(93)90113-h. [DOI] [PubMed] [Google Scholar]
- 22.Li JWH, Vederas JC. Drug Discovery and Natural Products: End of an Era or an Endless Frontier? Science. 2009;325:161–165. doi: 10.1126/science.1168243. [DOI] [PubMed] [Google Scholar]
- 23.Butler MS. The role of natural product chemistry in drug discovery. J Nat Prod. 2004;67:2141–2153. doi: 10.1021/np040106y. [DOI] [PubMed] [Google Scholar]
- 24.Cantrell CL, Richheimer SL, Nicholas GM, Schmidt BK, Bailey DT. seco-Hinokiol, a new abietane diterpenoid from Rosmarines officinalis. J Nat Prod. 2005;68:98–100. doi: 10.1021/np040154i. [DOI] [PubMed] [Google Scholar]
- 25.Nicholas GM, Molinski TF. Enantiodivergent biosynthesis of the dimeric sphingolipid oceanapiside from the marine sponge Oceanapia phillipensis. Determination of remote stereochemistry. J Am Chem Soc. 2000;122:4011–4019. [Google Scholar]
- 26.Marquez B, Verdier-Pinard P, Hamel E, Gerwick WH. Curacin D: an antimitotic agent from the marine cyanobacterium Lyngbya majuscule. Phytochemistry. 1998;49:2387–2389. doi: 10.1016/s0031-9422(98)00365-3. [DOI] [PubMed] [Google Scholar]
- 27.Gerard J, Lloyd R, Barsby T, Haden P, Kelly MT, Andersen RJ. Massetolides A-H, antimycrobacterial cyclic depsipeptides produced by two pseudomonads isolated from marine habitats. J Nat Prod. 1997;60:223–229. doi: 10.1021/np9606456. [DOI] [PubMed] [Google Scholar]
- 28.Terrett NK, Gardner M, Gordon DW, Kobylecki RJ, Steele J. Combinatorial synthesis – The design of compound libraries and their application to drug discovery. Tetrahedron. 1995;51:8135–8173. [Google Scholar]
- 29.Uppsala University Hospital (“Laborationslista”). Artnr 40284 Sj74a. Issued on April 22: 2008
Associated Data
This section collects any data citations, data availability statements, or supplementary materials included in this article.


