

Abstract
The conformational stability of the β-hairpin miniprotein, CLN025, a variant of chignolin in which the N- and C-terminal Gly are replaced by Tyr, in various concentrations of GdmCl and urea was examined by Molecular Dynamics simulations and Electronic Circular Dichroism (ECD) spectropolarimetry. The peptide maintains its β-hairpin conformation in GdmCl and urea solutions. In GdmCl, Gly7 influences the turn to reduce the number of Asp3-Gly7 H-bonds and the Tyr1-Trp9 H-bond is lost. The structure of the peptide is less stable in 3 M GdmCl than in water or 6 M GdmCl, because the number of Asp3-Thr8 and Tyr1-Tyr10 H-bonds are reduced and the Tyr2 side-chain moves away from the Pro4 and Trp9 side-chains and towards the Tyr10 side-chain. This reduces the number of Tyr2-Pro4 CH-π interactions and Tyr2-Trp9 and Tyr1-Tyr10 aromatic-aromatic (Ar-Ar) interactions and increases the number of Tyr2-Tyr10 Ar-Ar interactions. In 6 M GdmCl at 300 and 333 K, the number of Tyr1-Tyr10 and Asp3-Thr8 H-bonds increases, but fewer structures have Tyr2-Pro4 CH-π and Tyr1-Tyr10 and Tyr2-Trp9 Ar-Ar interactions. In urea, Gly7 is in a mixture of β-turn and random meander structures and the number of Asp3-Thr6 and Tyr1-Tyr10 H-bonds are reduced as are the number of Tyr2-Pro4 CH-π interactions and Tyr1-Tyr10 and Tyr2-Trp9 Ar-Ar interactions. In 4 M urea, a shorter turn places Gly7 in to the β-sheet region and Tyr10 is pushed out into the solvent. In 8 M urea, the number of Asp3-Glu5 H-bonds is increased and the β-sheet is lost, but the electrostatic interaction between the charged termini is restored and a cation-π interaction between the indolyl ring of Trp9 and the positively charged N-terminus is formed. In 8 M urea at 333 K, the β-hairpin conformation is almost lost. The structure of CLN025 is stable, because the weakly polar interactions and H-bonds maintain the β-hairpin conformation in the various environments. CLN025 should not be considered a miniprotein, because it lacks a well-defined tertiary structure, it is resistant to denaturation, does not have an increased heat capacity near its melting temperature and the structures near and above the melting temperature retain a β-hairpin conformation.
Keywords: CLN025, chignolin, urea, GdmCl, denaturation, beta-hairpins, miniprotein, Molecular Dynamics, weakly polar interactions, Ar-Ar interactions
Introduction
Molecular Dynamics (MD) simulations have revealed that the denaturation of proteins by urea is caused by a loss of water from the first solvent shell and a consequent in-flow of urea, due to greater stabilization of urea molecules in the first solvent shell than in the bulk and to strong interactions with the protein.1 Urea can form H-bonds with the backbone and hydrophillic residues and quadrupole-quadrupole interactions with aromatic residues which are energetically more favorable than protein-protein interactions and cause the peptide to unfold.1 While more protein-urea H-bonds are formed, they are weaker than water-water or protein-water H-bonds2 which can cause urea to self-aggregate.3 Numerous studies have shown that the H-bonding of a protein with urea is the dominant interaction especially in α-helices.4-6 When partial charges of the atoms in urea are scaled, hyper-polar urea (partial charges increased by 50%) tends to stabilize the native protein structure, while hypo-polar urea (partial charges decreased by 50%) causes the protein to unfold. This indicates that dispersion is the main driving force for denaturation and the protein-urea H-bonds contribute to the overall energetics by preventing unsatisfied H-bonds at the protein backbone.7 Partially unfolded states resulting from thermal fluctuations could be stabilized by urea and prevent refolding.8
GdmCl is typically 2 to 2.5 times more effective as a denaturant than urea, because Gdm+ can interact with aromatic residues9 through cation-π interactions10 and reduce the entropic cost of hydration of hydrophobic groups by displacing water from the surface of the protein.11 Gdm+ can interact with side-chains of aromatic residues, Arg, Gln and with other Gdm+ ions by stacking with residence times around 30 ps.11 The longer range electrostatic effect of GdmCl does not perturb the structure of the solvent close to the peptide.12
While Urea and GdmCl are effective denaturants, many proteins retain their hydrophobic core and native secondary structures in the denatured state.13, 14 Urea has also been shown to promote formation of left-handed PPII helical structures in short proteins and peptides depending on sequence and often causes the molar ellipticity near 230 nm to increase.15
CLN025, Tyr1-Tyr2-Asp3-Pro4-Glu5-Thr6-Gly7-Thr8-Trp9-Tyr10 (Figure 1), is a variant of chignolin in which the terminal Gly residues were replaced by Tyr residues. It is regarded as a miniprotein that forms a stable β-hairpin with an apparent melting temperature of 70 °C, due to the shape of its free energy surface, apparent two-state folding and well-defined 3D structure.16 The β-hairpin is stabilized by an electrostatic interaction between the charged termini, cross-strand H-bonds, aromatic-aromatic (Ar-Ar) interactions and a CH-π interaction between Try2 and Pro4.16 CLN025 is more stable than chignolin due to the additional Ar-Ar interactions of the terminal Tyr residues which increase the stabilization energy by -4.83 kcal mol-1 and the melting temperature by 27.9 K.16
Figure 1.
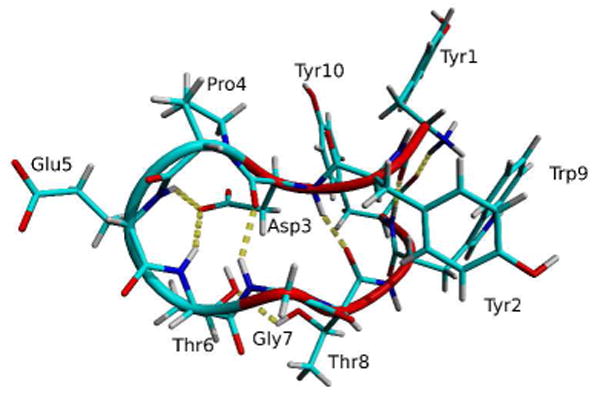
Crystal structure of CLN025.16 The backbone structure represented by a tube. Random meander is cyan, β-sheet is red and the H-bonds are yellow dotted lines.
The weakly polar interactions play an important role in the stability of proteins due to their strength which can be as strong as hydrogen bonds17-24 and their ubiquitous presence in polypeptides. They stabilize both secondary17 and tertiary structures.20, 22, 24 CLN025 is one of the numerous β-hairpins designed to take advantage of the weakly polar interactions.25-29
The ability of CLN025 to form a stable β-hairpin in TFE, MeOH and DMSO as well as in water at 90° C was previously attributed to the replacement of the Tyr2-Trp9 Ar-Ar interaction with a Tyr1-Trp9 Ar-Ar interaction and the formation of new H-bonds that compensate for the effects of these solvents.30,31 In this study, MD simulations and Electronic Circular Dichroism (ECD) spectropolarimetry are used to investigate the conformational stability of the CLN025 β-hairpin in different concentrations of urea and GdmCl and to examine the changes in the H-bonds and weakly polar interactions. Conformational stability was investigated by ECD using 0 to 6 M GdmCl and 0 to 8 M urea in 0.5 M increments. Furthermore, MD simulations were used to explain the conformational behavior of the peptide in SPC water, 3 and 6 M GdmCl and 4 and 8 M urea as well as to estimate thermodynamic properties of the peptide.
Methods
Synthesis
CLN025 was synthesized and purified as previously described30 with a CEM Liberty microwave peptide synthesizer using a 5 molar excess of Nα-Fmoc protected amino acids. The peptide was identified using a SCIEX API150EX mass spectrometer and characterized by RP-HPLC with a Jupiter C18 column (5 μm, 200 mm × 4.6 mm).
Electronic Circular Dichroism
ECD spectra were recorded using a Jasco J-810 Spectropolarimeter by performing 20 scans from 185 to 250 nm at 100 nm/min scan speed in a 0.05 cm path length quartz cell. The background spectra of the solvents were subtracted and the mean residue molar elipticities were calculated using peptide concentrations determined by quantitative RP-HPLC32 with a Jupiter C18 column (5 μm, 200 mm × 4.6 mm). 100 μM solutions of CLN025 dissolved in 20 mM KH2PO4-K2HPO4 buffer (pH 7.0) containing either 0 to 6 M GdmCl or 0 to 8 M urea were used. It was determined previously,30 that the peptide does not aggregate at this concentration.
Molecular Dynamics Simulations
MD simulations and trajectory analysis were performed with the GROMACS 3.3.1 software package33, 34 the GROMOS 96 force field and the 53a6 parameter set35, 36 using the X-ray structure of CLN02516 as the initial structure. CLN025 was solvated in a 45.61 nm3 dodecahedral box with SPC water, GdmCl, and urea molecules to generate the desired solutions (Table 1). Cl- and Na+ ions were used to neutralize the charge of the system. The solvated structures were energy-minimized by the steepest descent method.37 An NVT simulation of the positionally restrained peptide was performed for 2 ns at the desired temperature. NPT simulations were performed at various temperatures and 1 bar pressure by coupling the system to an external heat bath using the method of Berendsen38 and the bonds were constrained39 using the Shake method.40 Long range electrostatic interactions and non-bonded interactions were treated by the twin-range method. 0.8 nm was used for the short range cutoff and 1.4 nm was used for the long range cutoff. A reaction-field correction was used for long range electrostatic interactions, and a dispersion correction was used for energy and pressure. 200.1 ns NPT simulations were used to analyze the equilibrium properties of CLN025 and 10.1 ns simulations were used to calculate thermodynamic properties. (Table 2). The first 0.1 ns of each simulation was considered an equilibration period and subsequently was not used for analysis.
Table 1.
Number of molecules in Molecular Dynamics simulations.
| Molecules | Solvent | ||||
|---|---|---|---|---|---|
| Water | 3 M GdmCl | 6 M GdmCl | 4 M Urea | 8 M Urea | |
| SPC water | 1438 | 1085 | 776 | 1148 | 727 |
| Gdm+ | - | 82 | 137 | - | - |
| Urea | - | - | - | 110 | 160 |
| Na+ | 3 | 3 | 3 | 3 | 3 |
| Cl- | 1 | 83 | 138 | 1 | 1 |
Table 2.
Duration of Molecular Dynamics simulations (ns).
| Solvent | Temperature / K | ||||||||
|---|---|---|---|---|---|---|---|---|---|
| 278 | 293 | 300 | 313 | 323 | 333 | 343 | 353 | 363 | |
| Water | 10.1 | 10.1 | 200.1 | 10.1 | 10.1 | 200.1 | 10.1 | 10.1 | 10.1 |
| 3 M GdmCl | 10.1 | 10.1 | 200.1 | 10.1 | 10.1 | 10.1 | 10.1 | 10.1 | 10.1 |
| 6 M GdmCl | 10.1 | 10.1 | 200.1 | 10.1 | 10.1 | 200.1 | 10.1 | 10.1 | 10.1 |
| 4 M urea | 10.1 | 10.1 | 200.1 | 10.1 | 10.1 | 10.1 | 10.1 | 10.1 | 10.1 |
| 8 M urea | 10.1 | 10.1 | 200.1 | 10.1 | 10.1 | 200.1 | 10.1 | 10.1 | 10.1 |
Trajectories were submitted to cluster analysis by the GROMOS method of clustering41 using backbone RMSD cutoff of 0.1 nm. Trajectories were sampled in 10 ps intervals. The structure of CLN025 was examined using the central structure of the largest cluster of structures from the trajectories of the simulations. Secondary structure of CLN025 was analyzed with plots of the φ and ψ torsional angles of the residues sampled every 10 ps along the trajectories and grouped into regions (αL, βL, γL, δL, εL, αD, β D, γ D, δ D, ε D).42 Hydrogen bond analysis was used to determine the number of hydrogen bonds in the structures of CLN025 sampled every 10 ps along the trajectory of the simulations. Hydrogen bonds were assigned using a radius cutoff of 0.35 nm and a cutoff angle of 30°.
The percentage of interacting structures was determined by the percentage of structures, sampled every 10 ps along the trajectories of the simulations, in which the distance between the center-of-mass of the aromatic side-chains or the Pro4 ring were below a cutoff distance of 0.75 nm, which was determined previously43 to indicate a probable weakly polar interaction between the residues.
For the 10 ns simulations at various temperatures, the heat capacities were determined using the equations of Boned and associates.44 in which the enthalpies were calculated by the equation:
where EV and EK, respectively, are the potential and kinetic energies of the system at constant pressure and temperature and〈 〉 indicate the ensemble average. The enthalpies were determined at 278, 293, 300, 313, 323, 333, 343, 353 and 363 K. The heat capacity was calculated by the equation:
and the heat capacity for each temperature was expressed as the average of the heat capacities of the adjacent intervals.
The calculation of the enthalpies and free energies associated with the change in the conformation of CLN025 in states A and A′ were performed by determining the population of structures of CLN025 in the 200 ns simulations in which the backbone RMSD was less than or greater than 0.1 nm, respectively, where state A represents the structures in the native or near native conformation (backbone RMSD ≤ 0.1 nm) and the complement of state A, A′, (backbone RMSD > 0.1 nm) in which CLN025 is in a slightly different β-hairpin conformation or unfolded. The free energy associated with the change in conformation of CLN025 from state A′ to state A was calculated using the equation:
where fA and fA′ are the fraction of structures in the 200 ns simulations in states A and A′, respectively. The enthalpy is given by the equation:
Results and Discussion
ECD Spectra
The ECD spectra of CLN025 are similar to previously published spectra16 except the minimum at 195 nm is less intense, due to using solvents with a greater optical density and a lower concentration of CLN025. In GdmCl, the ECD spectra (Figure 2A) have an aromatic couplet as the primary feature, as the concentration of GdmCl increases, the couplet decreases gradually and the maximum molar ellipticity shifts from 228 nm at 0 M GdmCl to 230 nm at 3 M GdmCl and then back to 228 nm at 6 M GdmCl. This shift indicates changes in the Ar-Ar interactions.30, 31 The overall decrease in mean residue ellipticity at 230 nm (Figure 2C) indicates that either the strength or number of Ar-Ar interactions decreases, or the GdmCl directly affects the intensity of the signal from the aromatic rings.
Figure 2.
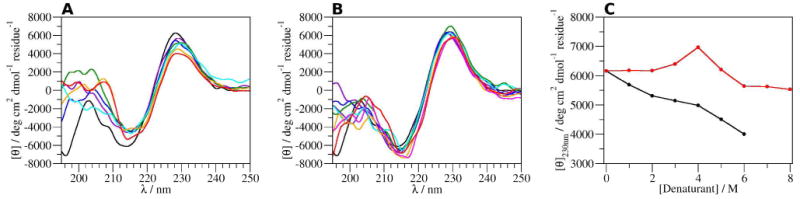
ECD spectra of CLN025 at 293 K in A, 0 (black), 1 (violet), 2 (blue), 3 (green), 4 (cyan), 5 (orange) and 6 M GdmCl (red); B, 0 (black), 1 (violet), 2 (maroon), 3 (blue), 4 (green), 5 (cyan), 6 (orange), 7 (magenta) and 8 M urea (red); and C, the mean residue ellipticity of CLN025 at 230 nm in various concentrations of GdmCl (black) and urea (red).
The ECD spectra of CLN025 in 0 to 2 M urea (Figure 2B) show an aromatic couplet with maximum intensity of 6300 deg cm-1 dmol-1 residue-1 at 228 nm. The couplet shifts to 229 nm in 3 to 5 M urea and the intensity of the aromatic couplet in 4 M Urea increases to 6800 deg cm-1 dmol-1 residue-1. In 6 to 8 M urea, the aromatic couplet shifts to 231 nm and the intensity decreases to 5600 deg cm-1 dmol-1 residue-1. These spectral changes indicate that the conformation of CLN025 is stable in 0 to 2 M urea, but in 3 to 5 M urea the geometry and pairing of the Ar-Ar interactions change. In 6 to 8 M urea, the Ar-Ar interactions appear to stabilize again though with a decrease of maximum intensity.
The ECD spectra of CLN025 in various concentrations of GdmCl and urea (Figure 3 A-E) show that the aromatic couplet shifts and broad or multiple peaks form as the temperature is increased. The ECD spectra of CLN025 in the various solvents and at different temperatures do not indicate an increase in random meander. It can not be concluded that the changes in the couplet results from unfolding or a conformational change. The mean residue ellipticities at 230 nm (Figure 3F) show that in urea solutions the molar ellipticity of the peptide is different from that in water at temperatures below 333 K. The molar ellipticities in GdmCl solutions, however, are lower than the values in water and show that GdmCl reduces the intensity of the aromatic couplet, but even in 6 M GdmCl at 353 K, the couplet is still present. At high concentrations and temperatures the decrease in the intensity of the couplet could be the result of either unfolding or a change in the geometry of the β-hairpin.31 The lack of isodichroic points in the spectra and the shifting in the position of the aromatic couplet indicate that a simple two-state model is not sufficient to describe the ECD spectra of CLN025. Due to the optical densities of the GdmCl and urea solutions, investigation of the 203/195 exciton couplet was not possible.
Figure 3.
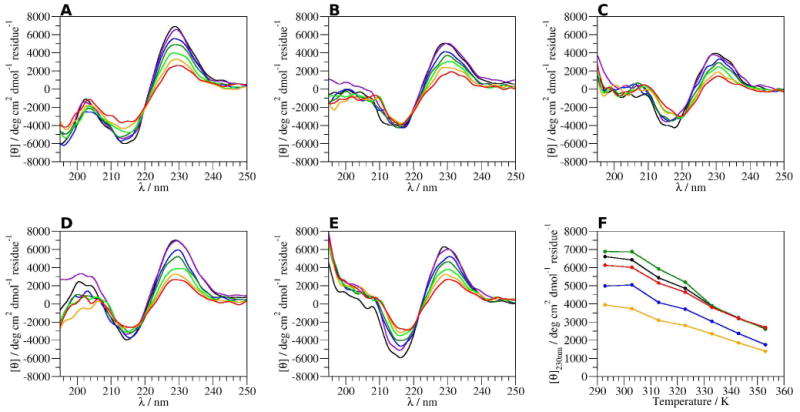
ECD spectra of CLN025 in A, buffer; B, 3 M GdmCl; C, 6 M GdmCl; D, 4 M urea and E, 8 M urea at 293 (black), 303 (violet), 313 (blue), 323 (green), 333 (light green), 343 (orange) and 353 K (red) and F, mean residue ellipticity of CLN025 at 230 nm at various temperatures in buffer (black), 3 M GdmCl (blue), 6 M GdmCl (orange), 4 M urea (green) and 8 M urea (red).
MD simulations
Thermodynamic parameter calculations
The trajectories of the 10 ns simulations were used to calculate the heat capacities (Cp) at different temperatures (Figure 4). In water, the heat capacity decreases as the temperature is increased, while in the urea solutions the dependence of Cp values on temperature is reduced. In 3 M GdmCl, the heat capacity is low, 102.8 kJ mol-1 K-1, at 300 K and has a maximum at 321 K of 122.4 kJ mol-1 K-1 and decreases to 113 kJ mol-1 K-1 above 330 K, seen to a lesser extent in 6 M GdmCl. This increase in heat capacity is not likely due to unfolding since it occurs 23 K below the reported melting temperature16.
Figure 4.
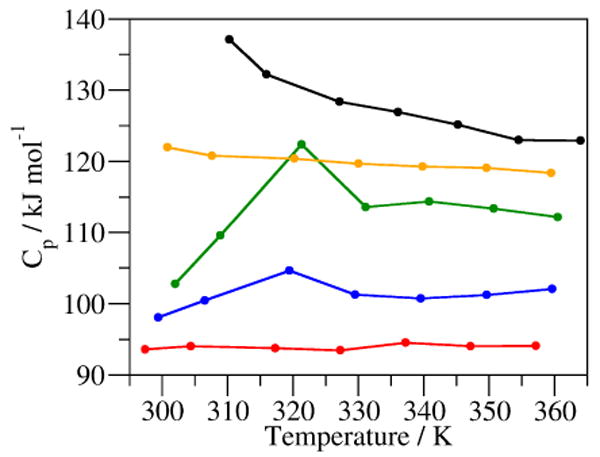
Heat capacity of the system at various temperatures of MD simulations of CLN025 in water (black), 3 M GdmCl (green), 6 M GdmCl (blue), 4 M urea (orange) and 8 M urea (red).
Using the 200 ns MD simulations of the peptide in SPC water, 6 M GdmCl and 8 M urea at 300 and 333 K, the populations of structures with a backbone RMSD of less than (A) and greater than (A′) 0.1 nm from the crystal structure, respectively, were determined and used to calculate the free energy of being in state A. In water at 300 K (Table 3), state A is favorable to state A′ with a free energy of -0.8 kJ mol-1 while, at 333 K, state A with a free energy of 5.6 kJ mol-1 is not favorable. In 6 M GdmCl, state A is favorable at 300 and 333 K with free energies of -1.3 and -3.9 kJ mol-1, respectively. State A is more favorable at 333 K than 300 K due to the greater fA. In 8 M urea, state A′ is not favorable at 300 and 333 K with free energies of 3.2 and 13.2 kJ mol-1, respectively. The enthalpy associated with the transition from state A′ to state A indicates that state A is favored in 6 M GdmCl, but not in water and 8 M urea. This indicates that the 6 M GdmCl solution favors the native state of the peptide, while water and 8 M urea tend to destabilize it.
Table 3.
Calculation of thermodynamic values from MD simulations.
| System | Temperature / K | fA | KAA′ | ΔGAA′ / kJ mol-1 | ΔHAA′316K / J mol-1 |
|---|---|---|---|---|---|
| SPC water | 300 | 0.58 | 1.4 | -0.8 | 0.6 |
| 333 | 0.11 | 0.13 | 5.6 | ||
| 6 M GdmCl | 300 | 0.63 | 1.7 | -1.3 | -0.2 |
| 333 | 0.81 | 4.1 | -3.9 | ||
| 8 M urea | 300 | 0.22 | 0.28 | 3.2 | 0.9 |
| 333 | 0.008 | 0.008 | 13.2 |
Equilibrium simulations
Cluster analysis
The small number of clusters and more than 90% of structures belonging to the major cluster indicates that in water and in 6 M GdmCl at 300 K the structure of the peptide is stable (Table 4). In 3 M GdmCl at 300 K, the peptide structure is destabilized resulting in 241 clusters of which the major cluster consisted of only 28% of the structures. In urea at 300 K, the number of clusters increases and the proportion of structures in the major cluster decreases as the concentration of urea is increased. This indicates that the peptide structure is destabilized in 3 M GdmCl, but is stable in both water and 6 M GdmCl, while the structural stability of the peptide decreases in urea. This is in contrast with the ECD results which show a gradual decrease in the mean residue ellipticity in GdmCl solutions and a smaller and less gradual decrease in urea. But the aromatic couplet of the ECD spectra reflects the local Ar-Ar interactions, while the cluster analysis reflects the secondary structure of the backbone. At 333 K, the number of clusters in water increases to 76 and the proportion of structures in the most populated cluster decreases to 72%. This indicates that the structure of the peptide is destabilized in water at higher temperatures. In 6 M GdmCl, the number of clusters, 27, at 333 K is low and the number in the most populated cluster is decreased by only 3%, which indicates that the structure of the peptide is stable at both 300 and 333 K. In urea, however, the number of clusters increases substantially to 1702 with only 16% in the most populated cluster. This indicates that the structure of CLN025 is destabilized in 8 M urea at 333 K.
Table 4.
Cluster analysis of trajectories of CLN025.
| Solvent | Temperature | Number of clusters | % of structures in most populated cluster |
|---|---|---|---|
| Water | 300 K | 15 | 94 |
| 333 K | 76 | 72 | |
| 3 M GdmCl | 300 K | 241 | 28 |
| 6 M GdmCl | 300 K | 8 | 93 |
| 333 K | 27 | 90 | |
| 4 M Urea | 300 K | 394 | 52 |
| 8 M Urea | 300 K | 214 | 33 |
| 333 K | 1702 | 16 |
The central structures of the major clusters from the simulations (Figure 5) show that the peptide maintains a β-hairpin conformation in GdmCl and urea indicating that the denaturants were unable to unfold the peptide effectively and most secondary structure was maintained. H-bonding and side-chain orientations, however, vary in the different solvents. In 3 M GdmCl, the H-bond between Asp3 and Gly7 is lost, a new H-bond is formed between Pro4 and Gly7 and the aromatic ring of Tyr2 shifts towards the Pro4 ring and away from the Trp9 aromatic ring. The central structures of the peptide in 6 M GdmCl at 300 and 333 K are similar. In 4 M urea at 300 K and in water and 8 M urea at 333 K, the H-bonding pattern shifts causing the C-terminal strand to push Tyr10 out into the solvent by breaking the electrostatic interaction between the N- and C-termini and forming a hydrogen bond between Tyr1 and Trp9. This results in moving Gly7 out of the turn region. This shift causes a loss of hydrogen bonds involving Pro4 and Glu5 and a shift in Ar-Ar interaction from Tyr2-Trp9 to Tyr1-Trp9. In 8 M urea, the electrostatic interaction between the charged termini is restored and a cation-π interaction forms between the aromatic ring of Trp9 and the N-terminus of the peptide and the Ar-Ar interaction between Tyr2 and Trp9 or Tyr1 and Trp9 shifts to between Tyr1 and Tyr10.
Figure 5.

The backbone and side-chains of A, the crystal structure; and the central structures of the most populated cluster of trajectories of MD simulations of CLN025 in B, water at 300 K; C, water at 333 K; D, 3 M GdmCl at 300 K; E, 6 M GdmCl at 300 K; F, 6 M GdmCl at 333 K; G, 4 M urea at 300 K; H, 8 M urea at 300 K; and I, 8 M urea at 333 K. The backbone structure represented by a tube. Turn is green, β-sheet is red and random meander is cyan.
RMSD
The distribution of the RMSD of the peptide backbone (Figure 6) indicates that in water and 6 M GdmCl the backbone is similar to that of the crystal structure of the peptide. The majority of the RMSD values are less than 0.05 nm in the 300 K simulations, while in the 333 K simulations, a second peak occurs at 0.15 nm in water and 0.12 nm in 6 M GdmCl. These RMSD values are smaller than the 0.18 nm RMSD between the crystal and NMR structures. In 3 M GdmCl, the distribution of RMSD values around 0.3 nm is widened and fewer have RMSD values less than 0.05 nm. This indicates that a conformational change in the peptide backbone occurs in 3 M GdmCl. In 4 M urea, two groupings of RMSD values are present. The RMSD values around 0.15 nm probably represent the structures in which the C-terminus is pushed out into the solvent and the turn is shortened. The RMSD values around 0.25 nm, in 8 M urea at 300 K, indicate further changes in the conformation of the backbone. At 333 K, the distribution of RMSD values is broader and indicates that the peptide is either unfolded or destabilized by the 8 M urea.
Figure 6.
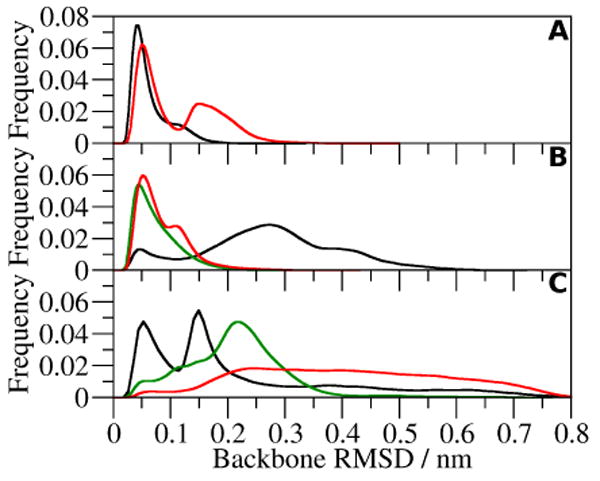
Backbone RMSD of CLN025 in A, water at 300 K (black) and 333 K (red); B, 3 M GdmCl at 300 K (black), 6 M GdmCl at 300 K (green) and 333 K (red); and C, 4 M urea at 300 K (black) and 8 M urea at 300 K (green) and 333 K (red).
Backbone torsional angles
The φ and ψ torsional angles (Figure 7) in increasing concentrations of GdmCl are reduced in the εD region and increased in the αD region. This indicates a change from a type II′ β-turn to a type II β-turn, which is a major structural reorientation. In urea, the broader distribution of the φ and ψ torsional angles indicates that the conformation of the peptide backbone is relaxed and in more of a random meander conformation. The small shifts in the distributions of the φ, ψ plots of the individual residues at 300 K in the different denaturing solutions indicate that the conformation of the backbone at Tyr2, Asp3, Pro4, Glu5, Thr8 and Trp9 remains stable. Tyr2, Asp3, Thr8 and Trp9 are in a β-sheet and Pro4 and Glu5 are in a type I β-turn conformation. At 333 K, however, additional combinations of the φ and ψ torsional angles are seen for Pro4, Glu5, Thr8 and Trp9 in water and 8 M urea, as well as for Tyr2 in 8 M urea. The φ, ψ torsional angles for 6 M GdmCl are the same at both 300 and 333 K.
Figure 7.

φ, ψ torsional angles of CLN025 and the individual residues along the trajectories of the MD simulations.
For Thr6, the population of structures in the εL region indicates that the type I β-turn shifts to a type II β-turn, while the majority of the structures maintain a type I β-turn. In 3 M GdmCl, the Gly7 φ, ψ angles move from εD to εL and the population in the αD region is maintained. This indicates that Gly7 is either in a type II β-turn or random meander conformation. In 6 M GdmCl at 300 and 333 K, the population of structures in the αD region increases and those in the εD region moves to the γL region, suggesting that Gly7 is either in a type II β-turn or random meander conformation. The φ and ψ angles of Gly7 in 4 M urea at 300 K and in water at 333 K are in the γL, αD and εD regions which indicate a mixture of structures in a type II β-turn, type II′ β-turn and random meander conformation. In 8 M urea solutions, the torsional angles in the γL, εL, αD, εD regions indicate that Gly7 is in a mixture of β-turn and random meander conformation. The φ, ψ analysis indicates that the peptide does not unfold, but rather, the turn region is reorganized and only a small change in the sheet region is needed to accommodate changes in the turn.
Hydrogen bonds
The average number of intramolecular H-bonds in the peptide is greater in 6 M GdmCl and less in 3 M GdmCl than in water (Table 5). H-bonds in water are primarily between Tyr1 and Trp9, Tyr1 and Tyr10, Asp3 and Glu5, Asp3 and Thr6, Asp3 and Gly7 and Asp3 and Thr8. In the sheet region, the Tyr1-Trp9 H-bond is lost in GdmCl solutions. The number of Tyr1-Tyr10 H-bonds is reduced in 3 M GdmCl, but increased in 6 M GdmCl. In the turn region, the number of Asp3-Gly7 H-bonds is reduced in 3 and 6 M GdmCl and the number of Asp3-Thr8 H-bonds is reduced in 3 M GdmCl, but increased in 6 M GdmCl. The total number of intramolecular H-bonds is reduced in urea. The number of Asp3-Thr6 H-bonds is reduced in urea. In 4 M urea, the number of Asp3-Gly7 H-bonds is increased and the number of Asp3-Thr8 H-bonds is reduced.
Table 5.
Average number of intramolecular H-bonds in different solvents.
| H-bonding residues | Water | 3 M GdmCl | 6 M GdmCl | 4 M Urea | 8 M Urea | |||
|---|---|---|---|---|---|---|---|---|
| 300 K | 333 K | 300 K | 300 K | 333 K | 300 K | 300 K | 333 K | |
| Tyr1-Trp9 | 0.45 | 0.64 | 0.04 | 0.00 | 0.00 | 0.780 | 0.10 | 0.24 |
| Tyr1-Tyr10 | 0.87 | 0.34 | 0.44 | 1.42 | 1.30 | 0.30 | 0.60 | 0.02 |
| Asp3-Glu5 | 0.30 | 0.39 | 0.32 | 0.13 | 0.22 | 0.44 | 0.64 | 0.36 |
| Asp3-Thr6 | 1.83 | 1.44 | 1.73 | 1.90 | 1.73 | 1.53 | 1.39 | 0.56 |
| Asp3-Gly7 | 0.91 | 0.93 | 0.58 | 0.44 | 0.45 | 1.04 | 0.67 | 0.44 |
| Asp3-Thr8 | 0.78 | 0.34 | 0.55 | 1.54 | 1.38 | 0.30 | 0.53 | 0.02 |
| Pro4-Gly7 | 0.10 | 0.04 | 0.12 | 0.29 | 0.22 | 0.04 | 0.05 | 0.01 |
| Thr6-Thr8 | 0.50 | 0.20 | 0.32 | 0.88 | 0.81 | 0.23 | 0.35 | 0.05 |
| Thr6-Trp9 | 0.24 | 0.34 | 0.01 | 0.00 | 0.00 | 0.38 | 0.07 | 0.14 |
| Thr8-Tyr10 | 0.10 | 0.05 | 0.10 | 0.17 | 0.17 | 0.05 | 0.05 | 0.04 |
| Total | 6.4 | 4.7 | 5.0 | 7.5 | 6.3 | 5.4 | 5.2 | 1.9 |
As the temperature is increased from 300 K to 333 K in water, the number of Tyr1-Tyr10, Asp3-Thr6, Asp3-Thr8 and Thr6-Thr8 H-bonds decrease, while the number of Tyr1-Trp9, Asp3-Glu5 and Thr6-Trp9 H-bonds increase, resulting in a net decrease of 1.7 H-bonds. In 6 M GdmCl, the temperature increase causes a loss of 1.2 H-bonds. The number of Tyr1-Tyr10, Asp3-Thr6 and Asp3-Thr8 H-bonds decrease and the number of Asp3-Glu5 H-bonds increase. In 8 M urea, the temperature increase causes a decrease from 5.2 H-bonds at 300 K to 1.9 H-bonds at 333 K, with the biggest decrease coming from almost complete loss of Tyr1-Tyr10 and Asp3-Thr8 H-bonds and a reduction in the average number of H-bonds between Asp3 and Glu5, Thr6 and Gly7, which indicates that the turn structure is destabilized at 333 K.
Weakly polar interactions
The importance of the weakly polar interactions is shown (Table 6) by the number of structures in which the aromatic rings are within 0.75 nm of either another aromatic ring or prolyl side-chain. The Tyr1-Tyr10 Ar-Ar interaction is present in 88% of the structures in water and 79% in 6 M GdmCl, but is reduced in 3 M GdmCl and urea. The Tyr1-Trp9 interaction is not present in water or GdmCl, but it does occur in 37% of the structures in 4 M urea and 11% in 8 M urea. The Tyr2-Tyr10 Ar-Ar interaction is present only in 3 M GdmCl and 8 M urea where it is in 30% and 12% of the structures, respectively. The Tyr2-Trp9 Ar-Ar interaction is present in 95% of the structures in water and is reduced to 38% of the structures in 3 M GdmCl and 67% of the structures in 6 M GdmCl. In urea, the number of structures containing an Ar-Ar interaction between Tyr2 and Trp9 are reduced to 21% in 4 M urea and 51% in 8 M urea. The CH-π interaction is present in more than 90% of the structures in water and 6 M GdmCl, but only 62% of the structures in 3 M GdmCl. In urea, the number of structures containing Tyr2-Pro4 CH-π interactions decreases to 86% in 4 M urea and 50% in 8 M urea.
Table 6.
Structures with weakly polar interactions indicated by an interaction distance of 0.75 nm (%).
| Interacting residues | Water | 3 M GdmCl | 6 M GdmCl | 4 M Urea | 8 M Urea | |||
|---|---|---|---|---|---|---|---|---|
| 300 K | 333 K | 300 K | 300 K | 333 K | 300 K | 300 K | 333 K | |
| Tyr1-Tyr10 | 88 | 22 | 27 | 79 | 74 | 17 | 50 | 4 |
| Ty1-Trp9 | 1 | 32 | 3 | 4 | 3 | 37 | 11 | 17 |
| Tyr2-Tyr10 | 0 | 12 | 30 | 0 | 1 | 2 | 12 | 8 |
| Tyr2-Trp9 | 95 | 24 | 38 | 67 | 64 | 21 | 51 | 7 |
| Tyr2-Pro4 | 97 | 88 | 62 | 92 | 94 | 86 | 50 | 66 |
In water, the increase in temperature results in a reduction in the number of Tyr1-Tyr10 and Tyr2-Trp9 Ar-Ar interactions and to a lesser extent the Tyr2-Pro4 CH-π interaction, while the number of Tyr1-Trp9 and Tyr2-Tyr10 Ar-Ar interactions increase, due to the elongation of the C-terminal strand. In 6 M GdmCl, the number of Ar-Ar and CH-π interactions are similar at 300 and 333 K, indicating that the peptide is less affected by temperature changes, possibly because the Gdm+ prevents the aromatic rings to move significantly. In 8 M urea, however, the number of Tyr1-Tyr10 and Tyr2-Trp9 Ar-Ar interactions is decreased, while the numbers of the Tyr1-Trp9 and Tyr2-Tyr10 Ar-Ar interactions change less. In addition, when the number of Ar-Ar interactions involving Tyr2 decrease, the number of Tyr2-Pro4 CH-π interactions can increase.
Solvent accessible surface area
The average solvent accessible surface area (SAS; Table S1) varies slightly in the different environments. In water, the SAS increases by 6% at 333 K. In 6 M GdmCl, the SAS is similar to that in water, while in 3 M GdmCl the SAS increases by 11%. In urea, the SAS increases by 9 to 11% at 300 K and by 20% at 333 K. These small changes indicate that CLN025 forms a compact structure in water and GdmCl and to a lesser extent in urea.
Peptide-solvent interactions
In GdmCl solutions, the number of peptide-solvent H-bonds decrease, indicating that the peptide is less exposed to the solvent and does not unfold (Supplemental Table S2). In 3 M GdmCl, a small amount of solvent is in the core, indicating that the peptide is destabilized, but not in water or 6 M GdmCl (Supplemental Figure S2). In GdmCl, Tyr1, Gly7 and Trp9 are more solvated by water, while Pro4, Glu5 and Tyr10 are less solvated by water. The Tyr2 aromatic ring is the least solvated by water because its Ar-Ar and CH-π interactions prevent both faces from being exposed to the solvent.
Asp3 and Glu5 are the most solvated by Gdm+, while Pro4 and Thr8 are the least solvated (Supplemental Figure S3). Trp9 and Tyr10 are more solvated by Gdm+ in 3 M GdmCl than in 6 M GdmCl due to a loss of Ar-Ar interactions involving Trp9, which increases the exposure of the ring to Gdm+. The aromatic rings are highly solvated by Gdm+, especially those of Trp9 and Tyr10. Tyr2, the least solvated aromatic ring, is within 0.5 nm of a Gdm+ ion more than 76% of the time, while the indolyl ring of Trp9 is within 0.5 nm of a Gdm+ ion more than 96% of the time (Supplemental Table S3). Increasing the temperature of the simulation increases the percentage of structures with an aromatic ring within 0.5 nm of a Gdm+ ion, which suggests that the increased stability of the peptide at higher temperatures in 6 M GdmCl may be due, in part, to an increased presence of Gdm+ around the aromatic rings which helps to minimize their movement at higher temperatures. In water, the water oxygen is pointed away from the peptide, but in GdmCl solutions the water oxygen is oriented preferentially towards the peptide, so it can H-bond with the Gdm+ ions surrounding the peptide (Supplemental Figure S4). The Gdm+ ions are preferentially oriented parallel to the peptide, except around the negatively charged residues, where two nitrogen atoms are pointed towards the peptide to maximize H-bonding (Supplemental Figure S5).
In urea, the number of peptide-solvent H-bonds increases, but not enough to indicate unfolding (Supplemental Table S2). Asp3-Thr6 in the turn region and Tyr10 are less solvated by water in urea solutions, while Trp9 is more solvated, due to increased exposure of the aromatic ring as a result of the loss of Ar-Ar interactions involving Trp9 in urea (Supplemental Figure S6). The aromatic residues are preferentially solvated by the urea oxygen, while the turn is solvated by the urea nitrogen, due to the presence of multiple side-chains containing oxygen atoms (Supplemental Figure S7). The water oxygen is pointed towards the Thr6 and Trp9 side-chains to a greater extent in urea than water, due to a conformational change (Supplemental Figure S8). Urea predominately forms H-bonds with Asp3, Glu5, Thr8, Tyr10 and to a lesser extent with Tyr1 (Supplemental Figure S9).
CLN025 is a stable polypeptide model of secondary structure, but not a miniprotein
We have shown that CLN025 forms a stable β-hairpin conformation that is difficult to disrupt by increasing temperature in different solvents such as TFE, MeOH and DMSO previously30, 31 and by GdmCl and urea here. 8 M urea at 333 K was required to break the β-hairpin conformation. MD studies have shown that chignolin is also resistant to unfolding, even at 373 K.45 Proteins with compact denatured state ensembles contain a greater secondary structure content46, 47 that reduces the number of interactions between protein and denaturant.48 CLN025 is a stable β-hairpin polypeptide that is composed entirely of secondary structure with no tertiary structure. Therefore, it is not affected by denaturant and does not unfold as would a protein with tertiary structure.
The apparent two-state folding of CLN025 was described on the basis of the molar ellipticity of the aromatic couplet.16 This is a measure of the local structure near the aromatic rings, rather than secondary structure. We have shown here and previously30 that, when more than two aromatic rings interact, the molar ellipticity of the aromatic couplet does not accurately estimate the population of folded and unfolded conformers. This is because the fluctuations in Ar-Ar interactions affect both the intensity and position of the aromatic couplets, without significantly affecting the backbone structure of the peptide. Maynard and colleagues49 have shown that 3JαN values from NMR measurements can also provide misleading estimates of the population of folded conformers in peptides that are rich in β-branched residues, due to the effect of local cooperative interactions that affect backbone conformational preferences rather than folding or unfolding.49 This caution must be used with the molar ellipticity of the aromatic couplet in ECD spectra, especially when either more than two aromatic rings are present or the position of the aromatic couplet shifts. Other methods which should be used to estimate the population of folded and unfolded conformers when the accuracy of a specific method is in doubt include the comparison of NOE intensities to random meander or other reference values28, 29, 49, 50 and changes in the absorbance of the amide I′ region of FT-IR spectra.27, 51
The observed two-state folding of CLN02516 may be due to a small conformational change rather than unfolding. The heat capacity was assumed to be zero, but the heat capacity of the protein should increase near the melting temperature52 as for small β-hairpins,49,53 α-helices54 and the TC5b miniprotein.55 The MD simulations here, do not show an increase in heat capacity near the proposed melting temperature, indicating that unfolding does not occur, although more precise methods such as differential scanning calorimetry may be required. Our MD simulations show that, at temperatures near or above the observed melting temperature the β-hairpin is still present in the majority of structures.
Rodriguez and colleagues56 examined the 3D structure of CLN025 using replica exchange MD simulations. The peptide in explicit solvent had a funnel-like free energy landscape with two minima which were separated by 0.5 kcal mol-1 corresponding to two clusters of structures. Cluster 1 contained the experimental NMR and X-ray structures. In cluster 2, the peptide had a conformation in which the H-bonds and Ar-Ar interactions are shifted so that the turn was shortened and the side chain of Tyr10 was pushed into the solvent. This conformation is seen as the major conformation in our simulations of CLN025 in water at elevated temperatures and in 4M urea as well as in our previous simulations in MeOH and TFE.31 This further supports our conclusion that the observed changes in the ECD spectra are due to a conformational change rather than unfolding.
Honda and colleagues16 proposed a definition to define an ideal protein as a polypeptide with a single smooth funnel-like free energy surface that perfectly satisfies either the consistency principle or the minimum frustration principle and has a defined 3D structure that corresponds with the bottom of the funnel and flexibility that corresponds with transitions among structures near the bottom. CLN025 has a well-defined 3D structure and is stable in a variety of temperatures and solvents, because small changes in the weakly polar interactions and the H-bond pattern can compensate for the effects of a changing environment. CLN025, however, does not satisfy the consistency or minimum frustration principle because it lacks a well-defined tertiary structure and there is competition between Ar-Ar interactions and H-bonds.
MD simulations of CLN025 starting from an extended state have been used to generate a free energy surface in dihedral angle (DA) space that displays a funnel shape with a deep well and surrounding shallows,16 which is typical of proteins.57 The funnel resulted from replica exchange simulation, however, has two minima rather than a single minimum.56 While CLN025 folds from an extended conformation to a small number of closely related β-hairpin conformations, a thermally stable peptide with a well-defined secondary structure would display the same characteristics. The consistency principle58 states that, in ideal proteins, no localized stress exists. This concept is difficult to demonstrate in a real protein. In CLN025, however, the shifting of Ar-Ar interactions and the shifting of the turn region at elevated temperatures suggest that stress may be present in the turn region or at the end of the β-hairpin. Therefore, CLN025 does not satisfy the consistency principle. The minimum frustration principle59 states that the folded structure is compact and the secondary and tertiary structures do not conflict. In the case of CLN025, and two-stranded β-hairpins in general, no tertiary structure is present, so the minimum frustration principle cannot be applied. This suggests that the tertiary structure is an essential property of proteins. Numerous studies have shown that polypeptides including TC5b,55, 60-63, avian pancreatic polyeptide17,22,64 and the core of the Villin Headpiece helical subdomain65-68 should be regarded as miniproteins, because they have a well-defined tertiary structure and hydrophobic core, they exhibit two-state folding and their heat capacity increases upon unfolding.
Definitions of proteins and miniproteins typically distinguish flexible polypeptides from proteins, but additional criteria are required to distinguish stable polypeptides from proteins. CLN025 and two-stranded β-hairpins, in general, have a well-defined 3D structure, but lack a well-defined tertiary structure, so they should not be regarded as miniproteins. They should, however, be seen as stable models for secondary structure. This does not detract from using these models in understanding protein structure or folding.
Conclusions
CLN025 has previously been shown to form a β-hairpin conformation that is stable at high temperatures and in non-aqueous solvents such as MeOH, TFE and DMSO.30,31 Here, the effect of various concentrations of urea and GdmCl on the conformation of CLN025 was examined by ECD and MD simulations. It was shown, that even high concentrations of these denaturants are unable to disrupt the β-hairpin conformation effectively. Rather, the denaturants affect the local preferences for weakly polar interactions and hydrogen bonds resulting in small conformational changes.
Supplementary Material
Acknowledgments
This work was supported by the NIH-INBRE grant P20 RR016469.
Footnotes
Supporting Information Available. DSSP analysis, solvent accessible surface area of CLN025, radial distribution functions and orientation of the solvent to the peptide and radial distribution functions between solvent molecules. This information is available free of charge via the Internet at http://pubs.acs.org.
References
- 1.Das A, Mukhopadhyay C. J Phys Chem B. 2009;113:12816–12824. doi: 10.1021/jp906350s. [DOI] [PubMed] [Google Scholar]
- 2.Stumpe MC, Grubmuller H. J Am Chem Soc. 2007;129:16126–16131. doi: 10.1021/ja076216j. [DOI] [PubMed] [Google Scholar]
- 3.Stumpe MC, Grubmuller H. J Phys Chem B. 2007;111:6220–6228. doi: 10.1021/jp066474n. [DOI] [PubMed] [Google Scholar]
- 4.Scholtz JM, Barrick D, York EJ, Stewart JM, Baldwin RL. Proc Natl Acad Sci USA. 1995;92:185–189. doi: 10.1073/pnas.92.1.185. [DOI] [PMC free article] [PubMed] [Google Scholar]
- 5.Lim WK, Rosgen J, Englander SW. Proc Natl Acad Sci USA. 2009;106:2595–2600. doi: 10.1073/pnas.0812588106. [DOI] [PMC free article] [PubMed] [Google Scholar]
- 6.Auton M, Holthauzen LMF, Bolen DW. Proc Natl Acad Sci USA. 2007;104:15317–15322. doi: 10.1073/pnas.0706251104. [DOI] [PMC free article] [PubMed] [Google Scholar]
- 7.Stumpe MC, Grubmuller H. PloS Comp Biol. 2008;4:e1000221. doi: 10.1371/journal.pcbi.1000221. [DOI] [PMC free article] [PubMed] [Google Scholar]
- 8.Stumpe MC, Grubmuller H. Biophys Journal. 2009;96:3744–3752. doi: 10.1016/j.bpj.2009.01.051. [DOI] [PMC free article] [PubMed] [Google Scholar]
- 9.Dempsey CE, Piggot TJ, Mason PE. Biochemistry. 2005;44:775–781. doi: 10.1021/bi048389g. [DOI] [PubMed] [Google Scholar]
- 10.Mason PE, Dempsey CE, Neilson GW, Kline SR, Brady JW. J Am Chem Soc. 2009;131:16689–16696. doi: 10.1021/ja903478s. [DOI] [PMC free article] [PubMed] [Google Scholar]
- 11.Mason PE, Brady JW, Neilson GW, Dempsey CE. Biophys Journal. 2007;93:L04–L06. doi: 10.1529/biophysj.107.108290. [DOI] [PMC free article] [PubMed] [Google Scholar]
- 12.Camilloni C, Rocco AG, Eberini I, Gianazza E, Broglia RA, Tiana G. Biophys Journal. 2008;94:4654–4661. doi: 10.1529/biophysj.107.125799. [DOI] [PMC free article] [PubMed] [Google Scholar]
- 13.Lee M, van der Vegt NFA. J Am Chem Soc. 2006;128:4948–4949. doi: 10.1021/ja058600r. [DOI] [PubMed] [Google Scholar]
- 14.Chang J. Biochemistry. 2009;48:9340–9346. doi: 10.1021/bi901417f. [DOI] [PubMed] [Google Scholar]
- 15.Whittington SJ, Chellgren BW, Hermann VM, Creamer TP. Biochemistry. 2005;44:6269–6275. doi: 10.1021/bi050124u. [DOI] [PubMed] [Google Scholar]
- 16.Honda S, Akiba T, Kato YS, Sawada Y, Sekijima M, Ishimura M, Ooishi A, Watanabe H, Odahara T, Harata K. J Am Chem Soc. 2008;130:15327–15331. doi: 10.1021/ja8030533. [DOI] [PubMed] [Google Scholar]
- 17.Palermo NY, Csontos J, Owen MC, Murphy RF, Lovas S. J Comp Chem. 2007;28:1208–1214. doi: 10.1002/jcc.20578. [DOI] [PubMed] [Google Scholar]
- 18.Borics A, Murphy RF, Lovas S. Protein Pept Lett. 2007;14:353–359. doi: 10.2174/092986607780363907. [DOI] [PubMed] [Google Scholar]
- 19.Csontos J, Palermo NY, Murphy RF, Lovas S. J Comp Chem. 2008;29:1344–1352. doi: 10.1002/jcc.20898. [DOI] [PubMed] [Google Scholar]
- 20.Hatfield MPD, Palermo NY, Csontos J, Murphy RF, Lovas S. J Phys Chem B. 2008;112:3503–3508. doi: 10.1021/jp077674h. [DOI] [PubMed] [Google Scholar]
- 21.Csontos J, Murphy RF, Lovas S. Biopolymers. 2008;89:1002–1011. doi: 10.1002/bip.21049. [DOI] [PMC free article] [PubMed] [Google Scholar]
- 22.Palermo NY, Csontos J, Murphy RF, Lovas S. Int J Quantum Chem. 2008;108:814–819. doi: 10.1002/qua.21521. [DOI] [PMC free article] [PubMed] [Google Scholar]
- 23.Csontos J, Murphy RF, Lovas S. Adv Exp Med Biol. 2009;611:79–80. doi: 10.1007/978-0-387-73657-0_35. [DOI] [PubMed] [Google Scholar]
- 24.Palermo NY, Csontos J, Murphy RF, Lovas S. Adv Exp Med Biol. 2009;611:89–90. doi: 10.1007/978-0-387-73657-0_40. [DOI] [PubMed] [Google Scholar]
- 25.Cochran AG, Skelton NJ, Starovasnik MA. Proc Natl Acad Sci USA. 2001;98:5578–5583. doi: 10.1073/pnas.091100898. [DOI] [PMC free article] [PubMed] [Google Scholar]
- 26.Xu Y, Oyola R, Gai F. J Am Chem Soc. 2003;125:15388–15394. doi: 10.1021/ja037053b. [DOI] [PubMed] [Google Scholar]
- 27.Takekiyo T, Wu L, Yoshimura Y, Shimizu A, Keiderling TA. Biochemistry. 2009;48:1543–1552. doi: 10.1021/bi8019838. [DOI] [PubMed] [Google Scholar]
- 28.Eidenschink LA, Kier BL, Huggins KNL, Andersen NH. Proteins. 2009;75:308–322. doi: 10.1002/prot.22240. [DOI] [PMC free article] [PubMed] [Google Scholar]
- 29.Andersen NA, Olsen KA, Fesinmeyer RM, Tan X, Hudson FM, Eidenschink LA, Farazi SR. J Am Chem Soc. 2006;128:6101–6110. doi: 10.1021/ja054971w. [DOI] [PMC free article] [PubMed] [Google Scholar]
- 30.Hatfield MPD, Murphy RF, Lovas S. Biopolymers. 2010;93:442–450. doi: 10.1002/bip.21356. [DOI] [PMC free article] [PubMed] [Google Scholar]
- 31.Hatfield MPD, Murphy RF, Lovas S. J Phys Chem B. 2010;114:3028–3037. doi: 10.1021/jp910465e. [DOI] [PMC free article] [PubMed] [Google Scholar]
- 32.Szendrei GI, Fabian H, Mantsch HH, Lovas S, Nyeki O, Schon I, Otvos L., Jr Eur J Biochem. 1994;226:917–924. doi: 10.1111/j.1432-1033.1994.t01-1-00917.x. [DOI] [PubMed] [Google Scholar]
- 33.Lindahl E, Hess B, Van der Spoel D. J Mol Mod. 2001;7:306–317. [Google Scholar]
- 34.Berendsen HJC, Van der Spoel D, Van Drunen R. Comp Phys Comm. 1995;91:43–56. [Google Scholar]
- 35.Oostenbrink C, Villa A, Mark AE, Gunsteren WFV. J Comp Chem. 2004;25:1656–1676. doi: 10.1002/jcc.20090. [DOI] [PubMed] [Google Scholar]
- 36.Oostenbrink C, Soares TA, van der Vegt NF, van Gunsteren WF. Eur Biophys J. 2005;34:273–284. doi: 10.1007/s00249-004-0448-6. [DOI] [PubMed] [Google Scholar]
- 37.Hess B, Bekker H, Berendsen HJC, Fraaije JGEM. J Comp Chem. 1997;18:1463–1472. [Google Scholar]
- 38.Berendsen HJC, Postma JPM, DiNola A, Haak JR. J Chem Phys. 1984;81:3684–3690. [Google Scholar]
- 39.Ryckaert JP, Ciccotti G, Berendsen HJC. J Comp Phys. 1977;23:327–341. [Google Scholar]
- 40.Miyamoto S, Kollman PA. J Comp Chem. 1992;13:952–962. [Google Scholar]
- 41.Daura X, Gademann K, Juan B, Seebach D, van Gunsteren WF, Mark AE. Agnew Chem Int Ed. 1999;38:236–240. [Google Scholar]
- 42.Chass GA, Sahai MA, Law JMS, Lovas S, Farkas O, Perczel A, Rivail J, Csizmadia IG. Int J Quantum Chem. 2002;90:933–968. [Google Scholar]
- 43.Samanta U, Pal D, Chakrabarti P. Acta Crystallogr. 1999;D55:1421–1427. doi: 10.1107/s090744499900726x. [DOI] [PubMed] [Google Scholar]
- 44.Boned R, van Gunsteren WF, Daura X. Chem Eur J. 2008;14:5039–5046. doi: 10.1002/chem.200701380. [DOI] [PubMed] [Google Scholar]
- 45.Suenaga A, Narumi T, Futatsugi N, Yanai R, Ohno Y, Okimoto N, Taiji M. Chem Asian J. 2007;2:591–598. doi: 10.1002/asia.200600385. [DOI] [PubMed] [Google Scholar]
- 46.Holthauzen LM, Rosgen J, Bolen DW. Biochemistry. 2010;49:1310–1318. doi: 10.1021/bi9015499. [DOI] [PMC free article] [PubMed] [Google Scholar]
- 47.Ubersky VN, Fink AL. FEBS Lett. 2002;515:79–83. doi: 10.1016/s0014-5793(02)02441-9. [DOI] [PubMed] [Google Scholar]
- 48.Pace CN, Huyghues-Despointes BMP, Fu H, Takano K, Scholtz JM, Grimsley GR. Protein Science. 2010 doi: 10.1002/pro.370. [DOI] [PMC free article] [PubMed] [Google Scholar]
- 49.Maynard AJ, Sharman GJ, Searle MS. J Am Chem Soc. 1998;120:1996–2007. [Google Scholar]
- 50.Riemen AJ, Waters ML. Biochemistry. 2009;48:1525–1531. doi: 10.1021/bi801706k. [DOI] [PMC free article] [PubMed] [Google Scholar]
- 51.Wu L, McElheny D, Huang R, Keiderling TA. Biochemistry. 2009;48:10362–10371. doi: 10.1021/bi901249d. [DOI] [PubMed] [Google Scholar]
- 52.Cooper A. Biophysical Chemistry. 2000;85:25–39. doi: 10.1016/s0301-4622(00)00136-8. [DOI] [PubMed] [Google Scholar]
- 53.Streicher WW, Makhatadze GI. J Am Chem Soc. 2006;128:30–31. doi: 10.1021/ja056392x. [DOI] [PubMed] [Google Scholar]
- 54.Taylor JW, Greenfield NJ, Wu B, Privalov PL. J Mol Biol. 1999;291:965–976. doi: 10.1006/jmbi.1999.3025. [DOI] [PubMed] [Google Scholar]
- 55.Streicher WW, Makhatadze GI. Biochemistry. 2007;46:2876–2880. doi: 10.1021/bi602424x. [DOI] [PubMed] [Google Scholar]
- 56.Rodriguez A, Mokoema P, Corcho F, Bisetty K, Perez JJ. J Phys Chem B. 2011 doi: 10.1021/jp106475c. in press. [DOI] [PubMed] [Google Scholar]
- 57.Onuchic JN, Wolynes PG, Luthey-Schulten Z, Socci ND. Proc Natl Acad Sci USA. 1995;92:3626–3630. doi: 10.1073/pnas.92.8.3626. [DOI] [PMC free article] [PubMed] [Google Scholar]
- 58.Go N. Ann Rev Biophys Bioeng. 1983;12:183–210. doi: 10.1146/annurev.bb.12.060183.001151. [DOI] [PubMed] [Google Scholar]
- 59.Bryngelson JD, Wolynes PG. Proc Natl Acad Sci USA. 1987;84:7524–7528. doi: 10.1073/pnas.84.21.7524. [DOI] [PMC free article] [PubMed] [Google Scholar]
- 60.Neidigh JW, Fesinmeyer RW, Andersen NH. Nature Structural Biology. 2002;9:425–430. doi: 10.1038/nsb798. [DOI] [PubMed] [Google Scholar]
- 61.Canchi DR, Paschek D, Garcia AE. J Am Chem Soc. 2010;132:2338–2344. doi: 10.1021/ja909348c. [DOI] [PubMed] [Google Scholar]
- 62.Gattin Z, Riniker S, Hore PJ, Mok KH, van Gunsteren WF. Protein Science. 2009;18:2090–2099. doi: 10.1002/pro.223. [DOI] [PMC free article] [PubMed] [Google Scholar]
- 63.Copps J, Murphy RF, Lovas S. Peptide Science. 2007;88:427–437. doi: 10.1002/bip.20709. [DOI] [PubMed] [Google Scholar]
- 64.Zhang H, Wong CF, Thacher T, Rabitz H. Proteins. 1995;23:218. doi: 10.1002/prot.340230211. [DOI] [PubMed] [Google Scholar]
- 65.Xiao S, Bi Y, Shan B, Raleigh DP. Biochemistry. 2009;48:4607–4616. doi: 10.1021/bi8021763. [DOI] [PubMed] [Google Scholar]
- 66.Woll MG, Hadley EB, Mecozzi S, Gellman SH. J Am Chem Soc. 2006;128:15932–15933. doi: 10.1021/ja0634573. [DOI] [PubMed] [Google Scholar]
- 67.Tang Y, Rigotti DJ, Fairman R, Raleigh DP. Biochemistry. 2004;43:3264–3272. doi: 10.1021/bi035652p. [DOI] [PubMed] [Google Scholar]
- 68.Frank BS, Vardar D, Buckley DA, McKnight CJ. Protein Science. 2002;11:680–687. doi: 10.1110/ps.22202. [DOI] [PMC free article] [PubMed] [Google Scholar]
Associated Data
This section collects any data citations, data availability statements, or supplementary materials included in this article.