

New multidetector cardiac computed tomography (MDCT) can image the heart within the span of a few beats, and as such, it is the favored noninvasive approach to assess coronary anatomy rapidly. However, MDCT has proven to be more useful for excluding coronary disease than for making positive diagnoses. The inability to detect unstable cardiac disease arises from the confounding attenuating effects of calcium deposits within atherosclerotic plaques, which obscure lumen anatomy, and from the insensitivity of CT X-rays to image low attenuating intraluminal thrombus adhered to a disrupted plaque cap, the absolute condition of ruptured plaque and unstable disease.[1–6] It is now well understood that the sensitive detection and quantification of small intravascular thrombus in coronary arteries with molecular imaging techniques could provide a direct metric to diagnose and risk stratify patients presenting with chest pain.[7,8]
Here we describe molecular imaging with thrombus-targeted NanoK, which was developed to complement the newest advancement in CT imaging technology, that is, spectral (multicolored) CT. Spectral CT enhances traditional CT images, which are based on the photoelectric and Compton effects, with the capability to image and quantify certain elements based on distinctive K-edge energies (spectral CT concept cartoon: Supporting Information Figure S1).[9–11] Elements such as bismuth, gold, and gadolinium, which have K-edge values within the X-ray energy bandwidth of CT and are not found in humans naturally, are excellent candidates for spectral CT molecular imaging agents. Iodine, a commonly used CT contrast element,[12,13] will be effective in small-animal spectral CT imaging but is unlikely to be useful for clinical applications due to photon starvation at the low energy side of the iodine K-edge (33 keV) and the related beam hardening effects and X-ray scattering incurred with patients.
The new K-edge imaging feature recognizes high accumulations of targeted elements and presents them as colorized voxels against the normal grayscale X-ray background (Figure S1). Up to four channels of K-edge molecular imaging contrast may be discerned simultaneous in current prototype instrumentation, providing a flexible multispectral palette for X-ray delineation of soft-tissue biochemical detail.
Spectral CT molecular imaging is anticipated to overcome the relatively low inherent contrast within soft tissue and distinguish the high attenuation of calcium from contrast-enhanced targets. However, effective molecular imaging nanoparticles designed for CT must incorporate very high concentration of elements, literally 500000 metal atoms per nanoparticle (e.g., bismuth atoms) for a 200 nm-sized agent. Useable elements found within the X-ray energy bandwidth are typically heavy metals with potential toxicities in their free form, therefore whole-body bioelimination is a prerequisite consideration in the design of spectral CT nanoparticles. While metal crystals, for example, gold (Au),[14] bismuth (Bi),[15] and titanium (Ti)[16] have been considered as blood pool and nontargeted agents, the particle size of the metal component were uniformly greater than the normal renal filtration threshold (i.e., 6 nm), posing potential bioelimination issues and related regulatory approval challenges.[17]
NanoK achieves the requisite high metal content using low-molecular-weight organometallic K-edge compounds encapsulated within natural amphiphiles (Figure 1). NanoK’s outer membrane is easily functionalized for a variety of intravascular targets, but the ligand-direct homing to fibrin of microthrombus in coronary ruptured plaque is perhaps the most compelling initial application. The specificity of fibrin-directed NanoK homing is facilitated by particle-size constraint to the vasculature (ca. 200 nm), which precludes interaction with off-target intramural fibrin from healed atherosclerotic plaque rupture or intramural hemorrhage.[18] The NanoK particle incorporates bismuth n-decanoate (1) at 50% element v/v within a sorbitan sesquioleate core matrix that is encapsulated by phospholipids. Bismuth n-decanoates were found to be highly compatible with polysorbates, which allowed NanoK to be synthesized with tunable payloads (40% to 70% v/v within the particle) of bismuth (in a 20% aqueous suspension). The sorbitan sesquioleate is a mixture of ca. 70% oleic acid (C18:1), balanced primarily with palmitic acid (C16:0), stearic acid (C18:0) and linoleic acid (C18:2). The combined density of the sorbitan (d =0.989 gmL−1) and bismuth n-decanoate (d = 1.145 gmL−1) reached approximately 1.06 gmL−1 preserving a fluidic nature to the core of these particles. Phospholipid-encapsulated NanoK has a hydrodynamic diameter between 180 and 250 nm with a negative electrophoretic potential ranging from −20 to −27 mV. Control nanocolloid (ConNC) was prepared as above without the inclusion of bismuth n-decanoate. In brief, the synthesis process entails the covalent complexation of bismuth chloride to n-decanoic acid, the product of which is suspended in sorbitan sesquioleate, and then microfluidized as a 20% (v/v) colloidal suspension with 2% (v/v) phospholipid surfactant in nanopure water (Figure 1). The surfactant mixture was comprised of phosphatidylcholine (lecithin-egg PC), (98.9 mol%), dipalmitoyl phosphatidylethanolamine caproyl biotin (±1.0 mol% w/v, PE-biotin) for in vitro avidin–biotin coupling of homing ligands and 1,2-dioleoyl-sn-glycero-3-phosphoethanolamine-N-(lissamine rhodamine B sulfonyl) ammonium salt (±0.1 mol% w/v, PE-rhodamine) for corroborative immunofluorescent microscopic imaging (Avanti Polar Lipids), and 2-dipalmitoyl-sn-glycero-3-phosphoethanolamine-N-[4-(p-maleimidophenyl)butyramide (±0.6 mol%) for covalent coupling of monoclonal antibody. NanoK was purified by exhaustive dialysis through 10 kDa MWCO membrane against water (Figure 1). Fluorescence spectroscopy (excitation λmax = 550; emission λmax = 593) of the rhodamine-NanoK confirmed the fluorophore labeling.
Figure 1.

Synthesis and physicochemical characterization of NanoK: a) Preparation of bismuth-enriched K-edge nanocolloid (NanoK (Bi)): 1) Suspension of bismuth n-decanoate (1) in sorbitan sesquioleate, vigorously vortex and mixing, filter using cotton bed, vortex; 2) preparation of phospholipid thin film; 3) resuspension of the thin film in water (0.2 μM); 4) microfluidization at 4°C, 20000 psi, 4 min, dialysis (cellulosic membrane, MWCO 20 K). b) Characterization table for three replicates of NanoK. c) Hydrodynamic particle size distribution from DLS. d) Anhydrous state TEM images (staining: uranyl acetate; scale bar: 100 nm. e) AFM image (deposited on glass substrate).
Dynamic light-scattering (DLS) measurements revealed that the nominal hydrodynamic diameters (Dh) of the NanoK and control samples in aqueous solution were 210 ±9 nm and 153 ±11 nm, respectively. NanoK Dh increased slightly for particles formulated with extreme bismuth content (70% v/v) (Figure S2a). Zeta potential values (ζ) of the nanocolloids were −27 ±1 mV and −23 ±9 mV, respectively (Brookhaven Instrument Co.). Bismuth content, determined by ICP OES, was 200 μgmL−1 of the 20% colloid suspension. Particles in suspension were drop-deposited over nickel grids and negatively stained with uranyl acetate and observed to be spherical in their anhydrous state by transmission electron microscopy (Figure 1d). The particle height obtained from dried-state atomic force microscopy (AFM) images was 101 ± 24 nm.
Initial spectral CT imaging experiments were performed with NanoK particles in suspension (20% v/v). Figure 2a shows the cross-sectional CT (conventional) images of the centrifuge tubes filled with serially diluted NanoK particles in grayscale. One reference tube (as marked) contained 500 mM calcium acetate suspension in water. In Figure 2b, the K-edge contrast from bismuth (green) is readily segregated from calcium (blue). Undiluted NanoK provided 1050HU at 60 keV, whereas the calcium contributed 1060HU. The attenuation of the NanoK formulation varied linearly as a function of elemental concentration (R2 =0.999) (Figure 2c). Next, a blood vessel phantom was created by suspending acellular fibrin-rich clots in phosphate-buffered saline (PBS, pH 7.4) contained in sealed polystyrene test tubes (75 mm) (Figure 2e). Integrated within the clots was a small deposit of calcium acetate to simulate arterial wall calcifications, a common feature of plaque complicating traditional CT coronary imaging applications. Biotinylated NanoK or the control nanocolloid (i.e., containing no bismuth, ConNC) were bound to the in vitro fibrin clots using classic avidin–biotin interaction technique and a well-characterized fibrin-specific monoclonal antibody (NIB5F3) similar to previous reports.[18–21] Spectral CT images of targeted fibrin clot samples in cross-section (Figure 2d) and derived 3D maximum intensity projection reconstructions (Figure 2f) revealed excellent delineation and signal enhancement from the bismuth-enhanced fibrin clot surface (bottom far left), whereas the control clot (top far left) treated with targeted nonmetallic nanoparticles had negligible contrast, showing only the highly attenuating calcium. The nominal size of NanoK precluded deep penetration through the tight weave of fibrin fibrils (Supporting Information, Movie 1), which is consistent with prior examples in this phantom model.[19–22] The NanoK layer bound on the surface of the clots was 1 to 2 voxels (100 μm × 100 μm × 100 μm) thick with an average density of 3.5 mass% of bismuth for a layer thickness of 100 μm. The total bismuth mass per slice was graphed as a function of position and calculated to be 91 μg, 136 μg and 107 μg, respectively (av. 111 μg), for the three independent syntheses of NanoK; the control had 0 μg bismuth detected (Figure S4).
Figure 2.
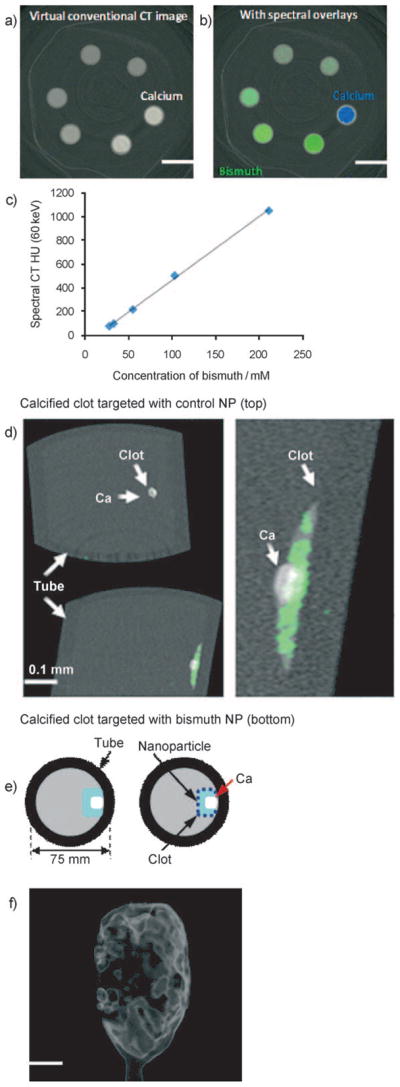
Virtual conventional CT (a) and spectral CT (b) cross-sectional slices of serially diluted NanoK (green) and calcium (blue) phantoms. c) Variation of spectral CT signal (HU) with bismuth concentration; slope y =5.3353x−67.44; R2 =0.999. d) Cross-sectional slices of fibrin clot targeted with NanoK presenting calcium (scale: 0.1 mm). e) Pictorial representation of the vessel phantom. f) Gradient rendered image of fibrin clot targeted with NanoK (scale: 10 mm).
To assess feasibility of detecting fibrin at physiological concentration presented by unstable human atherosclerotic vascular tissue, carotid artery endarterectomy (CEA) specimens with microscopic fibrin deposits were exposed in vitro to fibrin-specific NanoK. Classical images (combination of photo effect, Compton and bismuth) of CEA tissue exposed to fibrin-targeted NanoK or ConNC revealed heavy calcification of both specimens, with no differentiation of the NanoK particles from the calcium based solely on X-ray attenuation.
The carotid soft tissue had negligible X-ray contrast (i.e., attenuation) and was visually lost from both images. K-edge imaging detected and distinguished the bound fibrin-targeted NanoK (color: gold) at 90.5 keV from the complicating calcium signal (color: red). The 90.5 keV K-edge image of the CEA exposed to ConNC targeted to fibrin revealed no signal from thrombus-bound particles nor the intramural plaque calcium deposits (Figure 3). A dynamic illustration of the spectral CT result is provided as Movie 2 in the Supporting Information.
Figure 3.
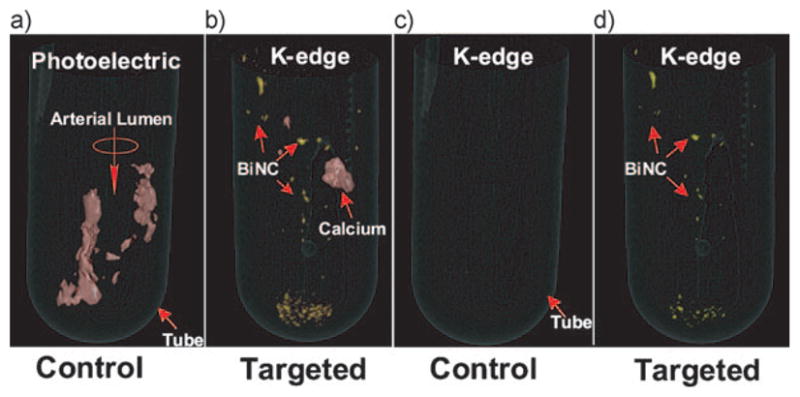
a,b) Lowest energy bin images with bismuth overlay and c,d) bismuth basis spectral CT images of human carotid specimen incubated with control nanocolloids and NanoK respectively. Note the complete absence of Bi in the control sample (a) and (c). Scale: diameter of the tube: 16 mm. Fibrin-targeted NanoK signal at the bottom of the tube represents thrombus dislodged from CEA during processing.
The specific targeting of NanoK to fibrin imaged with spectral CT on human carotid endarterectomy specimens (Figure 3) was corroborated microscopically with immunohistochemistry (Figure S5). Frozen sections of CEA specimens exposed to rhodamine-labeled NanoK with (Figure S5a) and without fibrin-antibody (Figure S5c) demonstrated specific ligand-mediated binding of NanoK to minute fibrin deposits layered along the luminal aspect of the tissue. Corresponding immunohistochemistry (Figure S 5b,d) on adjacent frozen sections confirmed the surface presence of fibrin but also revealed deposits within the carotid plaque that were not enhanced by the lumen constrained fibrin-targeted NanoK particles. This illustrates how fibrin-targeted NanoK can enhance intraluminal microthrombus from plaque rupture but is precluded from interacting with fibrin within nonacute intraplaque hemorrhages or previous healed fibrous cap ruptures. Intravascular constraint of NanoK reduces the potential for false positive contrast signal derived stable, nonacute fibrin depositions to confound and inappropriately influence medical decisions for further cardiac intervention or alternative plaque stabilization therapy.
Dynamic imaging of NanoK with MDCT revealed that the initial blood pool CT contrast signal (i.e., Hounsfield units of blood in circulation) was appreciated immediately after intravenous injection but was non-detectable within 30 min, (Figure 4a), illustrating that residual blood pool contrast signal will not confound the molecular imaging of intra-lumenal thrombus at the 1 to 2 h (i.e., times post injection for optimal detection based on similar sized MRI nanoparticles). The concentration of bismuth in blood versus time post injection was analyzed and corroborated by inductively coupled plasma mass spectrometry (ICP-MS) (Figure 4a, inset). The minimum detectable concentration of the agent in rabbit was found to be 5.94 μM of bismuth.
Figure 4.
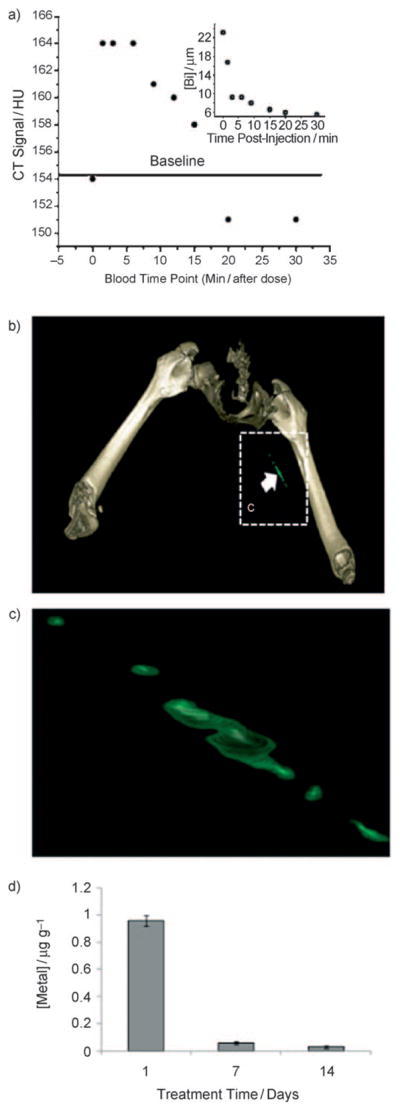
a) CT blood pool signal in rabbits following intravenous injection of NanoK. CT scan imaging parameters were thickness 0.8, increment 0.8, kV 90, mAs 1500, resolution HIGH, collimation 4 × 0.75, pitch 0.35, rotation time 1.5 s, FOV 75 mm. Inset: concentration of bismuth (ICP) in blood versus time post injection. Note that the background signal is at baseline in less than 30 min. b,c) Targeting in situ clot (thrombus) in rabbits; scale: maximum clot diameter =1.41 mm, minimum diameter =1.25 mm; see Figures S6 and S7. d) Two weeks clearance profile of bismuth from mice.
The development of NanoK technology is concurrent with the development of spectral CT itself. As such, the spectral CT prototype scanner used is an emergent technology undergoing marked changes in detector development and calibration as well as image reconstruction of the underlying mathematical models used to parse the Compton and photoelectric contributions from the K-edge data. To determine if sensitivity of this prototype scanner was capable of detecting and properly localizing NanoK in vivo when bound at the fibrin density of a natural thrombus, a balloon overstretch injury-induced thrombus was formed within the iliac artery of an atherosclerotic rabbit. Anti-fibrin mAb[19,23] coupled directly to NanoK particles was incubated in situ with the thrombus between temporary snares over 30 min. Unbound and weakly bound NanoK was washed from the thrombus with reestablishment of arterial circulation for 90 min.
After 30 min, the animal was euthanized and transferred to the spectral CT for imaging, which was required to accommodate the 10 min per slice acquisition time of this prototype scanner. Figure 4b,c shows the reconstructed intra-arterial thrombus enhanced with fibrin-bound NanoK detectable in vivo in rabbit with spectral CT. The partial-occlusive thrombus was formed within a 1.41 mm diameter artery-equivalent to a small coronary artery in humans. NanoK bound to the fibrin component of the thrombus and spectral CT clearly differentiated the pathology within the vessel from the attenuation effects of bone. Superimposition of the simultaneously acquired K-edge image with the traditional CT image spatially oriented and localized the intravascular lesion relative to the rabbit’s skeletal anatomy and demonstrated the combination of the prototype instrument/software and NanoK, warranting future studies to optimize and confirm fibrin-targeted NanoK homing.
As mentioned, heavy metals used for spectral CT molecular imaging must be cleared from the body in a reasonably short time period. The prospects for whole-body bioelimination of NanoK bismuth following intravenous injection was studied in adult male BALB/c mice using ICP-MS. In this two-week pilot study, nearly all of the metal was cleared from the mice (Figure 4d), and most in the first week. These data illustrate the concept that the high metal payload of NanoK may be bioeliminated within a reasonable time-frame. NanoK residual biodistribution on day 14 into primary clearance organs, (i.e., liver, spleen, kidney) was assessed using inductively coupled plasma optical emission spectrometry (ICP-OES) in a second cohort of mice (n =3). At that time, analysis of liver, spleen, and kidney in total revealed less than 10 ppbmL−1 (i.e., below the statistically valid lower detection limit of the instrument and method). Detailed experiments will be needed to fully delineate the routes, dose, and time-dependencies of NanoK biodistribution and elimination, which were beyond the scope of this initial project.
In a third cohort of mice, the in vivo impact of bismuth-loaded NanoK particles or saline (1 mgmL−1 IV, n =3/group/timepoint) on liver (ALT, AST, Albumin) and renal (BUN, CR, Na, K, Cl) function was assessed on days 1, 7 and 14 post injection. Liver and renal function tests in both groups remained within established normal limits for each parameter. Moreover, there were no statistical differences between groups at any timepoint (Table S1). These data further support the rapid clearance of bismuth, discussed above, as well as the stability of the bismuth n-decanoate metal complex.
Fibrin-targeted NanoK offers a unique nanomedicine approach to detection and characterization of intravascular pathologic epitopes with spectral CT. The detection and quantification of ruptured plaque in coronary arteries, one of the major aims in cardiology, can now be envisioned given the rapid acquisition and high X-ray energy resolution expected from spectral CT. Here, we have shown that NanoK achieved the spectral CT contrast required for clinical imaging by incorporating high bismuth loadings in each nanoparticle using organically soluble bismuth compounds. Moreover, the feasibility for bioelimination within 14 days was observed. Spectral CT is quantitative, revealing not only the image of NanoK enhanced pathology but also providing data on the amount of bismuth per voxel (i.e., the number of nanoparticles bound in a given locality), which may become fundamentally important for patient risk stratification and interventional treatment decisions.
Experimental Section
Preparation of NanoK
In a typical experimental procedure, bismuth n-decanoate (2.47 g) was suspended in sorbitan sesquioleate (5.37 g), and vigorously vortexed to homogeneity. The surfactant co-mixture included high purity egg yolk phosphatidylcholine (90 mol%, 376.0 mg), cholesterol (8 mol%, 17.1 mg), biotinylated dipalmitoyl phosphatidylethanolamine (2 mol%, 9.9 mg). The surfactant co-mixture was dissolved in chloroform, evaporated under reduced pressure, dried in a 50°C vacuum oven overnight, and dispersed into water by probe sonication. This suspension was combined with the bismuth polysorbate mixture (20% v/v), distilled, de-ionized water (77.3% w/v) and glycerin (1.7%, w/v). The mixture was continuously processed thereafter at 20000 psi for 4 min with an S110 Microfluidics emulsifier. The nanocolloids were dialyzed against water using a 10 kDa MWCO cellulose membrane for prolonged period of time and then passed through a 0.45 μm Acrodisc Syringe filter. The nanocolloids were stored under argon atmosphere typically at 4°C in order to prevent any bacterial growth.
Supplementary Material
Footnotes
This research was supported by grants from the AHA (D.P.)/(0835426N), NCI (U54A119342), BRP (HL073646), and the NHLBI (R01L073646, R01L078631). Supporting Information Figure S1 and the table of contents graphics were produced and extensively modified using Servier Medical Art.
Supporting information for this article is available on the WWW under http://dx.doi.org/10.1002/anie.201005657.
Contributor Information
Prof. Dipanjan Pan, C-TRAIN and Division of Cardiology, Washington University School of Medicine, 4320 Forest Park Avenue, Saint Louis, MO 63108 (USA).
Dr. Ewald Roessl, Philips Research Europe, Hamburg (Germany)
Dr. Jens-Peter Schlomka, Philips Research Europe, Hamburg (Germany)
Prof. Shelton D. Caruthers, C-TRAIN and Division of Cardiology, Washington University School of Medicine, 4320 Forest Park Avenue, Saint Louis, MO 63108 (USA)
Dr. Angana Senpan, C-TRAIN and Division of Cardiology, Washington University School of Medicine, 4320 Forest Park Avenue, Saint Louis, MO 63108 (USA)
Mike J. Scott, C-TRAIN and Division of Cardiology, Washington University School of Medicine, 4320 Forest Park Avenue, Saint Louis, MO 63108 (USA)
John S. Allen, C-TRAIN and Division of Cardiology, Washington University School of Medicine, 4320 Forest Park Avenue, Saint Louis, MO 63108 (USA)
Huiying Zhang, C-TRAIN and Division of Cardiology, Washington University School of Medicine, 4320 Forest Park Avenue, Saint Louis, MO 63108 (USA).
Grace Hu, C-TRAIN and Division of Cardiology, Washington University School of Medicine, 4320 Forest Park Avenue, Saint Louis, MO 63108 (USA).
Prof. Patrick J. Gaffney, Department of Surgery, St Thomas’s Hospital, London (UK)
Prof. Eric T. Choi, Department of Surgery, Washington University Medical School, St. Louis, MO (USA)
Prof. Volker Rasche, Department of Internal Medicine, University of Ulm (Germany)
Prof. Samuel A. Wickline, C-TRAIN and Division of Cardiology, Washington University School of Medicine, 4320 Forest Park Avenue, Saint Louis, MO 63108 (USA)
Roland Proksa, Philips Research Europe, Hamburg (Germany).
Prof. Gregory M. Lanza, C-TRAIN and Division of Cardiology, Washington University School of Medicine, 4320 Forest Park Avenue, Saint Louis, MO 63108 (USA).
References
- 1.Kelly JL, Thickman D, Abramson SD, Chen PR, Smazal SF, Fleishman MJ, Lingam SC. AJR Am J Roentgenol. 2008;191:50–55. doi: 10.2214/AJR.07.2954. [DOI] [PubMed] [Google Scholar]
- 2.Tong LL. Hemodial Int. 2008;12:16–22. doi: 10.1111/j.1542-4758.2008.00234.x. [DOI] [PubMed] [Google Scholar]
- 3.Taylor AJ. Circulation. 2000;101:1243–1248. doi: 10.1161/01.cir.101.11.1243. [DOI] [PubMed] [Google Scholar]
- 4.Pham PH. Invest Radiol. 2006;41:674–680. doi: 10.1097/01.rli.0000233325.42572.08. [DOI] [PubMed] [Google Scholar]
- 5.Barreto M. J Cardiovasc Comput Tomogr. 2008;2:234–242. doi: 10.1016/j.jcct.2008.05.146. [DOI] [PubMed] [Google Scholar]
- 6.Horiguchi J, Fujioka C, Kiguchi M, Shen Y, Althoff CE, Yamamoto H, Ito K. Am J Roentgenol. 2007;189:981–988. doi: 10.2214/AJR.07.2296. [DOI] [PubMed] [Google Scholar]
- 7.Benson R. Arch Pathol Lab Med. 1926;2:876–916. [Google Scholar]
- 8.Constantinides P. J Atheroscler Res. 1966;6:1–17. [Google Scholar]
- 9.a) Proksa R, Grass M. 2006117720. WO. 2006; b) Proksa R. 2007034359. WO. 2007; c) Zeitler G, Herrmann C, Engel KJ, Bäumer C, Roessl E, Proksa R. 2007057841. WO. 2007
- 10.Schlomka JP, Roessl E, Dorscheid R, Dill S, Martens G, Istel T, Bäumer C, Herrmann C, Steadman R, Zeitler G, Livne A, Proksa R. Phys Med Biol. 2008;53:4031–4047. doi: 10.1088/0031-9155/53/15/002. [DOI] [PubMed] [Google Scholar]
- 11.Roessl E, Proksa R. Phys Med Biol. 2007;52:4679–4696. doi: 10.1088/0031-9155/52/15/020. [DOI] [PubMed] [Google Scholar]
- 12.Hyafil F, Cornily J, Feig JE, Gordon R, Vucic E, Amirbekian V, Fisher EA, Fuster V, Feldman LJ, Fayad ZA. Nat Med. 2007;13:636–641. doi: 10.1038/nm1571. [DOI] [PubMed] [Google Scholar]
- 13.Winter P, Shukla HP, Caruthers SD, Scott MJ, Fuhrhop RW, Robertson JD, Gaffney PJ, Wickline SA, Lanza GM. Acad Radiol. 2005;12:S9–S13. doi: 10.1016/j.acra.2005.02.016. [DOI] [PubMed] [Google Scholar]
- 14.a) Hainfeld JF, Slatkin DN, Focella TM, Smilowitz HM. Br J Radiol. 2006;79:248–253. doi: 10.1259/bjr/13169882. [DOI] [PubMed] [Google Scholar]; b) Hainfeld F, Slatkin DN, Smilowitz HM. Phys Med Biol. 2004;49:N309–N315. doi: 10.1088/0031-9155/49/18/n03. [DOI] [PubMed] [Google Scholar]
- 15.Rabin O, Manuel PJ, Grimm J, Wojtkiewicz G, Weissleder R. Nat Mater. 2006;5:118–122. doi: 10.1038/nmat1571. [DOI] [PubMed] [Google Scholar]
- 16.Ashcroft JM, Gu W, Zhang T, Hughes SM, Hartman KB, Hofmann C, Kanaras AG, Kilcoyne DA, Le Gros M, Yin Y, Alivisatos AP, Larabell CA. Chem Commun. 2008:2471–2473. doi: 10.1039/b801392f. [DOI] [PMC free article] [PubMed] [Google Scholar]
- 17.Choi HS, Liu W, Liu F, Nasr K, Misra P, Bawendi MG, Frangioni JV. Nat Nanotechnol. 2010;5:42–47. doi: 10.1038/nnano.2009.314. [DOI] [PMC free article] [PubMed] [Google Scholar]
- 18.Weissleder R, Bogdanov A, Jr, Tung CH, Weinmann HJ. Bioconj Chem. 2001;12:213–219. doi: 10.1021/bc000091p. [DOI] [PubMed] [Google Scholar]
- 19.Lanza GM, Wallace KD, Scott MJ, Cacheris WP, Abendschein DR, Christy DH, Sharkey AM, Miller JG, Gaffney PJ, Wickline SA. Circulation. 1996;94:3334–3340. doi: 10.1161/01.cir.94.12.3334. [DOI] [PubMed] [Google Scholar]
- 20.Flacke S, Fischer S, Scott MJ, Fuhrhop RJ, Allen JS, McLean M, Winter P, Sicard GA, Gaffney PJ, Wickline SA, Lanza GM. Circulation. 2001;104:1280–1285. doi: 10.1161/hc3601.094303. [DOI] [PubMed] [Google Scholar]
- 21.Lanza GM, Lorenz CH, Fischer SE, Scott MJ, Cacheris WP, Kaufmann RJ, Gaffney PJ, Wickline SA. Acad Radiol. 1998;5:S173–S176. doi: 10.1016/s1076-6332(98)80097-4. [DOI] [PubMed] [Google Scholar]
- 22.Botnar RM, Buecker A, Wiethoff AJ, Parsons EC, Katoh M, Katsimaglis G, Weisskoff RM, Lauffer RB, Graham PB, Gunther RW, Manning WJ, Spuentrup E. Circulation. 2004;110:1463–1466. doi: 10.1161/01.CIR.0000134960.31304.87. [DOI] [PubMed] [Google Scholar]
- 23.a) Lanza GM, Wallace KD, Fischer SE, Christy DH, Scott MJ, Miller JG, Gaffney PJ, Wickline SA. J Acoust Soc Am. 1997;10:391. [Google Scholar]; b) Yu X, Song SK, Chen J, Scott MJ, Fuhrhop RJ, Hall CS, Gaffney PJ, Wickline SA, Lanza GM. Magn Reson Med. 2000;44:867–872. doi: 10.1002/1522-2594(200012)44:6<867::aid-mrm7>3.0.co;2-p. [DOI] [PubMed] [Google Scholar]
Associated Data
This section collects any data citations, data availability statements, or supplementary materials included in this article.