Abstract
Background
Electrocardiographic Imaging (ECGI) is a method for noninvasive epicardial EP mapping. ECGI was used previously to characterize the electrophysiological substrate and electrical synchrony in a very heterogeneous group of patients with varying degrees of coronary disease and ischemic cardiomyopathy.
Objective
The objective of this study is to characterize the LV electrophysiological substrate and electrical dyssynchrony using ECGI, in a homogeneous group of non-ischemic cardiomyopathy patients who were previously implanted with CRT device.
Methods
ECGI was performed in different rhythms in 25 patients by programming their devices to biventricular pacing, single chamber (LV or RV) pacing, and native rhythm. Electrical dyssynchrony index (ED) was computed as the standard deviation of activation times at 500 sites on LV epicardium.
Results
In all patients, native rhythm activation was characterized by lines of conduction block in a region with steep activation – recovery interval (ARI) gradients between the epicardial aspect of septum and LV lateral wall. A native QRS duration (QRSd)> 130 ms was associated with high ED (≥30 ms) while QRSd <130 ms was associated with minimal (25 ms) to large (40 ms) ED. CRT responders had very high dyssynchrony (ED=35.5±3.9 ms) in native rhythm which was significantly lowered (ED=23.2±4.4 ms) during CRT. All four non-responders in the study did not show significant difference in ED between native and CRT rhythms.
Conclusions
The electrophysiological substrate in non-ischemic cardiomyopathy is consistent among all patients, with steep ARI gradients co-localizing with conduction block lines between the epicardial aspect of the septum and the LV lateral wall. A QRSd wider than 130 ms is indicative of substantial LV electrical dyssynchrony, while among patients with QRSd<130 ms LV dyssynchrony may vary widely.
Keywords: Cardiac resynchronization therapy, heart failure, imaging, electrocardiography
INTRODUCTION
Cardiac resynchronization therapy (CRT) using biventricular pacing is a relatively new treatment modality designed to restore synchrony with the objective to improve cardiac mechanical performance in congestive heart failure1–4. CRT has been demonstrated to be clinically effective in 60–70% of patients and its indication as therapy has increased exponentially over the last several years. A number of different echocardiographic measures have been used clinically to select potential CRT candidates. The recently concluded PROSPECT2 trial has shown that none of the echocardiographic measures provides a consistent basis for clinical decisions regarding CRT implants. The ECG QRS duration (QRSd) is deemed to be the most clinically relevant measure for CRT. While CRT has been shown to benefit the majority of symptomatic patients with wide QRSd > 130 ms, there have been conflicting reports on the usefulness of CRT in moderate ranges of QRSd (100 – 130 ms). The RethinQ trial3 showed that CRT is not beneficial for patients with narrow QRSd. However, another recent study4 has demonstrated potential short term improvement with CRT in patients with QRSd< 120 ms. This indicates that there may be heart failure patients with QRSd in the range of 100–130 ms, who may respond well to CRT but the measures of dyssynchrony used in RethinQ could not identify this group. With the reliability of echocardiographic measures in question (PROSPECT trial), the quest for an alternative measure of dyssynchrony in the context of CRT continues.
Electrocardiographic Imaging (ECGI)5–8 is a novel imaging modality for cardiac electrophysiology, based on 250 body surface electrocardiograms and an accurate, patient specific heart-torso anatomy derived from an ECG-gated CT scan. It noninvasively generates electroanatomic maps of epicardial potentials (voltage-maps), electrograms, activation and repolarization sequences. A previous study8 using ECGI in 8 heart failure patients with ischemic cardiomyopathy undergoing CRT, showed that the electrophysiologic (EP) substrate is extremely heterogeneous among these patients and that the efficacy of CRT depends strongly on the patient-specific substrate and pacing electrode placement relative to this substrate. This was a study in a very heterogeneous group of patients with varying degrees of coronary disease and ischemic cardiomyopathy. The objective of the current study is to characterize the LV EP substrate and electrical dyssynchrony in a population of non-ischemic cardiomyopathy patients, previously implanted with a CRT device. A quantitative index for LV electrical dyssynchrony is defined and computed, and its relationship with QRSd is studied.
METHODS
ECGI was performed in each patient in each of the following rhythms: i) biventricular CRT pacing (CRT); ii) LV pacing (LV-P); iii) RV pacing (RV-P); iv) non-paced native rhythm (NAT), if applicable. Two patients had optimized inter-ventricular (V-V) delays different from the nominal value, and ECGI was performed with both optimal (CRT-OPT) and nominal (CRT-NOM) V-V delays. The nominal V-V delay is the standard ‘factory’ setting (simultaneous biventricular pacing).
Custom algorithms5,6,developed in our laboratory, are used to combine the multi-electrode body-surface potential data with the heart-torso geometry obtained from CT, to generate electroanatomic maps of potentials, electrograms (EGMs) and activation and repolarization sequences on the epicardial surface. The activation-time was determined from each reconstructed epicardial EGM by the time of steepest negative slope of the EGM. The LV epicardium was delineated from CT, including the epicardial aspect of septum and digitized using 500 points. An intra-LV electrical dyssynchrony index (ED) was computed in a blinded fashion from the ECGI activation maps as the standard deviation of activation times (determined as explained above) at 500 sites on the LV epicardium, including the epicardial aspect of the septum.
Activation isochronal lines on the epicardial surface are depicted in black. Line/region of conduction block is determined if the activation times on its opposite sides differ by more than 40 ms. Regions of slow conduction are identified by crowding of isochrones. Regions of late LV activation are defined by sites where activation time is later than 80th percentile of QRS duration during native rhythm. Percentage of LV area activating late is computed by dividing the number of late LV sites (nodes) by the total number of nodes used to digitize the LV epicardium for ECGI images. Activation-recovery intervals (ARI) over the epicardial surface are computed from the epicardial electrograms as the difference between the recovery time (the time corresponding to the maximum dV/dt during T-wave) and the activation time (steepest downward slope during QRS) and displayed in color-coded maps. Epicardial dispersion of repolarization (ARId) is computed as the difference between the largest and smallest ARI on the entire (RV and LV) epicardial surface.
Control value of ED in a population of 22 young healthy subjects without heart failure was determined at 20±4 ms. A value above the control mean plus twice the standard deviation was deemed as abnormal (ED>28 ms). Hence, LV is defined to be electrically asynchronous when ED ≥28 ms. All study protocols were reviewed and fully approved by the Human Research Protection Office at Washington University and written informed consent was obtained from all patients and/or their legal guardians prior to the study.
Statistical Analysis
Continuous variables are represented as mean ± standard deviation with these measures taken over the total patient population. Relationship between ED and QRSd, and activation time and repolarization ARI are evaluated using Pearson correlation coefficient (r). Student t-test is used to assess the significance of correlation. A P value < 0.05 is considered statistically significant.
RESULTS
Study Population
Between January 2007 and April 2010, 25 heart failure patients (age 51±18 years; range from 6 to 68 years) having a CRT implant, with non-ischemic dilated cardiomyopathy, were recruited retrospectively for the study. Patients were selected from the database of patients who were implanted with a CRT/CRT-ICD device and were being seen at the heart failure clinic at Barnes Jewish Hospital and/or St Louis Children’s Hospital. The following inclusion criteria were used in patient selection: patients without any documented evidence of ischemia till study-date, implanted with CRT or CRT-ICD device at least six months prior to study-date; the CRT implant criteria were symptoms of NYHA Class III/IV heart failure with poor ejection fraction (<30%), accompanied by wide QRSd>120 ms and/or asynchronous wall motion from echocardiography. Post-CRT echo and/or clinical response data were not used in selecting patients. Ischemia was ruled out by the latest coronary angiography performed for clinical reasons before the study and no documented hospitalizations or clinic visits for myocardial infarction till the date of study. No evidence of frank scar or aneurysm was found during echocardiographic evaluation (no areas of akinesis). Three patients (patient # 1, 10, 14) had no underlying rhythm (no atrioventricular [A-V] conduction and no ventricular escape beats at the time of the study). These patients were upgraded to biventricular pacing from RV pacing. Pre-CRT New York Heart Association (NYHA) class was III–IV. Responders to CRT were identified by echocardiographic evidence of reverse LV remodeling9, manifest as reduction in LV end systolic volume by more than 10%, and by a functional NYHA class improvement ≥1.Pre-CRT (pre-implant) echocardiographic data for evaluation of LV volume were chosen as close as possible to the biventricular device implant date. Pre-CRT QRS duration was determined from clinical ECG of the patient, recorded with commercially available standard ECG machine. In addition, a 12-lead ECG with respect to Wilson Central Terminal was recorded in each rhythm at the time of the study. Careful visual determinations of QRS width were made by plotting each ECG lead in Matlab software at high gain and expanded time scale (with a resolution of 0.5 ms). The mean value of QRS duration over all leads was reported. The standard deviation of these measurements in all cases was less than 2 ms. Pre-CRT and post-CRT patient characteristics are listed in the patient summary table (Table 1). Based on the LV volume criterion, patients #4,#8,20 and 22 were classified as non-responders. All others were responders to CRT. All patients had their LV-RV delay set to 0 ms, except for patient # 2 (LV early by 10 ms) and patient # 4 (LV early by 15 ms). The optimal A-V delay was set at the time of implant by Ritter method10 and was 175±28 ms. The LV ejection fraction was 21.6±4.97% before CRT and 34.2±8.44 post-CRT.
Table 1. Patient Characteristics.
(QRSd-QRS duration, LVESV-left ventricular end-systolic volume, LVEF-left ventricular ejection fraction)
| PRE-CRT | POST-CRT | |||||||
|---|---|---|---|---|---|---|---|---|
| Patient# | Age/Sex | Time from | QRSd | LVESV | LVEF | QRSd | LVESV | LVEF |
| implant | ms | ml | % | ms | ml | % | ||
| 1 | 6/F | 6 months | 110 | 32 | 29 | 70 | 24 | 56 |
| 2 | 21/M | 3 years | 215 | 512 | 21 | 150 | 307 | 55 |
| 3 | 66/F | 4 years | 160 | 278 | 16 | 126 | 220 | 37 |
| 4 | 17/M | 2 years | 126 | 137 | 27 | 132.5 | 125 | 28 |
| 5 | 55/F | 3 years | 150 | 86 | 17 | 90 | 45 | 45 |
| 6 | 63/M | 1 year | 118 | 321 | 19 | 100 | 280 | 29 |
| 7 | 50/M | 3 years | 125 | 281 | 24 | 118 | 245 | 33 |
| 8 | 49/M | 4 years | 122 | 160 | 23 | 130 | 153 | 25 |
| 9 | 65/F | 2 years | 140 | 142 | 19 | 93 | 113 | 34 |
| 10 | 59/M | 1 year | 137 | 175 | 25 | 129 | 145 | 44 |
| 11 | 58/M | 1 year | 125 | 153 | 31 | 91 | 131 | 32 |
| 12 | 56/M | 1 year | 100 | 195 | 18 | 72 | 165 | 28 |
| 13 | 68/F | 2 years | 125 | 135 | 27 | 81 | 107 | 46 |
| 14 | 65/F | 2 years | 130 | 213 | 15 | 110 | 121 | 31 |
| 15 | 58/F | 1 year | 121 | 130 | 13 | 105 | 92 | 32 |
| 16 | 64/F | 3 years | 198 | 210 | 14 | 162 | 124 | 29 |
| 17 | 58/M | 2 years | 172 | 198 | 21 | 142 | 162 | 31 |
| 18 | 63/F | 8 months | 164 | 256 | 23 | 137 | 202 | 28 |
| 19 | 49/F | 4 years | 157 | 290 | 25 | 139 | 190 | 33 |
| 20 | 12/M | 2 years | 126 | 78 | 26 | 110 | 75 | 28 |
| 21 | 62/F | 4 years | 121 | 251 | 16 | 83 | 211 | 31 |
| 22 | 50/M | 3 years | 124 | 189 | 25 | 133 | 181 | 26 |
| 23 | 58/F | 5 years | 126 | 167 | 27 | 91 | 110 | 34 |
| 24 | 47/F | 3 years | 128 | 188 | 21 | 85 | 154 | 33 |
| 25 | 53/F | 2 years | 126 | 199 | 18 | 78 | 155 | 28 |
Electrophysiological Substrate: Activation and Repolarization
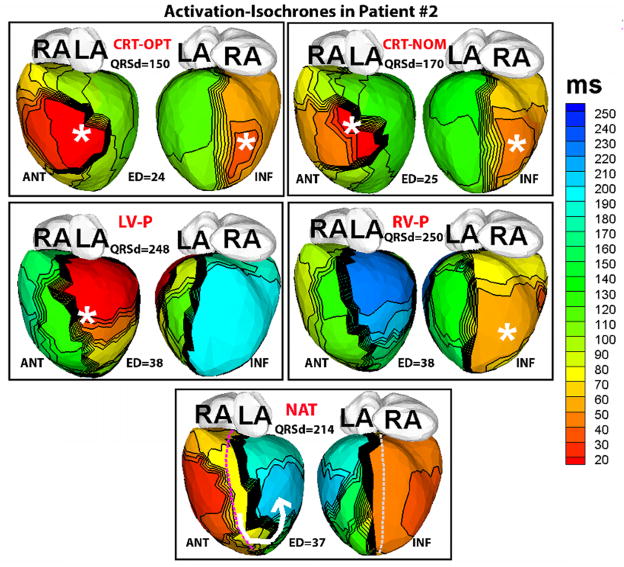
Figure 1 shows representative ECGI epicardial activation isochrone maps in a responder patient (#2). These maps are representative of the data from all responder patients. The ECGI maps for each rhythm are shown in the left anterior oblique (ANT) and inferior (INF) views. The ECG QRS duration (QRSd) and the electrical dyssynchrony (ED) index of LV activation for each condition are also listed, and locations of the pacing sites are marked by asterisks. The native activation in responders (NAT, Figure 1) is characterized by a line of conduction block (indicated by a thick black line) located between the epicardial aspect of the septum and the LV lateral wall, causing activation to turn around the apex (white arrow; “U-shaped activation”)1,8 and resulting in late activation (dark blue, NAT, Figure 1) of a large portion of the lateral and inferior wall. A substantially large percentage of the LV epicardium (48±16%) in all responders activated later than the 80th percentile of the QRS duration compared to controls (13±6%).
Figure 1.
ECGI activation-isochrone maps in patient # 2, who had a wide QRS (QRS duration QRSd=215 ms) pre-implant and responded well to CRT. Isochronal lines are depicted in black. Thick black lines indicate conduction block, while crowded isochronal lines indicate slow conduction. Pacing sites are indicated by asterisk. Each panel shows anterior (left,ANT) and inferior (right, INF) four-chamber views. Epicardial activation sequences are imaged during 1) optimal CRT settings (CRT-OPT) 2) nominal CRT settings (CRT-NOM) 3) LV pacing (LV-P) 4) RV pacing (RV-P) and 5) native sinus rhythm (NAT). QRS duration (QRSd) and electrical dysynchrony index (ED) computed from the epicardial activation maps (in milliseconds) are shown for each rhythm. RA- right atrium, LA- left atrium. The septal aspect of the epicardium is shown by dotted lines (purple, ANT view and grey, INF view) in the NAT panel.
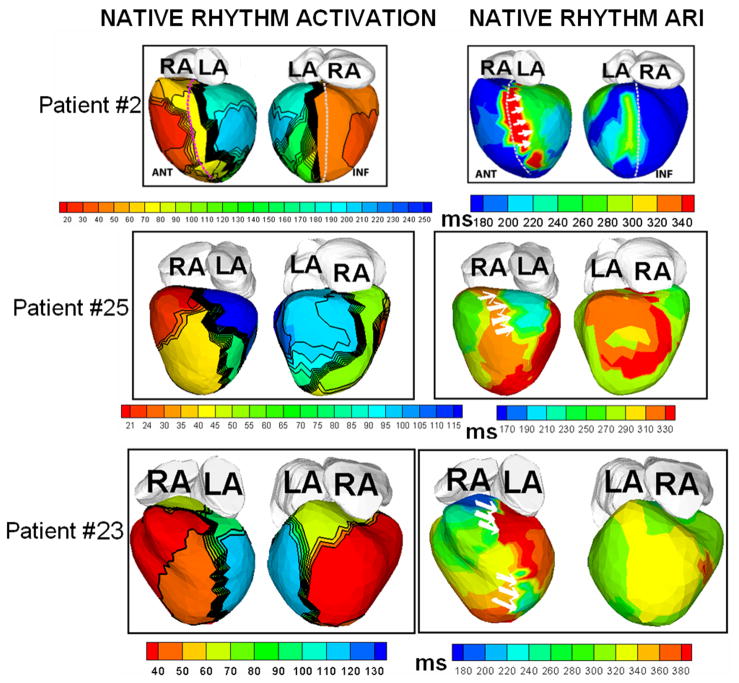
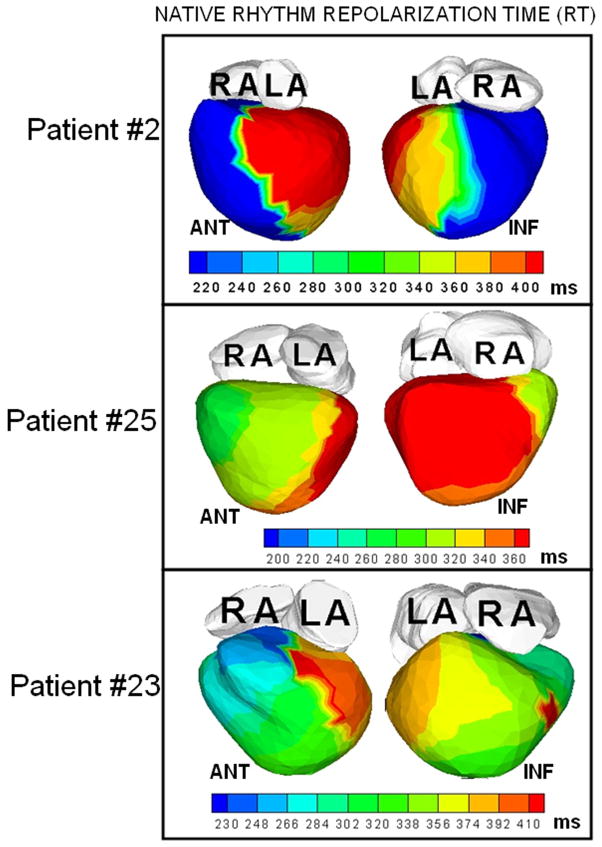
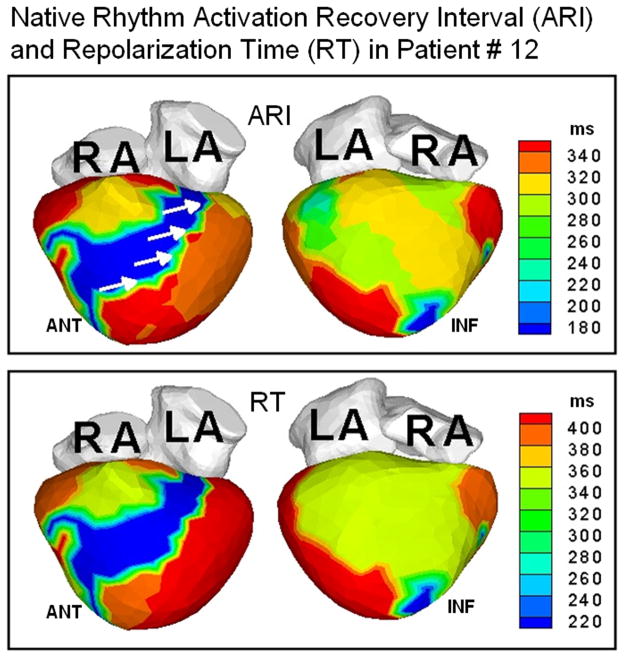
Figure 2 shows representative ECGI data from three patients. Native-rhythm activation maps and activation-recovery (ARI) maps are displayed together to demonstrate co-localization of areas of conduction block (thick black lines in the activation map) with steep repolarization ARI gradients (indicated by white arrows on the ARI maps). Transition of colors from blue or green to red or orange across these regions reflect large differences in ARI by 120–200 ms, leading to very steep localized repolarization gradients across the line of conduction block. Steep localized ARI gradients (ΔARI = 106 ±28 ms/mm; at least 10 times the control value of ΔARI which ranged from 4 ms/mm to 11 ms/mm in normal hearts) were observed across the lines of conduction block. The native rhythm ARI near the line of block was significantly prolonged (348±39 ms) compared to the mean value of normal ARI in the same region (235 ms). This is consistent with the observation of prolonged action potential duration in heart failure.11 Figure 3 shows the total repolarization time (RT) maps during native rhythm in patients #2, 23 and 25 (the corresponding ARI maps are shown in Figure 2). In patient #2, the gradients between the epicardial aspect of anterior septum and LV lateral wall observed in the ARI map are not apparent in the RT map. This is because the lateral wall activates about 150 ms later than the epicardial aspect of the anterior septum. This long time delay masks the ARI dispersion between these two regions. However, regions which activate without conduction delay (for example the anterior lateral RV and the epicardial aspect of the septum), show similar dispersion in both ARI and RT maps. Similar observations are made in patient #23. In patient #25, some of the dispersion in ARI maps is preserved in the RT maps, where the delay in activation is not enough to compensate for the ARI difference. In patients with narrow QRS (e.g. Figure 4, patient #12 whose native QRSd=100 ms), the difference in activation times between spatially adjacent areas of the ventricle is at most 40–50 ms, and total repolarization times and their dispersion are primarily determined by the ARI and ARI dispersion. Patterns in RT maps closely follow the ARI patterns in such cases. ARIs reflect intrinsic repolarization properties and have been shown to correlate with the local action potential duration.12 As such, they reflect changes due to remodeling processes if present in the diseased myocardium. Abnormally steep ARI dispersion between the epicardial aspect of the septum and LV lateral wall is present in all patients in the native rhythm, and is co-localized with a line of block. RT dispersion depends on both, the local ARIs and the activation sequence, and in the presence of significant conduction delays does not always reflect the ARI dispersion. Importantly, RT dispersion creates the conditions (substrate) for a functional conduction block of a following (premature) excitation wave.
Figure 2.
Native rhythm activation and ARI maps from three patients, displayed together to demonstrate the co-localization of conduction block lines (thick black lines on activation map) and areas of steep repolarization gradients (white arrows on ARI maps).
Figure 3.
Total repolarization time (RT) maps during native rhythm in three patients whose ARI maps are shown in Figure 2 (in identical views).
Figure 4.
Top: ARI maps in patient #12 who had a narrow QRS duration (100 ms). White arrows indicate ARI dispersion in the LV between the epicardial aspect of the septum and lateral wall. Bottom: RT maps in the same patient.
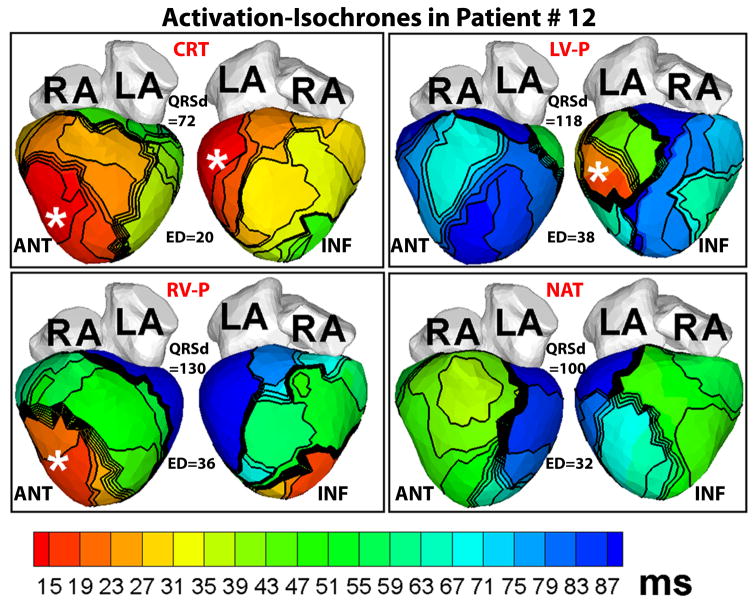
Figure 5 provides another example of ECGI activation maps in a responder patient (#12). Though his native QRS duration is only 100 ms, the native activation pattern (NAT, Figure 5) is very dysynchronous (ED=32 ms), characterized by lines of block and delayed activation of extensive areas of the LV lateral and inferior wall (blue, NAT, Figure 5). CRT restores LV ED to normal value (20 ms).
Figure 5.
ECGI activation-isochrone maps in patient #12 who had a normal QRS duration and left bundle branch block pattern before implant, arranged in the same format as Figure 1. Note the large electrical dysynchrony (ED=32 ms) in the native rhythm (NAT) in spite of a normal QRS duration (QRSd=100 ms). CRT (CRT panel) restores electrical synchrony (ED=20 ms) in the normal range.
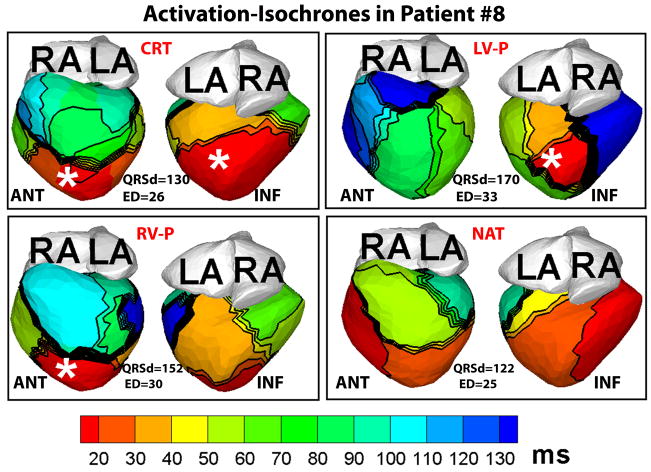
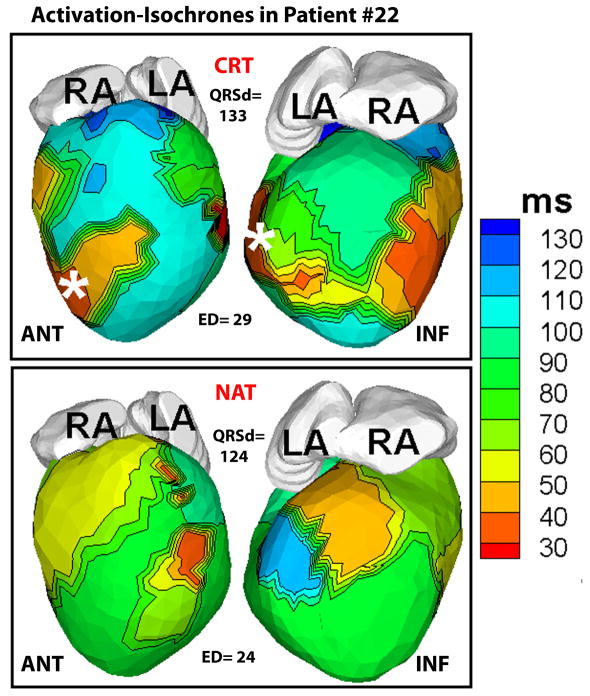
Figure 6 shows representative ECGI activation-isochrones in a non-responder patient. The lines of conduction block and the U-shaped activation pattern between the epicardial septal aspect and the lateral wall, typical of the native activation of responder patients, were not observed in the non-responder native rhythm. There was a small area of slow conduction (crowded isochrones) in the LV, but it affected only a small portion of the lateral wall (blue). The LV activation was synchronized (ED=25 ms) in native rhythm and did not change substantially with CRT (ED=26 ms). Figure 7 demonstrates ECGI activation maps in another non-responder patient (#22) in CRT and native (NAT) rhythms. The native activation showed an incomplete right bundle branch block pattern with the earliest LV activation (red) occurring 20 ms before the earliest RV activation (light green), but the overall intra-LV ED was close to control values (24 ms). CRT pacing made LV activation more heterogeneous and did not improve ED, which increased to 29 ms.
Figure 6.
ECGI activation-isochrones in a non-responder patient (#8), arranged in the same format as Figure 1. Note that in spite of a wide QRS duration (QRSd>120 ms) in the native rhythm (NAT), electrical dyssynchrony of epicardial activation was minimal (ED=25 ms) because only a small portion of the LV lateral wall activated late (light blue). Electrical dyssynchrony index remained unchanged with CRT (CRT panel).
Figure 7.
Baseline CRT and native activation in another non-responder patient (#22). Native activation shows earliest activation of LV (red) 20 ms before earliest RV activation (light green) and electrical dyssynchrony (ED) close to normal value (24 ms). CRT pacing did not improve ED (29 ms).
LV Electrical Dyssynchrony
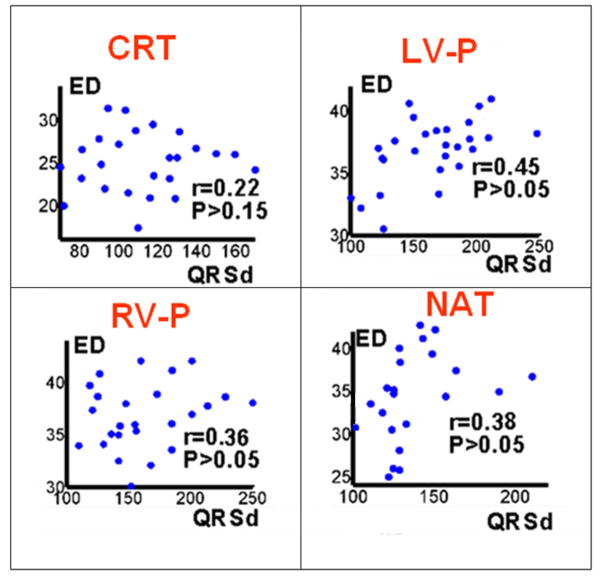
The scatter plots in Figure 8 demonstrate the relationship between QRSd and ED for different rhythms (CRT-P, LV-P, RV-P and NAT), combining data from all patients. There is a weak positive correlation between QRSd and ED. A summary of the values of the ED index over the entire patient population is provided in Table 2. For patients with native QRSd> 130 ms, the ED index was consistently high (≥ 30 ms). However, for QRSd< 130 ms, the ED values ranged from 24 ms (synchronized LV activation) to 40 ms (dyssynchronous LV activation). Only 2 patients had native QRSd < 120 ms. Their QRSd was 100 ms and 118 ms, and their native ED values were 32 and 34 ms, respectively. Both were CRT responders. Responders in general had their baseline CRT ED values significantly lowered (P<0.05) compared to native ED values. The QRS duration (QRSd) of responders (n=21) in this study was 140±28 ms pre-implant and 107±27 ms post-CRT. The mean reduction is 33 ms which corresponds to a mean change in QRSd by 23%. Similar relative changes in QRSd have been observed in CRT responders in a previous study13. Four non-responders did not show a significant difference in ED values between baseline CRT and native rhythms (P>0.1). The native QRSd of all four non-responders were in the range of 120–130 ms.
Figure 8.
Scatter plots of electrical dyssynchrony (ED) vs QRS duration (QRSd), 1) CRT rhythm 2) LV paced rhythm (LV-P) 3) RV paced rhythm (RV-P) and 4) native sinus rhythm (NAT).
Table 2. Summary of LV Electrical Dyssynchrony Index Values.
(QRSd-QRS duration, ED- electrical dyssynchrony of left ventricular activation)
| Patients with QRSd <=130 ms | Patients with QRSd>130 ms | Responders | Non-responders |
|---|---|---|---|
| n=14 | n=8 | n= 18 | n=4 |
| Native ED=32.1±4.3ms | Native ED=36.8±4.6ms | Native ED=35.5±3.9ms | Native ED=26.3±2.3 |
| Max: 40 ms, Min: 24 ms | Max: 45 ms, Min: 30 ms | Baseline CRT ED=23.2±4.4ms | Baseline CRT ED=27.0±1.4 |
Max = maximum, Min = minimum
DISCUSSION
LV Electrophysiological Substrate
The native activation pattern in non-ischemic cardiomyopathy is similar among patients, in contrast to the large variability observed in ischemic CRT patients by Jia et al8. The activation pattern is characterized by lines of conduction block extending from base to apex and located between the epicardial aspect of the septum and the LV lateral wall. This results in U-shaped activation around the line of block and very delayed activation (later than 80th percentile of QRSd) of a large portion of the LV lateral and inferior wall. Similar lines of block were also reported in invasive endocardial activation mapping studies in dilated cardiomyopathy patients by Auricchio et al1. Unlike previous observations8 in ischemic cardiomyopathy, where the locations and orientations of conduction block lines were variable, depending on the location and extent of the infarct, lines of conduction block in non-ischemic cardiomyopathy are located in the general anatomic area between the septum and the LV lateral wall and are oriented roughly parallel to the long axis from base to apex. The ARI maps (Figure 2) show that steep ARI gradients co-localize with the regions of conduction block. Moreover, the block lines shift during pacing from RV or LV leads. These observations suggest the possibility that these blocks are, at least in part, functional in nature. We observe abnormally long ARIs near the line of block, which reflect prolonged action potential durations11. No significant inverse relationship was observed between activation time and ARI (r=0.12±0.27). Although such inverse relationship was demonstrated in normal subjects14, it has not been established in cardiomyopathy with conduction disorders like left bundle branch block. A previous study15 measuring ventricular activation-times and ARIs over the anteroseptal wall reported an inverse relationship between activation time and ARI in cardiomyopathy patients without a history of ventricular tachycardias and/or T-wave alternans. The discrepancy between the findings of that study and the current study may be due to the limited sampling of a specific region of the epicardium. The relationship between activation-time and ARI in the current study has been determined based on sampling over the entire epicardium. Indeed, looking just at the anteroseptal region (Figure 2), the inverse relation between activation time and ARI is apparent; areas that activate early (red, orange or yellow on activation map, ANT view) in the epicardial aspect of anterior septum have longer ARIs (red, orange or yellow on the corresponding regions of the ARI maps). But that relationship is not preserved while taking the entire epicardium into account. It is well known that progression of heart failure alters the underlying electrophysiological substrate11. In addition to that, these patients have been paced with CRT for an extended period of time. Pacing in turn can cause further electrical remodeling, especially changes in repolarizing currents16. The abnormal repolarization and steep ARI gradients observed in this study were not observed in earlier ECGI studies of repolarization in structurally normal hearts 5–7.
LV Electrical Dyssynchrony
The LV ED index showed a weak positive correlation with QRSd. This is expected because these two quantities are not synonymous. QRSd is an estimate of the duration of global ventricular activation as reflected on the body-surface ECG. ED, by definition, is a measure of the spatial dispersion of activation times across the LV, and depends on how much of the LV activates late relative to the rest of LV myocardium. For example, in patient #12, a major portion of the LV lateral and inferior wall (blue, NAT, Figure 5) activated later than the 80th percentile of QRSd, resulting in a relatively high value of native ED (32 ms), while in patient #8, only a very small portion of the LV lateral wall activated late (light blue, NAT, Figure 6) resulting in a more synchronized ED index (25 ms).
From Table 2, it is observed that LV electrical dyssynchrony is consistently high (ED ≥30 ms) for native QRSd > 130 ms. But among patients with native QRSd≤130 ms, electrical dyssynchrony may vary widely (from minimal to large LV electrical dyssynchrony). Four patients with QRSd between 120 ms and 130 ms had synchronized LV activation (ED<28 ms) and all of them were non-responders. There were two patients with QRSd<120 ms who had very dyssynchronous LV activation (ED=32 and 34 ms) during native rhythm, and both of them responded to CRT. This suggests that for some heart failure patients with QRSd< 120 ms, the native ED index may still be high and such patients may be potential responders to CRT. By using QRSd as a strict cut-off for CRT implant decisions, it is possible that these potential beneficiaries of CRT therapy will be missed. On the other hand, if the implant decisions were based solely on QRSd>120 ms, it is possible that candidates with QRSd between 120–130 ms will be implanted despite having already synchronized native LV activation, which is not likely to improve further with CRT. While QRSd is a valuable measure for CRT response, cardiac indices like ED may complement QRSd, especially when the QRS width is moderate (100 – 130 ms). This study does not establish a measure for identifying potential responders and non-responders to CRT. It only suggests the possibility that an additional non-echocardiographic cardiac measure (the electrical dyssynchrony index, ED), obtained noninvasively, may be useful for identifying responders versus non-responders in the range of moderately wide QRS duration (100–130 ms).This possibility should be examined in a randomized prospective study involving a larger population of patients with QRSd in this range.
Study Limitations
This study does not include effects of parameters like A-V delay, V-V delay, or location of resynchronization leads on ventricular activation and function. 24 out of 25 patients in this study had their LV leads in the lateral wall. Only 1 patient (Patient #2) had an anterior LV lead and he was a CRT responder. However, this study was not designed to systematically address the effect of location of resynchronization leads on CRT response and results from this study were not used to guide lead placement. In the future, ECGI may be used in real-time in the EP catheterization laboratory during CRT implant to assess potential areas of lead placement and their effects on LV activation and electrical synchrony.
The study does not include pre-implant data. ECGI maps provide electrical dyssynchrony of the epicardium only and no information is obtained about transmural and endocardial dyssynchrony. This is a limitation of ECGI methodology, although animal studies17 have shown that assessment of epicardial electrical synchrony provides adequate assessment of intramural synchrony as well.
Thenumber of patients in this study (25) is small and the focus is on non-ischemic patients. It is not representative of the entire CRT population which includes both ischemic and non-ischemic patients. Future prospective ECGI studies involving larger population of CRT patients in both ischemic and non-ischemic categories are required to derive statistical conclusions and establish new ECGI-based criteria for CRT.
Acknowledgments
The authors acknowledge the superb technical expertise of Timothy Sekarski in acquisition of the echocardiographic images and capable assistance of Timothy Street in performing CT scans for this study.
Funding Sources: The study was supported by Grants R01-HL-33343-26 and R01-HL-49054-18 from the National Heart, Lung, and Blood Institute to Yoram Rudy. This publication was also made possible by Grant Number UL1 RR024992 from the National Center for Research Resources (NCRR), a component of the National Institutes of Health (NIH), and NIH Roadmap for Medical Research. Its contents are solely the responsibility of the authors and do not necessarily represent the official view of NCRR or NIH. Dr. Rudy is the Fred Saigh Distinguished Professor at Washington University in St. Louis.
Footnotes
Conflict of Interest Disclosures: Y. Rudy co-chairs the scientific advisory board and holds equity in CardioInsight Technologies (CIT). CIT does not support any research conducted by Y.R., including that presented here.
Publisher's Disclaimer: This is a PDF file of an unedited manuscript that has been accepted for publication. As a service to our customers we are providing this early version of the manuscript. The manuscript will undergo copyediting, typesetting, and review of the resulting proof before it is published in its final citable form. Please note that during the production process errors may be discovered which could affect the content, and all legal disclaimers that apply to the journal pertain.
References
- 1.Auricchio A, Fantoni C, Regoli F, et al. Characterization of left ventricular activation in patients with heart failure and left-bundle branch block. Circulation. 2004;109:1133–1139. doi: 10.1161/01.CIR.0000118502.91105.F6. [DOI] [PubMed] [Google Scholar]
- 2.Chung ES, Leon AR, Tavazzi L, et al. Results of the predictors of response to CRT (Prospect) trial. Circulation. 2008;117:2608–2616. doi: 10.1161/CIRCULATIONAHA.107.743120. [DOI] [PubMed] [Google Scholar]
- 3.Beshai JF, Grimm RA, Nagueh SF, et al. Cardiac resynchronization therapy in heart failure with narrow QRS complexes. N Engl J Med. 2007;357:2461–2471. doi: 10.1056/NEJMoa0706695. [DOI] [PubMed] [Google Scholar]
- 4.Williams LK, Ellery S, Patel K, et al. Short-term hemodynamic effects of cardiac resynchronization therapy in patients with heart failure, a narrow QRS duration and no dyssynchrony. Circulation. 2009;120:1687–1694. doi: 10.1161/CIRCULATIONAHA.108.799395. [DOI] [PubMed] [Google Scholar]
- 5.Ramanathan C, Ghanem RN, Jia P, Ryu K, Rudy Y. Noninvasive electrocardiographic imaging for cardiac electrophysiology and arrhythmia. Nat Med. 2004;10:422–428. doi: 10.1038/nm1011. [DOI] [PMC free article] [PubMed] [Google Scholar]
- 6.Ramanathan C, Jia P, Ghanem R, et al. Activation and repolarization of the normal human heart under complete physiological conditions. Proc Natl Acad Sci USA. 2006;103:6309–6314. doi: 10.1073/pnas.0601533103. [DOI] [PMC free article] [PubMed] [Google Scholar]
- 7.Ghosh S, Rhee EK, Avari JN, Woodard PK, Rudy Y. Cardiac Memory in WPW Patients: Noninvasive Imaging of Activation and Repolarization before and after Catheter Ablation. Circulation. 2008;118:907–915. doi: 10.1161/CIRCULATIONAHA.108.781658. [DOI] [PMC free article] [PubMed] [Google Scholar]
- 8.Jia P, Ramanathan C, Ghanem RN, Ryu K, et al. Electrocardiographic imaging of cardiac resynchronization therapy in heart failure: observation of variable electrophysiologic responses. Heart Rhythm. 2006;3:296–310. doi: 10.1016/j.hrthm.2005.11.025. [DOI] [PMC free article] [PubMed] [Google Scholar]
- 9.Yu C-M, Bleeker GB, Fung JW-H, et al. Left ventricular reverse remodeling but not clinical improvement predicts long-term survival after cardiac resynchronization therapy. Circulation. 2005;112:1580–1586. doi: 10.1161/CIRCULATIONAHA.105.538272. [DOI] [PubMed] [Google Scholar]
- 10.Ritter P, Padeletti L, Gillio-Meina L, Gaggini G. Determination of the optimal atrioventricular delay in DDD pacing. Comparison between echo and peak endocardial acceleration measurements. Europace. 1999;1:126–130. doi: 10.1053/eupc.1998.0032. [DOI] [PubMed] [Google Scholar]
- 11.Tomaselli GF, Marban E. Electrophysiological remodeling in hypertrophy and heart failure. Cardiovasc Res. 1999;42:270–283. doi: 10.1016/s0008-6363(99)00017-6. [DOI] [PubMed] [Google Scholar]
- 12.Haws CL, Lux RL. Correlation between in vivo transmembrane action potential durations and activation-recovery intervals from electrograms. Circulation. 1990;81:281–288. doi: 10.1161/01.cir.81.1.281. [DOI] [PubMed] [Google Scholar]
- 13.Penicka M, Bartunek J, Bruyne BD, et al. Improvement of left ventricular function after cardiac resynchronization therapy is predicted by tissue Doppler imaging echocardiography. Circulation. 2004;109:978–983. doi: 10.1161/01.CIR.0000116765.43251.D7. [DOI] [PubMed] [Google Scholar]
- 14.Iwata K, Hirai M, Yoshida Y, et al. Inverse relation of body-surface activation-recovery interval and recovery time to activation time in normal subjects. Pacing Clin Electrophysiol. 1999;22:855–865. doi: 10.1111/j.1540-8159.1999.tb06808.x. [DOI] [PubMed] [Google Scholar]
- 15.Chauhan VS, Downar E, Nanthakumar K, et al. Increased ventricular repolarization heterogeneity in patients with ventricular arrhythmia vulnerability and cardiomyopathy: a human in vivo study. Am J Physiol Heart Circ Physiol. 2006;290:H79–H86. doi: 10.1152/ajpheart.00648.2005. [DOI] [PubMed] [Google Scholar]
- 16.Saba S, Mehdi H, Mathier MA, Islam MZ, Salama G, London B. Effect of right ventricular versus biventricular pacing on electrical remodeling in the normal heart. Circulation: Arrhythmia and Electrophysiol. 2010;3:79–87. doi: 10.1161/CIRCEP.109.889741. [DOI] [PMC free article] [PubMed] [Google Scholar]
- 17.Faris OP, Evans FJ, Dick AJ, et al. Endocardial versus epicardial electrical synchrony during LV free-wall pacing. Am J Physiol Heart Circ Physiol. 2003;285:H1864–H1870. doi: 10.1152/ajpheart.00282.2003. [DOI] [PMC free article] [PubMed] [Google Scholar]


