

Abstract
The physical nature of a cell’s microenvironment – including the elasticity of the surrounding tissue – appears to exert a significant influence on cell morphology, cytoskeleton, and gene expression. We have previously shown that committed muscle cells will develop sarcomeric striations of skeletal muscle myosin II only when the cells are grown on a compliant gel that closely matches the passive compliance of skeletal muscle. We have more recently shown with the same types of elastic gels that mesenchymal stem cells (MSCs) maximally express myogenic genes, even in the absence of tailored soluble factors. Here, we provide detailed methods not only for how we make and nanomechanically characterize hydrogels of muscle-like elasticity, but also how we culture MSCs and characterize their myogenic induction by whole human genome transcript analysis.
Keywords: Mesenchymal stem cells, Myogenesis, Elasticity, Microenvironment, MyoD
1. Introduction
Cell culture has a principal goal of translating in vivo cellular environments to in vitro platforms that enable better control and deeper study. Growth factors in serum media as well as oxygenation are rightly considered important, but physical factors should not be neglected. For example, cell cultures are maintained at 37°C because many cellular processes prove highly sensitive to even small deviations from body temperature – noting that fever is defined by only a 1–2°C increase. Additional physical features of the in vivo microenvironment are also likely to be important. In particular, most tissue cells are taken from physically soft tissues and yet most culture studies are conducted on rigid glass coverslips or polystyrene culture dishes. Synthetic gels can be made that mimic not only the extracellular matrix ligand but also the elasticity of soft tissues and thereby enable tests of the hypothesis that tissue elasticity affects cell fates.
In most soft tissues – brain, muscle, skin, etc. – a combination of adherent cells and extracellular matrix establish the relatively elastic environment. At the macroscopic scale, elasticity is evident from a solid tissue’s ability to recover its shape within seconds after acute deformations (e.g., poking). Regardless of geometry, the intrinsic resistance of a solid to a mechanical stress is measured by the solid’s elastic modulus E, which is most simply obtained by applying a force and measuring the resulting deformation. Based on such measurements, comparisons of three diverse tissues which contain a number of different cell types and distinct extracellular matrices show that brain tissue with all of its neurons and other cell types (E ~ 0.5 kPa (1)) is distinctly softer than unstimulated striated muscle (E ~ 10–20 kPa transverse to the muscle axis (2)). Muscle appears in turn to be softer than the combination of epithelial cells, fibroblasts, and other cell types that make up skin (E ~ 50 kPa (3)). Translating tissue Es to the types of elastic gel systems useful for cell culture is the focus here. Numerous gel systems – particularly polyacrylamide gels – have tunable E that can be adjusted over several orders of magnitude from extremely soft to stiff, thus mimicking a wide range of tissues by controlling the extent of polymer cross-linking.
Given the appropriate adhesive ligand at sufficient density, cells from solid tissues adhere to a wide-range of elastic matrices (4, 5). Adhesion complexes generally couple into the cell’s actin–myosin contractile apparatus, which assembles into stress fibers in cells cultured on rigid substrates (6). What is new and important is that this prototypical assembly process sets up a feedback of matricellular elasticity on cytoskeletal structure and adhesions (7). Potent mechanotransductive components couple some well-known signaling processes into anchorage-dependent viability and additional processes such as differentiation (2, 8) as is emphasized here with adult bone-marrow-derived mesenchymal stem cells (MSCs). These cells have been found to differentiate into various cell lineages – nascent neurons, myocytes, and osteoblasts – when cultured in identical media on substrates with tissue-mimetic stiffness (8). The goal of this chapter is to summarize the key methods in making and characterizing the cultures that maximize elasticity-promoted myogenic induction of MSCs. The methods include gel preparation, mechanical measurements of gel elasticity, culture details, immunofluorescence for protein markers, and isolation–amplification–labeling of RNA from these cells on gels for whole human genome microarray studies of cells on gels. The goal is to help guide the development of better cell culture methods.
2. Materials
2.1. Cell Culture
Dulbecco’s Modified Eagle’s Medium (DMEM), low glucose 1× (Gibco, Invitrogen, Grand Island, NY) (1 g/L D-glucose, L-glutamine and 110 mg/L Sodium Pyruvate).
Fetal bovine serum (FBS, HyClone, Ogden, UT).
Penicillin/Streptomycin (Cellgro, Mediatech Inc, Herndon, VA).
Solution of trypsin (0.05%) and ethylenediamine tetraacetic acid (EDTA) (1 mM) (Gibco, Invitrogen, Grand Island, NY).
Trizol Reagent (Invitrogen, Carlsbad, CA).
Dimethyl sulfoxide, DMSO (Hybri-Max) (Sigma, St. Louis, MO).
Triton-X solution, 0.5% (Sigma, St. Louis, MO).
2.2. Polyacrylamide Gel Preparation
25 mm cir. Microscope coverslips (Fisherbrand, Fisher Scientific, Pittsburgh, PA).
25 mm sq. Microscope coverslips (Fisherbrand, Fisher Scientific, Pittsburgh, PA).
45 × 50 mm Microscope coverslips (Fisherbrand, Fisher Scientific, Pittsburgh, PA).
3-Aminopropyltriethoxysilane (APTES, Aldrich, St. Louis, MO). Moisture-sensitive reagent, corrosive).
Ammonium persulfate (APS) (Bio-Rad, Hercules, CA). 10% solution should be stored in small aliquots at −20°C.
N,N,N′,N′-Tetramethylene-diamine (TEMED) (Sigma, St. Louis, MO). Highly flammable and corrosive.
Acrylamide, 40% stock solution (Sigma, St. Louis, MO). Sterile filtered. Should be stored at 4°C and protected from light (not longer than 3 months after opening; see Note 1).
N,N′-Methylene bis-acrylamide (Sigma, St. Louis, MO).
Sodium hydroxide (Sigma, St. Louis, MO).
50 mM HEPES buffer, pH = 8.5 (99.5%, Sigma, St. Louis, MO). Sterile filtered (see Note 2).
Sulfosuccinimidyl-6-(4′-azido-2′-nitrophenylamino) hexanoate (Sulfo-SANPAH) (Pierce, Rockford, IL). Solutions should be stored at −20°C.
Glutaraldehyde (50% Grade I, Sigma, St. Louis, MO). Should be stored at −20°C.
Dichlorodimethylsiloxane (CMS) (Aldrich, 99.5%, St. Louis, MO). Air sensitive, highly inflammable, and irritant.
Acetic acid, glacial (Fisher Scientific, Fair Lawn, NJ).
Collagen I (from rat tail, BD Biosciences, Bedford, MA). Should be stored at 4°C.
Distilled water (dH2O).
Phosphate buffered saline (PBS) solution (Gibco, Invitrogen).
Dulbecco’s Phosphate Buffered Saline, PBS (1×, no magnesium chloride, no calcium chloride) (Gibco, Invitrogen, Grand Island, NY).
75 cm2 (larger flasks may be used for initial cell expansion) canted neck cell culture flasks (Corning, NY).
6-well tissue culture treated plates (Corning, NY).
Bone marrow derived adult human mesenchymal stem cells (hMSCs) (Lonza, Walkersville, MD).
2.3. Indirect Immunofluorescence for the Myogenic Proteins
Paraformaldehyde solution (PFA), 10% (32% solution, EM grade, Electron Microscopy Sciences, Hatfield, PA) in 1× PBS. Prepare a 4% (v/v) solution by diluting 1 part with 7 parts of 1× PBS. Vortex the solution for several minutes to make sure that the solution is homogeneous.
0.5% Triton X (v/v) solution in 1× PBS for permeabilizing the cell membrane.
1× Phosphate-buffered saline for the different washes.
3% bovine serum albumin (BSA) (Sigma, St. Louis, MO) in 1× PBS-Blocking solution.
1% BSA in 1× PBS- Primary/secondary antibody dilution buffer.
Primary antibodies used in the respective ratios as and when necessary. For example, MyoD (Sigma, St. Louis, MO) (1:100 dilution); Pax7 (Developmental Studies Hybridoma Bank, DSHB, Iowa City, IA) (1:200 dilution).
Alexa 488 conjugated donkey anti-mouse secondary antibodies (Molecular Probes, Invitrogen, Eugene, OR).
Rhodamine phalloidin solution in methanol, 6.6 μM (Molecular Probes, Invitrogen, Eugene, OR) for actin staining.
DAPI (4,6-diamidino-2-phenylindole) solution (Sigma, St. Louis, MO) for nuclear staining.
Aqueous Mounting Medium-Biomeda Mounting Media (Gel/Mount) (Biomeda Corp., Foster City, CA).
Nail polish (N.Y.C., Uniondale, NY).
2.4. Microarray Analysis of the MSCs Cultured on the Polyacrylamide Gel Substrates
Trizol reagent (Invitrogen, Carlsbad, CA) for storing the cell pellets prior to RNA extraction followed by the microarray analysis.
QIAzol lysis reagent (Qiagen, Maryland) contains phenol, guanidine thiocyanate: toxic, corrosive. This solution is used for efficient lysis of the cells for total RNA extraction.
Buffer RPE (Qiagen, Maryland).
WT-Ovation Pico RNA Amplification System kit (NuGEN Technologies Inc., San Carlos, CA).
WT-Ovation Exon Module (NuGEN Technologies Inc., San Carlos, CA).
FL-Ovation cDNA Biotin Module V2 (NuGEN Technologies Inc., San Carlos, CA).
Affymetrix Human Gene 1.0ST Chip (Affymetrix, Santa Clara, CA).
3. Methods
In order to obtain consistent results with these polyacrylamide gels, it is critically important to maintain the polymerization conditions, buffer parameters, cross-linking, the number of cells (mesenchymal stem cells, MSCs) plated and the number of passage of cells used for plating on the gels of desired stiffness. It is very important to determine the correct concentration of the cross-linker as well as other components.
3.1. Cleaning and Functionalization of Glass Coverslips
Cleaned 25 mm coverslip(s) are placed on a hot plate (Corning). These coverslips can be sprayed with 70% alcohol and dried using Kimwipes just before use in order to get rid of all the accumulated dust. 0.033 N NaOH is prepared and the solution is filter-sterilized before use. Freshly prepared solution is recommended at this step. 900 μl of 0.033 N NaoH is carefully pipetted on to the coverslip. This ascertains a uniformity of the level of the solution on top of the coverslip, covering the entire glass surface. Then these coverslips are heated to 150°C till the liquid has completely evaporated from the glass surface. This evaporation should leave a thin white film on these coverslips.
These round coverslips are then removed from the hot plate and placed in the fume hood. Using a syringe, 120–150 μl of APTES is added slowly onto the surface of the coverslip(s) (see Note 3). It is to be noted here that not an excess of APTES is desirable at this step. APTES is added just to have a uniform covering of the glass surface. About 5–7 min is allowed for APTES to react. This ensures a complete aminosilanization of these coverslips. At this point, coverslips are removed. Distilled water is sprayed at an angle to these coverslips, not too hard, allowing the water to trickle down along the surface. This step is to be continued until the point the water does not stick to the coverslips anymore. The aminosilanized coverslips are immersed in distilled water in 100 mm petri dishes. Generally, these coverslips are put in such a way so that they are not on top of each other. It is also to be noted here that great care should be taken to make sure that the treated side is up and it is not flipped around.
These coverslip(s) are rinsed with dH2O thrice for 5 min each time.
They are then moved to a premixed solution of 0.5% glutaraldehyde in 1× PBS (stock concentration being 50% glutaraldehyde) in 100 mm petri dishes and allowed to stand for 30 min at room temperature. During this step, great care should be taken to make sure that the treated side of the coverslips is free and not covered by each other.
These coverslips are then rinsed again with dH2O thrice for 5 min each time.
3.2. Preparation of the Polyacrylamide Gels
The edges of the aminosilanized round coverslips should be wiped with Kimwipes to dry and then they should be kept on a moist surface, preferably, wet paper towels (to avoid wrinkles of the PA gels at the edges due to evaporation), with treated side up. The top surface should be dry before the PA gel solutions are added.
Cold CMS solution is spread onto the 25 mm square coverslips (see Note 3). Care should be taken so that the volume added is just enough to cover the surface and addition should always be done in the fume hood as it is very corrosive. It is then allowed to stand for 1 min. The CMS is then wiped off from the coverslips with a kimwipe (see Note 4). dH2O is then sprayed to these CMS-treated coverslips and wiped with kimwipes thrice. It is to be noted here that water should not be sticking to these square coverslips and excess CMS may lead to that. That is why removal of the excess CMS is very critical. These coverslips are then sprayed with dH2O one more time and then set aside to dry, with the treated side up.
Acrylamide and bis-acrylamide solutions are made to their desired concentrations in 1× PBS to attain desired matrix elasticity. For 11 kPA gels, a solution of 6% acrylamide and 0.14% of bis-acrylamide in PBS should be prepared. However, it is essential to confirm the elasticity of the resulting hydrogels by AFM as explained later.
1 ml of the desired solution is made. To 990 μl of this 11 kPA matrix elasticity solution, 10 μl of 10% APS (1/100 volume) and 1 μl of TEMED (1/1,000 volume) are quickly added and thoroughly vortexed for 5 s to obtain the PA gel solution.
35 μl of this gel solution is subsequently (avoid delays since the polymerization starts immediately) pipetted onto the center of the aminosilanated coverslips (as described in the procedure for preparing coverslips) with the treated size up. Then, to a flat and uniform gel surface, CMS-treated square chlorosilanated coverslips, prepared in step 2 of this procedure are carefully placed on top of the polymerizing gel solution, with the treated side down. Great care should be taken here in order to avoid air bubble formation due to the sandwich formation between the two coverslips. Air bubbles will lead to a nonuniform cell culture surface and erroneous measurements of the matrix elasticity by AFM. The glass slips are covered with the top of a six-well plate to keep the gels in a humid atmosphere to minimize evaporation effects on the edges. The remaining portion of the PA solution may be kept in the vial next to the gels just to confirm when the polymerization process is complete.
Polymerization of the gels is to be allowed for about an hour and a half (depending on temperature, APS quality, etc.). It is to be noted here that the softer the matrices, the longer time it will take to undergo polymerization.
The top coverslip is then removed very carefully and the coverslips with the gels are immediately immersed in 2 ml of 1× PBS in a 6-well plate, each of them being immersed in each of the wells. They are rinsed thrice with 2 ml of 1× PBS to remove the excess unpolymerized acrylamide.
3.3. Procedure to Attach Collagen
1× PBS is then removed from the 6-well plates. Using tweezers, these gel-coated coverslips are taken out of the 6-well plates and put in new, sterile 6-well plates, keeping the gel-coated side up.
Sulfo-SANPAH solution is prepared. 50 mg of the powder is dissolved in 50 ml 50 mM HEPES, pH = 8.5 buffer. This gives a concentration of 5×. This solution is then diluted 5× to 1× and then small volumes are aliquoted and frozen at −20°C. Frequent freeze-thawing of this solution is avoided and protected from light. Approximately 300 μl of the Sulfo-SANPAH solution (1×) is then added onto the gel surface preferably in the dark just enough to cover the gel surface on the coverslips. They are then exposed to 365 nm UV light (Spectroline, Westbury, NY) for 20 min until the color of Sulfo-SANPAH turns to rust brown. The phenylazide group of Sulfo-SANPAH, upon photoactivation at 365 nm, covalently attaches to the gel, leaving the succinimidyl ester free to react with amino groups of collagen or other proteins.
The PA gels are then rinsed with 50 mM HEPES, pH = 8.5 buffer thrice. These washes are preferably done in the dark.
Fresh collagen solution is prepared by diluting the stock collagen available from BD Biosciences in ice-cold 0.1 M acetic acid to a final concentration of 2 mg/ml. This solution is then diluted 10 times in ice-cold 50 mM HEPES, pH = 8.5 buffer, to yield a final concentration of 0.2 mg/ml.
1 ml of the collagen solution is added to cover the gel surface on the coverslips in each of the wells of the 6-well plate and kept on a rocker at 37°C overnight in dark. precipitation. Inucbations are also carried out at 4°C in dark when the stock collagen concentration is high (> 3.25mg/ml).
The next morning, the collagen-coated coverslips are rinsed with 1× PBS thrice, 5 min each time at room temperature in sterile conditions and subsequently transferred to a sterile 6-well plate.
1.5 ml of 1× PBS is added to each of these wells so as to cover the gel-coated coverslips and put in tissue culture hood for at least 90 min under UV illumination by a germicidal lamp with the lid upside-down next to the plate. Care should be taken about PBS not evaporating and leaving the gels dry.
3.4. Growing and Maintenance of the Human Mesenchymal Stem Cells and Plating of These Cells on the PA Gels
Human MSCs are grown in DMEM media (low glucose) supplemented with 10% FBS and 1% Penn/Strep at 37°C and 5% CO2.
The medium is changed every other day for conducting the cell on gel experiments.
At about 50–60% confluency, which is attained within 4–5 days of plating, the cells are ready to be split (see Note 5).
Cell culture media is aspirated out and the flask is washed with 1× PBS once.
These cells are then trypsinized using the Trypsin–EDTA and the flask is kept at 37°C incubator for 3–4 min.
The cell culture medium was added into the flasks and then the cells were pelleted by centrifugation at 5,000 rpm (1,500 g) for 5 min.
The medium is aspirated out and fresh medium is added and cell counting is done using the hemocytometer.
The cells are then split (1:4) for either replating in the flasks or on the gels (see Note 6).
For plating these MSCs on gels, ~2,000 cells are plated on each of the 25 mm circular coverslips coated with 11 kPa polyacrylamide (PA) gels (see Note 7).
The cells on gels are then cultured at 37°C and 5% CO2 for different time points ranging from 3 days to 2 weeks, depending on the experimental conditions.
3.5. Measuring the Young’s Elastic Modulus E by AFM
Amplifying the importance of good microscale measurements of elasticity are in vitro findings that even small microenvironmental variations – perhaps just 20–25% change in matrix stiffness – can have profound effects on the differentiation processes cited above as well as other cell functions. Since the Young’s elastic modulus E is highly sensitive to polymer mass and crosslinking but is also the key parameter in mimicking the in vivo muscle environment for optimal myogenesis, it is essential to precisely determine the surface mechanical properties of the PA gels by atomic force microscopy (AFM). Nowadays, there are many commercial AFMs available that are suited to measure the elasticity E of soft samples by recording force-indentation curves. Many of the instruments even posses an x–y scanner to raster the surface at high resolution but this is not mandatory to confirm the elasticity of a homogeneous sample such as the PA gels. However, for inhomogeneous samples such as native tissue or cells on gels, lateral elasticity maps can be obtained that can help to elucidate the micromechanics of these systems. Two types of probe geometries are especially suited to measure the micro-elasticity on the same length scale a cell experiences its environment, namely pyramidal tips (such as Veeco’s DNP cantilevers and the corresponding Olympus OMCL-TR 400 PSA) and cantilevers with spheres attached (e.g., PT.BORO.SN.5 from Novascan). Pyramidal shaped probes are very commonly used and therefore relatively cheap. Spherical probes are more difficult to produce and thus more expensive. It is essential that the spring constant K of the cantilevers is soft enough (ranging from 5 to 100 pN/nm) to measure elasticities of the order of 1–100 kPa. As sketched in Fig. 1a, the cantilever with the probe at its tip is indented into the sample and the deflection measured by the reflected laser light on a photodiode. The applied force F is the product of deflection d and the spring constant K of the cantilever. This way force-indentation curves can be recorded to measure the elasticity of the sample.
Fig. 1.
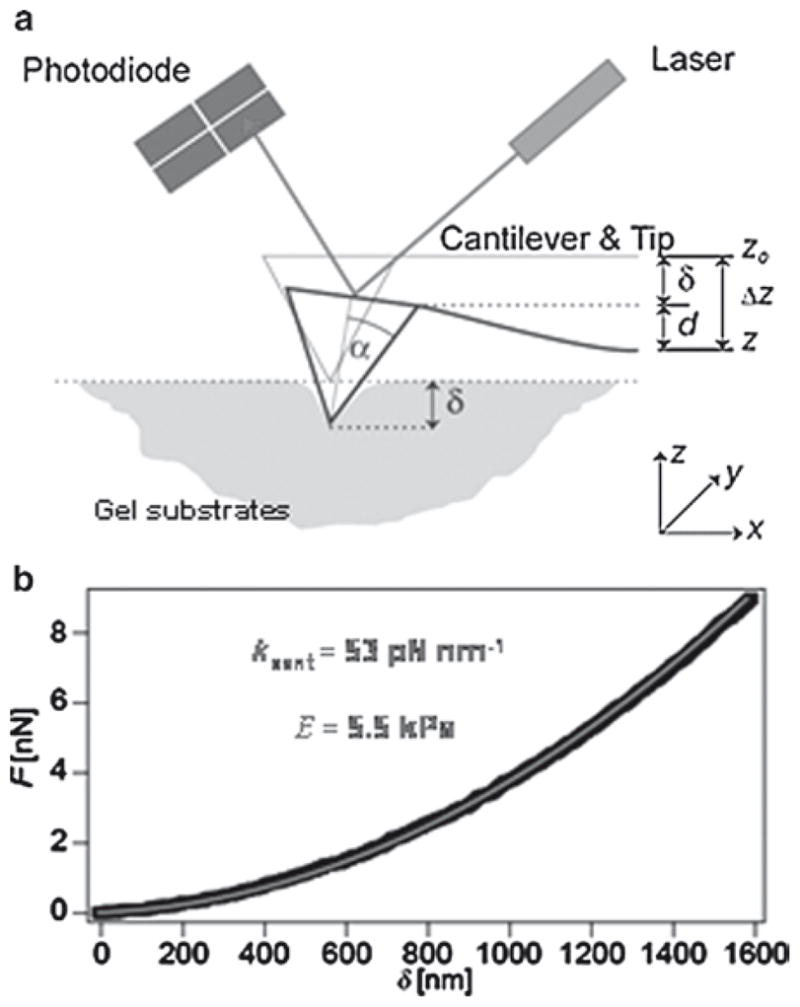
Measurement of the elasticity E by AFM (a) The cantilever with a pyramidal tip (opening angle, α) is pressed down (Δz) into the sample, leading to a certain indentation δ = z – d and causing the deflection d measured by the photodiode. (b) The Young’s modulus E is determined by analyzing the resulting force indentation curves with a modified Hertz model. Black open circles are data points and solid red line is the best fit in the deflection range from 10 to 100 nm
For a detailed protocol of how to conduct force-indentation experiments in contact mode, the reader is referred to the respective instructions of the AFM manufacturer. In the following, we note some generally important issues.
When setting up the AFM measurements, great care should be taken with the calibration of deflection sensitivity. Since the spring constant K of the cantilever stated by the manufacturer is only a nominal value, each cantilever should be calibrated before measurement. From our experience, using the thermal method (9) in air is the best way to obtain a reliable value of the cantilever stiffness.
After these initial steps, one should not forget to determine the deflection sensitivity in the liquid environment. The PA gels should be always measured and stored in PBS solutions to avoid problems due to changes in osmolarity. After mounting the sample, one should wait at least 10 min for thermal equilibration of the system. Then, force-indentation curves can be recorded.
Here, it is important to have a sufficiently long and flat baseline (at least 1–2 μm) while the cantilever is approaching the sample surface. The indentation velocity should not exceed 5 μm s−1 to avoid artifacts. After contact with the sample, the tip should be pressed into the sample to reach a deflection of at least 100 nm to obtain data that can be fitted well with a modified Hertz model (10–12). For best results, only the data in the deflection regime from 10 to 100 nm should be included in the fit as depicted in Fig. 1b.
The equation for the pyramidal geometry is:
where F = kd is the applied force, δ = z–d the indentation of the probe, ν Poisson’s ratio and α the opening angle of the pyramid (usually 35°).
For a spherical probe, the equation modifies to:
where R denotes the radius of the sphere.
In practice, neither the baseline deflection nor the contact point of the tip on the sample will be zero. Therefore, the following equation (for the pyramidal geometry) should be used to fit the Young’s modulus E together with contact point z0. Here, d0 is the average deflection value of the baseline.
For sufficient statistics, 10 force-indentation curves per location should be taken and at least ten different locations on the hydrogel should be probed. To confirm the mechanical properties of the PA gels, one extra test sample for AFM should be prepared with each experiment.
3.6. Immunofluorescence Quantitation of Protein Expression
After the desired time points of culturing the cells on gels, the culture media is aspirated out and discarded.
The cells on the gels are then rinsed gently twice with 1× PBS.
The cells are then fixed in 10% PFA in 1× PBS for 15 min under gently rocking conditions.
PFA is then discarded and subsequent washes of these fixed cells are carried out. The cells on gels are now washed twice with 1× PBS for 5 min each time under gentle rocking conditions.
0.5%-Triton-X 100 (solution in 1× PBS) is added to these cells to permeabilize these cells and then incubated for 15 min.
These cells are then rinsed twice with 1× PBS, 5 min each time.
3% BSA (solution in 1× PBS) is added to each of the samples in the 6-well plates for blocking and incubated under gentle rocking conditions for 1 h.
The blocking solution is then removed and the primary antibody solution, mouse monoclonal anti-MyoD1 (1:100 solution in 1% BSA in 1× PBS) (Sigma) or mouse monoclonal Pax7 antibody (DSHB) (1:200 solution in 1% BSA in 1× PBS), is added. It is then incubated for 2 h at room temperature.
After removing the primary antibody, washing step is performed with 1× PBS thrice, 5 min each wash.
The secondary antibody solution is added next. Alexa Fluor 488 conjugated donkey anti-mouse secondary antibody (1:500 solution in 1% BSA in 1× PBS) (Molecular Probes) is used and the cells are incubated for 1 h.
Rhodamine–Phalloidin solution (1:400) is added at the same time during incubation with the secondary antibody.
10 min before the incubation time is complete, DAPI is added to the wells for nuclear staining.
After 1 h of incubation, the samples are washed with 1× PBS thrice, 5 min each wash.
One wash is done with 0.5% Triton-X 100 solution in 1× PBS for 3 min.
Triton-X 100 is discarded and three more 1× PBS washes are carried out, 3 min each wash.
The last four washes are done with dH2O, 4 min each wash.
The edges of the coverslips are then dried using Kimwipes before they are ready to be mounted on the 45 × 50 mm square coverslips.
A drop of the mounting medium, gelmount is added on the middle of the square coverslip.
Care should be taken when the round coverslips are inverted and kept on the square coverslip with the gelmount in the middle. Bubbles should be avoided during this step to avoid problems during fluorescence microscopy.
Nail polish is added just around the mounted and inverted round coverslip for sealing the samples of interest.
These slides are now either stored in dark at 4°C or viewed immediately.
They are viewed using fluorescence microscopy. Excitation at 488 nm induces the MyoD or Pax7 fluorescence (green emission), 554 nm excites the fluorescence of rhodamine–phalloidin (red emission) and excitation at 364 nm excites the fluorescence of DAPI (blue emission).
Quantitative imaging (Fig. 2) is done by imaging samples under conditions of constant excitation and camera gain and all on the same day for at least 50 well-separated cells per sample. Focusing on the nucleus first standardizes the focal plane. Average intensity of cells is determined for cells immunostained with secondary antibody alone (I0), and this is subtracted from the mean intensity (I) of images that are also immunostained for MyoD. This intensity difference can then be normalized to intensities of day-1 cells or cells on other gels. Day-1 cells are a preferred normalization because cells tend to have similar shapes at day-1 and day-7, and additional studies suggest little to no difference in MyoD between day-0 and day-1 cells.
Fig. 2.
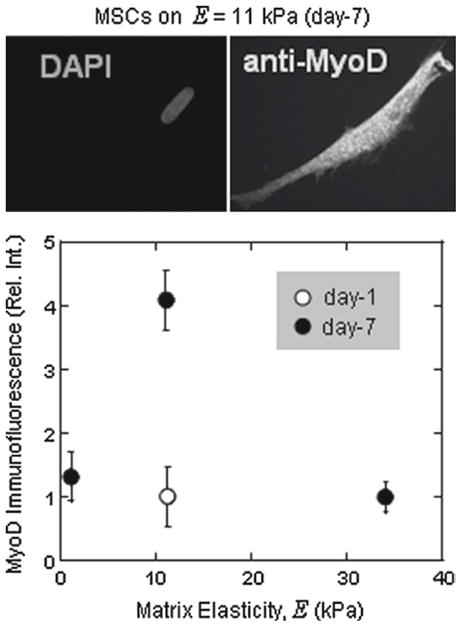
Indirect immunofluorescence of myogenic markers in human mesenchymal stem cells after plating them on 11 kPA polyacryalmide gels for 1-day or 7-days. MSCs on the myogenic matrices (11 kPA gels) were nuclear stained with DAPI to fix the focal plane and probed with the primary mouse MyoD antibody and the corresponding Alexa 488 conjugated donkey anti-mouse secondary antibody. The plot shows the relative intensity of MyoD as analyzed per the elasticity E
3.7. Transcript Profiling
A. RNA Isolation
The cells from either the tissue culture flasks or the PA gels are harvested.
The cell culture medium is aspirated first and then the cells are washed with 1× PBS.
PBS is aspirated and 0.05% trypsin-EDTA is added.
The cells are incubated for 3–4 min in the 37°C incubator.
Cell culture medium is then added to the 6-well plates or the tissue culture flask and shaken gently to enhance the cell detachment.
The cell culture medium with the trypsin–EDTA is then transferred to Falcon tubes and centrifuged at 5,000 rpm for 5 min.
The supernatant is aspirated and fresh cell culture medium is added and the cell counting is done using hemocytometer.
Another centrifugation step is carried out at 5,000 rpm for 5 min.
Care should be taken this time so that the supernatant is completely aspirated (see Note 8). The cell pellets are stored in Trizol at −20°C prior to lysis.
The cells are lysed by adding QIAzol Lysis Reagent (Qiagen). For the pelleted cells, the cell pellets are loosened by flicking the tube and then pipetted to mix to ensure no visible cell clumping.
The cells are then homogenized by vortexing for 1 min (see Note 9).
The tube containing the homogenate is kept at room temperature for 5 min. This step promotes dissociation of nucleoprotein complexes.
Chloroform (140 μl) is added to the tube containing the homogenate and capped securely. This tube is shaken vigorously for 15 s. Thorough mixing is important for subsequent phase separation.
This tube containing the homogenate is stored at room temperature for 2–3 min.
Then, centrifugation is done for 15 min at 12,000 × g at 4°C. After centrifugation, the sample separates into three phases: an upper, colorless, aqueous phase containing RNA; a white interphase; and a lower, red, organic phase.
The upper aqueous phase is transferred to a new collection tube (supplied from Qiagen). 1.5 volumes (~525 μl) of 100% ethanol is added and mixed thoroughly by pipetting up and down several times. A precipitate may form after addition of ethanol, but this will not affect the procedure.
Immediately after this step, 700 μl of the sample is pipetted, including any precipitate that may have formed into an RNeasy Mini spin column in a 2 ml collection tube (Qiagen). The lid is closed gently and centrifuged at 10,000 rpm for 15 s at room temperature. The flow-through is discarded at this step.
This step is repeated using the remainder of the sample and the flow-through is again discarded.
500 μl of Buffer RPE (Qiagen) is added onto the RNeasy Mini spin column. The lid is closed gently and centrifuged for 15 s at 10,000 rpm to wash the column and the flow through is discarded.
500 μl Buffer RPE is again added onto the RNeasy Mini spin column and the same step is repeated.
The RNeasy Mini spin column is transferred to a new 1.5 ml collection tube (Qiagen; and see Note 10). 50 μl RNase-free water is pipetted directly onto the RNeasy Mini spin column membrane. The lid is closed gently and centrifuged for 1 min at 10,000 rpm to elute the RNA (see Note 11).
B. RNA Amplification
This procedure is carried out according to the manufacturer’s protocol using the WT-Ovation Pico RNA Amplification System (NuGEN Technologies Inc.) followed by the WT Exon Module (NuGEN Technologies Inc.). Briefly the steps are mentioned below.
First Strand cDNA Synthesis is done using the first strand reagents supplied in the kit. The first strand master mix is first prepared as described in the protocol.
Second Strand cDNA Synthesis is done using the second strand reagents supplied in the kit. The second strand master mix is then prepared.
Purification of the double-stranded DNA is carried out next using the RNA Clean beads supplied in the kit.
SPIA amplification is carried out with the supplied SPIA amplification reagents.
Amplified SPIA cDNA is purified at the last step using nuclease-free water provided with the kit.
Generation of ST-cDNA (sense-target) is performed by making a ST-cDNA Master mix solution as described in the protocol from the supplied Exon Module reagents.
C. RNA Labelling and Fragmentation
This procedure is also carried out according to the manufacturer’s protocol using the FL-Ovation cDNA Biotin Module V2 (NuGEN Technologies Inc.).
Fragmentation of the SPIA cDNA is carried out with the supplied reagents first.
Biotin labeling of SPIA cDNA is done by first making the labeled master mixes as described in the protocol and then mixing the labeling master mixes with the fragmented cDNAs.
The fragmented and labeled cDNA is either stored at −20°C or prepared for gene chip array hybridization.
D. Microarray
The array is done with a Affymetrix Human Gene 1.0ST (Affymetrix) chip. It is known as the GeneChip Human Gene 1.0 ST Array. The hybridization, washing, staining and scanning of the chip is carried out following the protocols as described by the manufacturer.
Acknowledgments
Support of NIH NIAMS, NHLBI, NSF (DED), Association Francaise Contre Les Myopathies, France (TC), and the Humboldt Fdn. (FR) are gratefully acknowledged.
Footnotes
The concentrations of the PA solutions should be consistent for the series of experiments. Longer storage (>3 months) of the PA stock solutions is not recommended due to degradation effects that can significantly influence the resulting gel elasticity, E.
All solutions used to prepare the PA gels should be sterile filtered. Freshly prepared solutions are always recommended. Otherwise, contamination is very likely to occur when cells are plated on these gels and incubated in the 37°C cell culture incubator.
APTES and CMS should always be applied to the coverslips in the fume hood as these chemicals are highly toxic and corrosive.
Extreme care should be taken while wiping the edges of the coverslips or during transferring from one plate to another with tweezers as touching of the gel surface may lead to contamination of cells on the gels when plated and incubated.
Care should however be taken that these cells do not touch each other in the cell culture flasks. About 50–60% confluency is ideal for these cell types to be trypsinized and replated or split. This is attained within 4–5 days of plating.
The number of passages given to these cell types is also a critical factor for studying the myogenic lineage of these cells when plated on PA gels. A maximum of 10 passages is generally recommended.
These cells are grown on 11 kPa gels for different time points of interest to determine the expression of specific myogenic markers like MyoD, Pax7, etc.
Incomplete removal of cell-culture medium during RNA extraction will inhibit lysis and dilute the lysate, affecting the conditions for binding of RNA to the RNeasy Mini spin column membrane. Both effects may reduce RNA yield. Incomplete loosening of the cell pellet during RNA isolation may lead to inefficient lysis and reduced RNA yields.
Incomplete homogenization during RNA isolation from the cell pellets may lead to significantly reduced RNA yields and can cause clogging of the RNeasy Mini spin column.
During the final step of addition of RPE buffer, following centrifugation, the RNeasy Mini spin column should be removed from the collection tube carefully so that the column does not contact the flow-through. Otherwise, carryover of ethanol may occur.
If the expected RNA yield is >30 μg, the last step of the RNA isolation should be repeated with a second volume of 50 μl RNase-free water and eluted into the same collection tube. To obtain a higher total RNA concentration, this second elution step may be performed by using the first eluate. The yield will be 15–30% less than the yield obtained using a second volume of RNase-free water, but the final concentration will be higher.
References
- 1.Gefen A, Margulies SS. Are in vivo and in situ brain tissues mechanically similar? J Biomech. 2004;37:1339–1352. doi: 10.1016/j.jbiomech.2003.12.032. [DOI] [PubMed] [Google Scholar]
- 2.Engler AJ, Griffin MA, Sen S, Bonnemann CG, Sweeney HL, Discher DE. Myotubes differentiate optimally on substrates with tissue-like stiffness: pathological implications for soft or stiff microenvironments. J Cell Biol. 2004;166:877–887. doi: 10.1083/jcb.200405004. [DOI] [PMC free article] [PubMed] [Google Scholar]
- 3.Diridollou S, Patat F, Gens F, Vaillant L, Black D, Lagarde JM, Gall Y, Berson M. In vivo model of the mechanical properties of the human skin under suction. Skin Res Technol. 2000;6:214–221. doi: 10.1034/j.1600-0846.2000.006004214.x. [DOI] [PubMed] [Google Scholar]
- 4.Engler A, Bacakova L, Newman C, Hategan A, Griffin M, Discher D. Substrate compliance versus ligand density in cell on gel responses. Biophys J. 2004;86:617–628. doi: 10.1016/S0006-3495(04)74140-5. [DOI] [PMC free article] [PubMed] [Google Scholar]
- 5.Rajagopalan P, Marganski WA, Brown XQ, Wong JY. Direct comparison of the spread area, contractility, and migration of balb/c 3T3 fibroblasts adhered to fibronectin- and RGD-modified substrata. Biophys J. 2004;87:2818–2827. doi: 10.1529/biophysj.103.037218. [DOI] [PMC free article] [PubMed] [Google Scholar]
- 6.Buckley IK, Porter KR. Cytoplasmic fibrils in living cultured cells. A light and electron microscope study. Protoplasma. 1967;64:349–380. doi: 10.1007/BF01666538. [DOI] [PubMed] [Google Scholar]
- 7.Pelham RJ, Wang Y-L. Cell locomotion and focal adhesions are regulated by substrate flexibility. Proc Natl Acad Sci USA. 1997;94:13661–13665. doi: 10.1073/pnas.94.25.13661. [DOI] [PMC free article] [PubMed] [Google Scholar]
- 8.Engler AJ, Sen S, Sweeney HL, Discher DE. Matrix elasticity directs stem cell lineage specification. Cell. 2006;126:677–689. doi: 10.1016/j.cell.2006.06.044. [DOI] [PubMed] [Google Scholar]
- 9.Hutter JL, Bechhoefer J. Calibration of atomic-force microscope tips. Rev Sci Instrum. 1993;64:1868–1873. [Google Scholar]
- 10.Hertz H. Ueber die Berührung fester elastischer Körper. J für die reine und ange-wandte Mathematik. 1881;92:156–171. [Google Scholar]
- 11.Radmacher M. Atomic force microscopy in cell biology. 2002;68:67–90. doi: 10.1016/s0091-679x(02)68005-7. [DOI] [PubMed] [Google Scholar]
- 12.Dimitriadis EK, Horkay F, Maresca J, Kachar B, Chadwick RS. Determination of elastic moduli of thin layers of soft material using the atomic force microscope. Biophys J. 2002;82:2798–2810. doi: 10.1016/S0006-3495(02)75620-8. [DOI] [PMC free article] [PubMed] [Google Scholar]