Abstract
BACKGROUND
The fifth leading cause of cancer deaths among women is ovarian cancer (OC), which originates primarily in the ovarian surface epithelium (OSE) that surrounds the ovary. Permanent removal of the OSE could provide a novel strategy to substantially reduce OC risk, while retaining the benefits of ovarian function, including gameto- and steroidogenesis. It must be determined whether ovarian surface epitheliectomy (OSEx) carries deleterious side effects, including loss of menstrual cyclicity, infertility or scarring (e.g. adhesions), prior to any clinical application of this strategy. To achieve this, we selected the non-human primate, rhesus macaque, for long-term (12 month) studies on the effects of OSEx.
METHODS
Rhesus macaque females underwent OSEx by detergent treatment and were then monitored for menstrual cyclicity (menstruation, steroidogenesis and follicle development) and adverse side effects (tissue scarring or adhesions). Ovaries were collected at 6 or 12 months and examined for evidence of tissue damage, follicle rupture and regression of the corpus luteum. The ovarian surface was examined immunohistologically for signs of epithelial replacement, using markers for OSE and fimbrial epithelium (FE), a possible alternative source of pelvic tumors diagnosed as OC.
RESULTS
After OSEx, menstrual cycle length, estrogen and progesterone production, follicle rupture and luteal regression appeared normal. No evidence of adhesions was seen. At 6 and 12 months post-OSEx, the ovarian surface was sparsely populated by cells expressing OSE and FE markers. Proliferative activity in this population was notably low.
CONCLUSIONS
OSEx may provide a novel method to reduce the risk of OC, without sacrificing ovarian function, although the effects on fertility remain to be tested. The absence of epithelial replacement via enhanced proliferation suggests OSEx does not increase malignant potential. Complete and permanent OSEx may be feasible.
Keywords: ovarian surface epithelium, fimbrial epithelium, epitheliectomy, ovarian function, ovarian cancer
Introduction
The ovarian surface epithelium (OSE) is a monolayer of cells surrounding the ovary that has no established role in women, yet has a well-defined pathology. Ovarian cancer (OC) originates primarily in the OSE and is the most lethal gynecological cancer and fifth leading cause of cancer deaths among women in the USA and Europe (Jemal et al., 2009). The OSE is continuous with the peritoneal mesothelium and closely related to adjacent epithelia of the reproductive tract (Auersperg et al., 2001, 2008), including the fimbrial epithelium (FE). This is significant from the perspective of the OSE, since it is extraovarian in origin (Barber, 1988; Auersperg et al., 2001) and not known to be replenished by stroma of the ovary.
In non-primates, roles have been attributed to the OSE that include protecting the ovary from adhesions and permitting ovulation (Gillett et al., 1994; Colgin and Murdoch, 1997). Non-primate OSE cells undergo apoptotic clearance prior to ovulation (Murdoch and McDonnel, 2002; Murdoch and Martinchick, 2004), followed by proliferative repair in a ‘scar-free’ healing process after ovulation (Osterholzer et al., 1985; Fegan et al., 2008). Primate and non-primate OSE cells may be steroidogenic and steroid responsive (Brandenberger et al., 1998; Bai et al., 2000; Okamura et al., 2003; Wright et al., 2005), anti-inflammatory (Gubbay et al., 2004; Rae et al., 2009) and may include cancer-initiating stem-like cells (Bowen et al., 2009). In addition, they have the potential for epithelial/mesenchymal transition that can be regulated by matrix, stromal or soluble factors (Auersperg et al., 2001; Ahmed et al., 2007; Zhu et al., 2010). Whether each of these in vitro attributes describes the human OSE in vivo is difficult to determine, for practical and ethical reasons; however, non-human primates such as the female rhesus macaque, may be an effective model to identify unique properties of the primate OSE, owing to genetic and reproductive similarities with women (not shared among non-primates), as well as reports of benign and malignant ovarian adenocarcinomas in non-human primates, including the rhesus macaque (Moore et al., 2003).
We have reported differences between the primate and non-primate OSE, particularly that the primate OSE is not required for ovulation, and short-term (6 weeks) elimination of the OSE does not cause adhesions (Wright et al., 2010). The absence of a defined role for the primate OSE and the lack of deleterious short-term side effects from its removal raise the possibility that ovarian surface epitheliectomy (OSEx) is a novel strategy to reduce the risk of OC substantially, by eliminating its primary source, without sacrificing reproductive potential or the benefits of ovarian steroidogenesis. But OSEx could have significant long-term risks, most notably loss of menstrual cyclicity, infertility, scarring (adhesions) and elevated cancer risk, if incomplete OSEx were to leave behind highly proliferative stem-like OSE cells.
An additional consideration of the clinical value of OSEx is defining the most appropriate candidates for this preventive strategy. In the current form, OSEx as a surgical intervention is impractical as a routine procedure for the general population. Post-menopausal women would likely benefit more from bilateral salpingo-oophorectomy, to eliminate all sources of OC, including inclusion cysts and regions of the FE that may be inaccessible to detergent treatment. However, women with a family history of breast and/or OC, particularly with BRCA1 defects, may have a 40–67% lifetime risk of developing OC (Metcalfe et al., 2010). For these women, OSEx during reproductive years may be promising.
Here we extend our investigation to the long-term effects of complete OSEx, by removing the OSE from rhesus macaque ovaries, monitoring menstrual cyclicity and ovarian function, and collecting ovaries for histological examination at 6 and 12 months. No interruption of menstrual cyclicity, steroidogenesis or follicle development was observed, nor were adhesions present on or around the ovaries. Upon tissue collection no clear ovarian defect was seen, aside from the presence of an incomplete replacement epithelium (rOSE). The density of rOSE was only 33% of normal OSE by 12 months, and rOSE did not display proliferation rates above that of normal, intact OSE. We propose the source of rOSE was either residual OSE that escaped detergent treatment, near the site of fimbria attachment to the ovary, or FE cells migrating onto the ovarian surface from the fimbria/ovary junction. The latter possibility is supported by our observations of similarities in gene expression between OSE and FE and transitional cell types at the fimbria/ovary junction, which suggest that FE-to-OSE conversion is possible. The absence of a proliferative response greater than that of normal OSE suggests ovarian cues suppress proliferation, although it is clear that proliferation can be induced by mechanical abrasion of the ovarian surface for at least several days (Wright et al., 2008); likewise, we observed elevated DNA repair proteins in rOSE, compared with FE, suggesting that additional ovarian cues promote DNA repair potential within the OSE. The lack of disruption of ovarian function indicates OSEx could provide risk reduction for OC.
Materials and Methods
Animal care, monitoring and procedures
Female rhesus macaques (Macaca mulatta) were under the care of the Division of Animal Resources (DAR) at the Oregon National Primate Research Center (ONPRC), on the West Campus of the Oregon Health & Science University (OHSU). Protocols were approved by the ONPRC/OHSU Institutional Animal Care and Use Committee. Surgical procedures and post-operative care and monitoring were conducted by DAR veterinary and support staff.
Female monkeys (n = 3) were selected after establishing that they exhibited normal menstrual cyclicity, by daily inspection for menses and daily-to-weekly serum assays for estradiol and progesterone (E and P). Steroid hormone assays were conducted using an IMMULITE 2000 (Seimens Medical Solutions, Malvern, PA, USA) in the ONPRC Endocrine Technology and Support Core (Young et al., 2003). Anesthetized females underwent bilateral OSEx using mild detergent and gentle abrasion as described previously (Wright et al., 2010); briefly, ovaries were bathed in 1% SDS in sterile saline for 5 min with gentle abrasion, during laparotomy and ovaries were rinsed liberally to remove residual detergent. Females continued to be monitored for menstrual cyclicity and periodic ultrasounds were performed as described (Bishop et al., 2009), to visualize follicle development and detect potential scarring or adhesions.
One ovary and 1 cm of associated fimbria and ligament were collected as a single piece of tissue from each anesthetized female via laparoscopy at 6 and 12 months following OSEx. At 6 months, tissue was collected within 3 days of menses; at 12 months, each sample was collected on different days of the cycle: during the pre-ovulatory estrogen surge, just after ovulation and during the midluteal phase. Samples were placed in fixative for subsequent paraffin embedding, sectioning and analysis, as described previously (Wright et al., 2010).
Histology, immunohistochemistry and analysis
Prior to sectioning, whole ovaries were examined grossly for evidence of defects, including scarring, adhesions, cyst formation and abnormal follicle rupture or luteal regression. Tissue sections were stained with Hematoxylin and Eosin (H&E) or labeled with one of several antibodies (IHC) using protocols previously reported (Wright et al., 2008, 2010). Tissue sections previously prepared from untreated ovaries (Wright et al., 2011) were used as control tissue.
OSE and FE cells were investigated for the following parameters: morphology, lateral density, distribution around the ovarian surface and expression of defined immunomarkers. Cells were termed Type 1, 2, 3 or 4 on the basis of height, with Type 1 <2.5 µm, Type 2 from 2.5 to 7.5 µm, Type 3 over 7.5–12.5 µm and Type 4 >12.5 µm. Antibodies used were against keratin, estrogen receptor-alpha (ER-α) and progesterone receptor (PR; DAKO Corp.; Carpinteria, CA, USA), E- and N-Cadherin (BD Transduction Laboratories; San Jose, CA, USA), P-Cadherin (Sigma-Aldrich; St Louis, MO, USA), OB-Cadherin (Invitrogen; Carlsbad, CA, USA), PCNA and phospho-histone 3 (Chemicon International; Temecula, CA, USA), phospho-Retinoblastoma, p21 (Cell Signaling Technology, Inc; Danvars, MA, USA), Ki-67 (BioGenex; San Ramon, CA, USA), oviduct-specific glycoprotein (OVGP1; Abcam; Cambridge, MA, USA) and FANCD2 (Novus Biologicals; Littleton, CO, USA). Phosphatase-conjugated secondary antibodies and colorimetric reagents were from Kirkegaard & Perry Laboratories (Gaithersburg, MD, USA).
Tissue sections (n≥ 3 for each ovary for each antigen) were examined at 100–960× magnification using an Olympus IX71 inverted microscope (Olympus; Center Valley, PA, USA). Each section was scored either with a single value (e.g. percentage of ovarian surface positive for antigen), or using multiple values compiled from fields of view (FOV) 250–2000 µm in length, to evaluate spatial distributions within each sample (e.g. in relation to the fimbria/ovary junction).
Statistical analysis
Differences between OSE, rOSE and FE were analyzed by Student's t-tests, using Microsoft Excel 2008 (Microsoft; Redmond, WA, USA) and iWork Numbers ’09 (Apple; Cupertino, CA, USA).
Results
Maintenance of ovarian cyclicity after OSEx
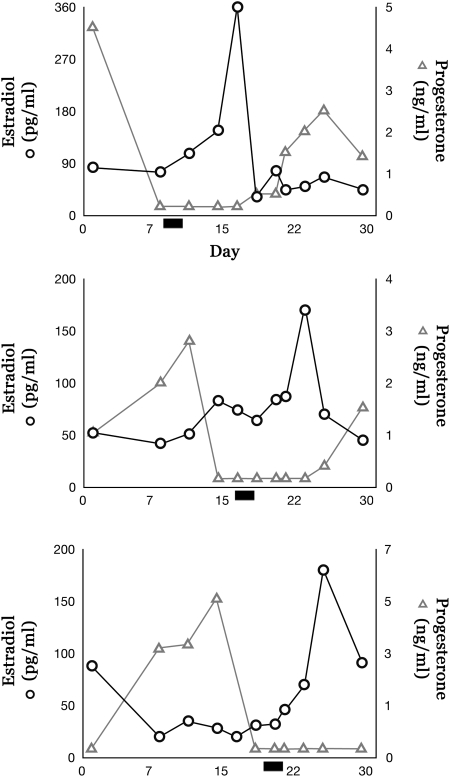
Throughout the 12-month interval following OSEx, no adverse side effects from surgery or OSEx were observed, and normal menstrual cyclicity was maintained. The mean interval between menses was 27.5 ± 1.8 days for all females throughout the 12-month interval. E and P levels were comparable to reported values in spontaneous menstrual cycles (Zelinski-Wooten et al., 1998; Hazzard et al., 2002); ultrasound detected normal follicle growth and corpus luteum development, and no evidence of adhesions; and ovaries appeared grossly normal during laparoscopic inspection at 6 and 12 months. During the 29 days leading to the second ovariectomy for each female, menses reports and serum levels of E and P (Fig. 1), as well as ovarian histology, demonstrated follicular and luteal phase intervals within normal ranges for rhesus females. Gross ovarian histology showed characteristic hallmarks of a dominant follicle, rupture site or corpus luteum typical for the menstrual phase at which they were collected.
Figure 1.
Estrogen and progesterone cyclicity in the non-human primate after OSEx. Data show E and P levels for each female during the 29 days preceding the final ovariectomy at 12 months. Bar indicates the first day of menses.
Density and type of normal OSE, replacement OSE and FE
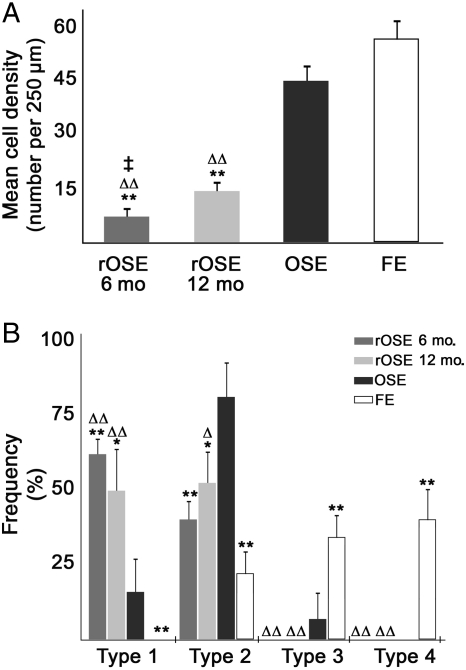
We previously demonstrated that OSEx using mild detergent successfully eliminated the OSE for 6 weeks, the longest interval examined (Wright et al., 2010). In the current study, cell repopulation of the ovarian surface was evident in the 6–12 months following OSEx, with ∼15 and 33% of the surface being occupied by surface cells resembling OSE, albeit much more sparsely distributed than normal OSE. Analysis of cell density (Fig. 2A) revealed that the lateral density of normal OSE and FE were not significantly different; however, each of these was significantly (P < 0.01) higher than replacement OSE (rOSE) density at 6 and 12 months after OSEx, and rOSE density at 6 months was significantly (P < 0.03) lower than at 12 months. Cell morphology differed among OSE, rOSE and FE (Fig. 2B), with a significant shift from populations dominated by Type 2 in OSE, toward Types 1 and 2 in rOSE while Types 3 and 4 were predominant in FE. The differences were most evident in comparing rOSE and FE, while OSE appeared somewhat intermediate between the two groups. Overall, rOSE at 6 and 12 months were statistically indistinguishable on the basis of morphological Type.
Figure 2.
Analysis of cell types seen in normal ovarian surface epithelium (OSE), replacement OSE (rOSE) and fimbrial epithelium (FE). (A) Mean cell density of each population, expressed as cells per 250 µm. (B) Frequency of each type in each population. Differences between OSE and rOSE or FE are denoted by * and **, indicating P < 0.05 and P < 0.01, respectively; ▵ and ▵▵ denote differences (P < 0.05 and P < 0.01, respectively) between rOSE and FE. ‡ denotes P < 0.03 between 6- and 12-month rOSE. Error bars are the standard error of the mean.
Marker expression in OSE, rOSE and FE
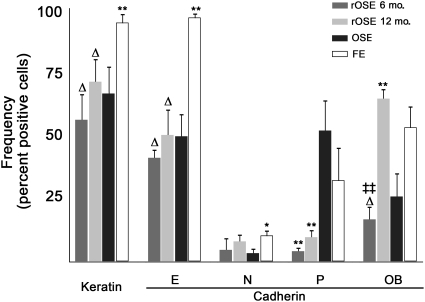
Selected markers that label the OSE were used to compare these epithelial populations (Fig. 3). The percentage of cells staining positive for keratin, E-cadherin and N-cadherin were similar in OSE and rOSE. P-cadherin-positive cells were significantly (P < 0.01) fewer in rOSE compared with OSE. In contrast, more OB-cadherin-positive cells were detected in 12-month rOSE as compared with 6-month rOSE or OSE (P < 0.01). FE cells expressed keratin and E-cadherin in a significantly (P < 0.01) higher percentage of cells than did OSE or rOSE, and N-cadherin was seen in a significantly (P < 0.05) higher percentage of FE cells than OSE cells. OB-cadherin was also expressed in a higher (P < 0.05) percentage of FE cells than 6-month rOSE cells, but not 12-month rOSE cells.
Figure 3.
Frequency of immuno-positive cells stained for keratin or cadherin isoforms. Estimated percentage of cells that express each marker. * and ** denote P < 0.05 and P < 0.01 in relation to OSE; ▵ denotes P < 0.05 in relation to FE; ‡‡ denotes P < 0.01 in relation to rOSE from 6- versus 12-month OSEx ovaries. Errors bars are the standard error of the mean.
Ovarian surface cell density 6 and 12 months after OSEx in relation to the fimbria
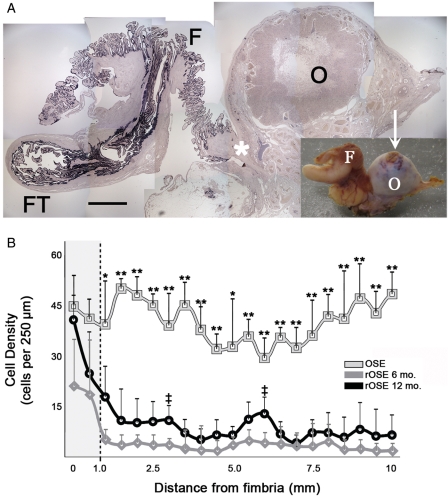
rOSE cells were not uniformly distributed over the ovarian surface. Keratin (Fig. 4A) and other markers showed a gradient in cell density, highest within the FE, intermediate at the site of fimbria attachment to the ovary, and lowest on the ovarian surface. In all regions of the ovary, rOSE cells were significantly less dense than FE and normal OSE, except near the fimbria/ovary junction, where the density of rOSE was comparable to normal OSE (Fig. 4B). Within 1 mm of the fimbria/ovary junction, the density of 6-month rOSE was significantly (P < 0.05) lower than normal OSE, while 12-month rOSE was not (P = 0.12). Beyond 1 mm, 6- and 12-month rOSE were consistently less dense than normal OSE, but were similar to each other at each sampled distance. Considering all sampled distances together, rOSE density was significantly (P < 0.01) higher nearest the fimbria, at 6- and 12-months. Near the fimbria, no difference (P = 0.14) was seen between 6- and 12-months; however, beyond 1 mm from the fimbria, 6-month rOSE density was significantly (P < 0.01) lower than 12-month rOSE. Despite the presence of at least some rOSE cells around the entire ovarian surface, in areas farther than 1 mm from the fimbria an ovarian surface devoid of cells was frequently seen (shown in Fig. 5B). No gradient was observed in relation to the site of follicle rupture.
Figure 4.
Distribution of surface epithelial cells on the ovary in relation to the fimbria/ovary junction. (A) Photomontage of a section from one tissue sample, containing Fallopian tube (FT), fimbria (F) and the ovary (O), labeled with an anti-keratin antibody. Inset shows the tissue sample prior to sectioning. Arrow indicates a recent site of ovulation, resembling a typical post-ovulatory corpus luteum; scale bar = 2.5 and 10 mm for the montage and inset, respectively; asterisk marks the fimbria/ovary junction. (B) Mean cell density as a function of distance from the fimbria/ovary junction for OSE and rOSE. Shaded region highlights results nearest the fimbria/ovary junction; dashed line marks the distance of 1 mm from the junction. Error bars represent the standard error; * and ** denote P < 0.05 and P < 0.01, respectively, between OSE and rOSE; ‡ denotes P < 0.05 between 6- and 12-month rOSE.
Figure 5.
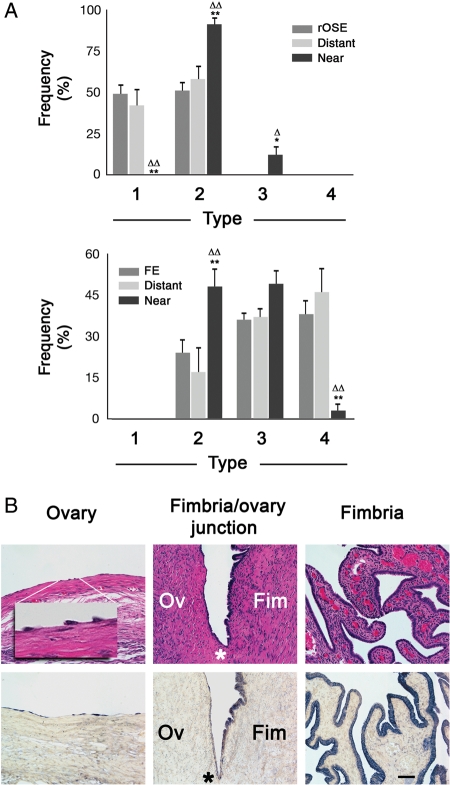
Distribution of rOSE and FE morphological types in relation to the fimbria/ovary junction. (A) Frequency distribution of rOSE (upper) and FE (lower) morphological types, segregated on the basis of distance from the junction. ‘rOSE’ and ‘FE’ refer to the frequency distribution of types among the rOSE or FE in general; ‘distant’ represents the distribution of types ≥1 mm from the junction, ‘near’ represents types within 250 µm of the junction. * and ** denote P < 0.05 and p < 0.01 between the indicated column and the general population of rOSE or FE. ▵ and ▵▵ denote P < 0.05 and P < 0.01 between the indicated column and ‘distant’ rOSE or FE. Errors bars are the standard error of the mean. (B) H&E (upper) and keratin (lower) staining of a tissue section that contains the fimbria/ovary junction. Left panels show the ovarian surface ≥1 mm from the junction; inset is a higher magnification of the indicated region. Center panels show the fimbria/ovary junction, marked with an asterisk; the ovary (Ov) is to the left, the fimbria (Fim) are to the right. Right panels show the fimbria ≥1 mm from the fimbria/ovary junction. Scale bar = 50 and 10 µm in the main panels and inset, respectively.
Morphological types of rOSE and FE in relation to the fimbria/ovary junction
Examining the distribution of rOSE morphological types on the basis of proximity to the fimbria/ovary junction (near; within 250 µm, versus distant; ≥1 mm from the junction), showed significant differences (Fig. 5A and B). Within 250 µm, rOSE cells were predominantly (91.6 ± 6.7%) Type 2, but at a distance of ≥1 mm, only 52.0 ± 19.8% were Type 2, with the remainder being Type 1. FE cells also showed a transition in morphological frequencies, being predominantly Type 2–3 within 250 µm of the fimbria/ovary junction, but Type 3–4 at ≥1 mm from the junction.
The oviduct-specific marker OVGP1, ER-α and PR are expressed by OSE, rOSE and FE
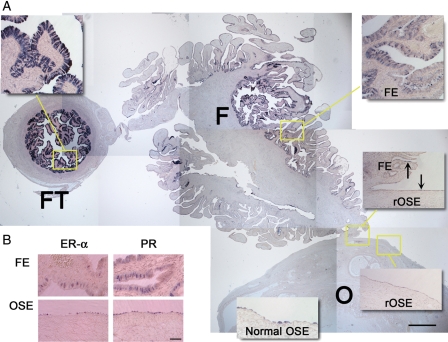
In order to selectively compare rOSE to OSE or FE, we labeled sections with an antibody against OVGP1 (Fig. 6A). Unexpectedly, this antigen was detected in the Fallopian tube (FT), FE, rOSE and OSE. Although the percentage of labeled cells in each group was comparable, the intensity of staining suggested higher levels of expression in the FT and in FE closer to the FT versus ovary. Near the fimbria/ovary junction, staining intensities between rOSE, OSE and FE were qualitatively similar; consequently, OVGP1 was unable to distinguish among these populations. Labeling sections with antibodies against ER-α or PR was similarly not effective at distinguishing between rOSE, OSE and FE (Fig. 6B).
Figure 6.
OVGP1, ER-α and PR expression in rOSE and FE. (A) Photomontage of a section labeled for OVGP1 protein, showing the Fallopian tube (FT), fimbria (F) and ovary (O). Insets are higher magnification images of the indicated regions, except the normal OSE panel which is from an untreated ovary. Scale bar = 500 and 100 µm in the montage and insets, respectively. Arrows highlight OVGP1-positive cells near the fimbria/ovary junction. (B) Immunohistochemistry showing ER-α and PR expression in the fimbria and OSE. Scale bar = 50 µm.
Proliferation, cell cycle arrest and DNA repair potential in OSE, rOSE and FE
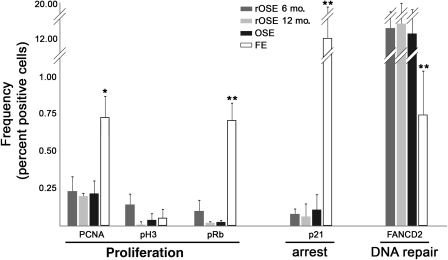
Sections probed and analyzed with antibodies against PCNA, pRb, p21 and FANCD2 showed differences in staining between OSE and FE populations, but not OSE and rOSE (Fig. 7). Markers of proliferative potential and mitosis revealed no significant differences in frequency between OSE and rOSE; however, PCNA and pRb were significantly (P < 0.05 and P < 0.01, respectively) more frequently detected in FE versus OSE and rOSE. A fourth indicator of proliferation, Ki-67 (not shown), which is expressed during all phases of the cell cycle, but not G0, was detected in OSE, rOSE and FE (0.19 ± 0.21, 0.87 ± 0.41 and 1.30 ± 0.67%, respectively). This was significantly (P < 0.05) lower in OSE, but not significantly different (P = 0.25) between rOSE and FE. As with PCNA and pRb, p21 was similar in rOSE and OSE, but was significantly (P < 0.01) more frequent in FE. In contrast, a significantly (P < 0.01) lower percentage of FE cells were positive for FANCD2, compared with OSE and rOSE.
Figure 7.
Proliferation, cell cycle arrest and DNA repair potential in the OSE, rOSE and FE. Graph shows the estimated percentage of each population expressing each antigen. ** denotes P < 0.01 in comparing FE to OSE or rOSE. Error bars are the standard error of the mean.
Discussion
By 6 and 12 months after OSEx in the non-human primate, the ovarian surface was only sparsely populated by epithelial-like cells. The density of the replacement epithelium was only 15 and 33% of normal OSE density at 6 and 12 months, respectively. The absence of a proliferative response by the surface cells generally no greater than that seen in normal, intact OSE appears to account for the slow rate of repopulation. The observed rate of repopulation, which loosely suggests a 6-month doubling time, based on the 6- and 12-month data, indicates complete restoration of the surface epithelium could require several years. Nevertheless, the absence of typical OSE characteristic of the naive ovary did not affect cyclic ovarian function, including the patterns and levels of circulating E and P in the follicular and luteal phase, nor timely follicle rupture and luteal regression. Furthermore, OSEx did not result in the formation of adhesions on the ovarian surface.
The identity of rOSE cells was not definitively established. They may have origins in one or more of the following locations. (i) OSE near the fimbria/ovary junction may have escaped OSEx, despite the thoroughness of treatment. It is unlikely that residual OSE persisted elsewhere, based on our previous study demonstrating complete absence of OSE markers on the ovarian surface 6 weeks after OSEx [the fimbria/ovary junction was not examined (Wright et al., 2010)]; in addition, no cortical invaginations were seen that retained OSE after treatment. (ii) Alternatively, rOSE may represent FE migrating onto the ovarian surface. Distinguishing between rOSE and FE at the fimbria/ovary junction was not possible with the markers employed in this study, including OVGP1 that was expected to be FE-specific (Buhi, 2002; Woo et al., 2004), nor on the basis of morphology, due to the transitional nature of epithelial cells at the junction. (iii) rOSE could originate from other ovarian cell types (such as stroma or luteal cells released during follicle rupture), or from extraovarian sources (including the peritoneal mesothelium and/or abdominal fluid).
Defining the origin of rOSE is important for evaluating OSEx as a viable strategy to eliminate the source of most OCs in women. For example, if rOSE cells are derived from residual OSE, then modifications to OSEx to more effectively include the fimbria/ovary junction would eliminate repopulation of the ovarian surface. However, even the current strategy of OSEx could reduce OC risk by the simple act of reducing the number of potentially tumorigenic cells, at least temporarily. Estimating the effectiveness of transient OSEx must take into account the rate of rOSE return and the tumorigenicity of these cells. The rate of return may be reduced if alternative approaches more effectively eliminate OSE cells; however, the tumorigenicity of rOSE cells is difficult to predict. rOSE cells derived from OSE may have tumorigenicity shaped by the quality of the founder population, and chance could dictate whether they have a higher or lower predilection for transformation. The effectiveness of protection will probably be greatest if OSEx can be permanent.
If rOSE cells originate from the FE, this raises questions about the basic identity of FE and OSE. We identified a number of differences between them, but their common features; i.e. developmental origins and similarities in gene expression, including OVGP1, suggest these could be labile differences. This is supported by the transitional characteristics of rOSE and FE at the fimbria/ovary junction. FE-to-OSE conversion may be a natural consequence of differences in local cues between fimbrial and ovarian surfaces, and could reflect a related but opposite capacity of the OSE: mesenchymal-to-epithelial transition (Okamoto et al., 2009). This conversion to a Müllerian morphology resembling FE is a stereotypic early, preneoplastic event seen in inclusion cysts and cortical invaginations (Ahmed et al., 2007). A complementary epithelial-to-mesenchymal transitional potential in the adjacent FE may exist, and would be consistent with the transitional morphology seen at the fimbria/ovary junction. OSE–FE interconversion may have tremendous significance to our understanding of OC and its etiology. Even though some tumors diagnosed as ovarian likely originate in the FE (Medeiros et al., 2006; Dubeau, 2008; Levanon et al., 2008; Shaw et al., 2009), the OSE appears to have a far higher rate of transformation, presumably due to its proximity to the ovary and ovulatory environment; thus, it may be only a matter of location that distinguishes these cells and drives their transformation. Localized mechanisms that affect OSE protein expression, differentiation, proliferation and/or death in vivo might be present in the ovarian environment, matrix and stromal cells (Kruk et al., 1994; Lawrenson et al., 2009; Zhu et al., 2010). rOSE cells derived from a source other than OSE could have inherently less tumorigenic potential but, on the other hand, be more susceptible to ovary-derived damage. In either case, OSEx would be transient.
The peritoneal mesothelium is an additional potential source for rOSE that was not investigated rigorously here. Although it is reportedly contiguous with the OSE, we observed no evidence of an epithelial layer surrounding the ovarian ligament, nor did the density distribution of rOSE indicate that ligament cells migrated onto the ovarian surface. In contrast, the outer surface of the FT was populated by cells that expressed some markers for the OSE and FE, but these cells did not comprise a well-formed epithelium (data not shown). Furthermore, there was no indication that the outer surface of the FT was in direct contact with the ovary. It is possible that the outer surface of the FT and FE are both in contact with the OSE, and the fimbrial/ovarian junction may contain cells from all three populations. As is the case for FE, if rOSE originate from adjacent peritoneal mesothelium, OSEx would be transient, and the tumorigenic potential of rOSE would depend on its susceptibility to ovarian influences. Aside from this, it would be clinically significant if peritoneal mesothelium-derived rOSE prevents ovarian adhesions. If scar-free healing is a property of normal OSE that can be acquired by peritoneal mesothelium, clinical induction of this capacity could attenuate the risk of adhesions following pelvic surgeries, as suggested by others (Fegan et al., 2008).
A surprising aspect of rOSE repopulation of the ovary, and a noted distinction between OSE and FE, is the low frequency of proliferative markers detected in cells on the ovarian surface, even during repopulation. In addition, ovarian surface cells express higher levels of FANCD2, as well as the base repair protein Ogg1 (Wright et al., 2011). It must be considered that the ovary, while placing the OSE at risk of transformation by repeated cycles of damage, simultaneously promotes recovery from this damage and suppresses proliferation. Loss of responsiveness to these cues when the OSE succumbs to ovary-derived damage, or loss of the cues themselves by ovarian defect or perhaps menopause (Vanderhyden, 2005; Smith and Xu, 2008), could be a critical early event in OC. The rise in frequency of OC after menopause is consistent with this, if the transition to menopause causes a decrease in DNA repair potential prior to the cessation of ovulation, or if the OSE continues to be damaged by unknown factors after menopause. In either case the observation that FANCD2 is absent or decreased in the OSE of women with a family history of OC (Pejovic et al., 2006) emphasizes the potential need for elevated DNA repair activity in healthy OSE. Detecting altered FANCD2 expression in aging OSE would provide additional support for this concept, although it seems likely that DNA repair plays a more significant role prior to menopause.
If the OSE has a low capacity for proliferation, the question arises whether the number of cells lost during each ovulation exceeds the number the OSE generates in each menstrual cycle. Basal proliferation rates within the OSE may account for cyclic loss, but if not, one would expect either that the OSE is depleted with age or is replaced by non-OSE cells, such as FE or peritoneal mesothelium. The former has not been reported, nor have preliminary observations detected age-related depletion of OSE in the rhesus monkey. In contrast, repopulation of the ovarian surface following OSEx may be an illustration of replacement by neighboring cells that occurs naturally. It can only be speculated whether the degree of replacement alters the functional and tumorigenic profile of ovarian surface populations, and whether an increase in OSE loss by increased ovulation number correlates with tumorigenic potential due to an altered population profile.
In summary, OSEx may offer a novel strategy for OC prevention. Importantly, this strategy may reduce risk without sacrificing the beneficial effects of ovarian function, including E and P production and reproductive potential. Even though this protocol resulted in a replacement epithelium, the rOSE was not conspicuously proliferative and the process was very gradual. If rOSE originates from normal OSE that escaped treatment, improvements in OSEx could result in permanent elimination of the OSE and the primary source of OC. This study also raises questions about potential interconversion between FE and OSE. Although these populations appear distinct, recent evidence of premalignant lesions within the fimbria (Kindelberger et al., 2007; Folkins et al., 2009; Semmel et al., 2009) and ovarian cysts (Pothuri et al., 2010) of BRCA mutant carriers, genetic evidence highlighting the similarity of high-grade serous tumors to FE and OSE (Marquez et al., 2005), developmental similarities (Auersperg et al., 2008) and data presented here suggest the commonalities among FE and OSE are more significant than differences. If FE-to-OSE conversion occurs, permanent OSEx may not be feasible, but could still reduce risk without sacrificing ovarian function. The possibility exists that FE-to-OSE, or peritoneal mesothelium-to-OSE, conversion is a natural process. Additional studies will be necessary to identify the source, functionality and tumorigenic potential of rOSE, to determine whether OSEx can result in more effective elimination of surface cells, and establish whether rhesus monkeys undergoing OSEx remain fertile.
Authors’ roles
J.W.W. contributed to experimental conception and design, data acquisition and analysis, manuscript drafting and critical revision and final manuscript approval. T.P. contributed to experimental conception and design, data analysis, critical manuscript review and final manuscript approval. L.J. contributed to data collection and analysis, critical manuscript discussion and review and final manuscript approval. C.V.B. contributed to experimental design, data acquisition and interpretation of ultrasound results, critical manuscript review and final manuscript approval. T.H. contributed to experimental design and data collection, critical manuscript review and final manuscript approval. R.L.S. contributed to study conception and design, data interpretation and analytic approach, critical manuscript revision and discussion and final manuscript approval.
Funding
This work was supported by NIH/NICHD HD050356 (J.W.W.), the OHSU Foundation (Award 14077; T.P.), NIH/NCRR RR000163 (J.W.W. and R.L.S.) and NIH/NICHD HD18185 (R.L.S.).
References
- Ahmed N, Thompson EW, Quinn MA. Epithelial-mesenchymal interconversions in normal ovarian surface epithelium and ovarian carcinomas: an exception to the norm. J Cell Physiol. 2007;213:581–588. doi: 10.1002/jcp.21240. [DOI] [PubMed] [Google Scholar]
- Auersperg N, Wong AS, Choi KC, Kang SK, Leung PC. Ovarian surface epithelium: biology, endocrinology, and pathology. Endocr Rev. 2001;22:255–288. doi: 10.1210/edrv.22.2.0422. [DOI] [PubMed] [Google Scholar]
- Auersperg N, Woo MM, Gilks CB. The origin of ovarian carcinomas: a developmental view. Gynecol Oncol. 2008;110:452–454. doi: 10.1016/j.ygyno.2008.05.031. [DOI] [PubMed] [Google Scholar]
- Bai W, Oliveros-Saunders B, Wang Q, Acevedo-Duncan ME, Nicosia SV. Estrogen stimulation of ovarian surface epithelial cell proliferation. In Vitro Cell Dev Biol Anim. 2000;36:657–666. doi: 10.1290/1071-2690(2000)036<0657:ESOOSE>2.0.CO;2. [DOI] [PubMed] [Google Scholar]
- Barber HR. Embryology of the gonad with reference to special tumors of the ovary and testis. J Pediatr Surg. 1988;23:967–972. doi: 10.1016/s0022-3468(88)80396-8. [DOI] [PubMed] [Google Scholar]
- Bishop CV, Sparman ML, Stanley JE, Bahar A, Zelinski MB, Stouffer RL. Evaluation of antral follicle growth in the macaque ovary during the menstrual cycle and controlled ovarian stimulation by high-resolution ultrasonography. Am J Primatol. 2009;71:384–392. doi: 10.1002/ajp.20664. [DOI] [PMC free article] [PubMed] [Google Scholar]
- Bowen NJ, Walker LD, Matyunina LV, Logani S, Totten KA, Benigno BB, McDonald JF. Gene expression profiling supports the hypothesis that human ovarian surface epithelia are multipotent and capable of serving as ovarian cancer initiating cells. BMC Med Genomics. 2009;2:71. doi: 10.1186/1755-8794-2-71. [DOI] [PMC free article] [PubMed] [Google Scholar]
- Brandenberger AW, Tee MK, Jaffe RB. Estrogen receptor alpha (ER-alpha) and beta (ER-beta) mRNAs in normal ovary, ovarian serous cystadenocarcinoma and ovarian cancer cell lines: down-regulation of ER-beta in neoplastic tissues. J Clin Endocrinol Metab. 1998;83:1025–1028. doi: 10.1210/jcem.83.3.4788. [DOI] [PubMed] [Google Scholar]
- Buhi WC. Characterization and biological roles of oviduct-specific, oestrogen-dependent glycoprotein. Reproduction. 2002;123:355–362. doi: 10.1530/rep.0.1230355. [DOI] [PubMed] [Google Scholar]
- Colgin DC, Murdoch WJ. Evidence for a role of the ovarian surface epithelium in the ovulatory mechanism of the sheep: secretion of urokinase-type plasminogen activator. Anim Reprod Sci. 1997;47:197–204. doi: 10.1016/s0378-4320(97)00011-0. [DOI] [PubMed] [Google Scholar]
- Dubeau L. The cell of origin of ovarian epithelial tumours. Lancet Oncol. 2008;9:1191–1197. doi: 10.1016/S1470-2045(08)70308-5. [DOI] [PMC free article] [PubMed] [Google Scholar]
- Fegan KS, Rae MT, Critchley HO, Hillier SG. Anti-inflammatory steroid signalling in the human peritoneum. J Endocrinol. 2008;196:369–376. doi: 10.1677/JOE-07-0419. [DOI] [PubMed] [Google Scholar]
- Folkins AK, Saleemuddin A, Garrett LA, Garber JE, Muto MG, Tworoger SS, Crum CP. Epidemiologic correlates of ovarian cortical inclusion cysts (CICs) support a dual precursor pathway to pelvic epithelial cancer. Gynecol Oncol. 2009;115:108–111. doi: 10.1016/j.ygyno.2009.06.032. [DOI] [PMC free article] [PubMed] [Google Scholar]
- Gillett WR, James C, Jetha N, McComb PF. Removal of the ovarian surface epithelium from the rabbit ovary—a cause of adhesions following a standard injury. Hum Reprod. 1994;9:497–500. doi: 10.1093/oxfordjournals.humrep.a138534. [DOI] [PubMed] [Google Scholar]
- Gubbay O, Guo W, Rae MT, Niven D, Howie AF, McNeilly AS, Xu L, Hillier SG. Anti-inflammatory and proliferative responses in human and ovine ovarian surface epithelial cells. Reproduction. 2004;128:607–614. doi: 10.1530/rep.1.00272. [DOI] [PubMed] [Google Scholar]
- Hazzard TM, Xu F, Stouffer RL. Injection of soluble vascular endothelial growth factor receptor 1 into the preovulatory follicle disrupts ovulation and subsequent luteal function in rhesus monkeys. Biol Reprod. 2002;67:1305–1312. doi: 10.1095/biolreprod67.4.1305. [DOI] [PubMed] [Google Scholar]
- Jemal A, Siegel R, Ward E, Hao Y, Xu J, Thun MJ. Cancer statistics, 2009. CA Cancer J Clin. 2009;59:225–249. doi: 10.3322/caac.20006. [DOI] [PubMed] [Google Scholar]
- Kindelberger DW, Lee Y, Miron A, Hirsch MS, Feltmate C, Medeiros F, Callahan MJ, Garner EO, Gordon RW, Birch C, et al. Intraepithelial carcinoma of the fimbria and pelvic serous carcinoma: Evidence for a causal relationship. Am J Surg Pathol. 2007;31:161–169. doi: 10.1097/01.pas.0000213335.40358.47. [DOI] [PubMed] [Google Scholar]
- Kruk PA, Uitto VJ, Firth JD, Dedhar S, Auersperg N. Reciprocal interactions between human ovarian surface epithelial cells and adjacent extracellular matrix. Exp Cell Res. 1994;215:97–108. doi: 10.1006/excr.1994.1320. [DOI] [PubMed] [Google Scholar]
- Lawrenson K, Benjamin E, Turmaine M, Jacobs I, Gayther S, Dafou D. In vitro three-dimensional modelling of human ovarian surface epithelial cells. Cell Prolif. 2009;42:385–393. doi: 10.1111/j.1365-2184.2009.00604.x. [DOI] [PMC free article] [PubMed] [Google Scholar]
- Levanon K, Crum C, Drapkin R. New insights into the pathogenesis of serous ovarian cancer and its clinical impact. J Clin Oncol. 2008;26:5284–5293. doi: 10.1200/JCO.2008.18.1107. [DOI] [PMC free article] [PubMed] [Google Scholar]
- Marquez RT, Baggerly KA, Patterson AP, Liu J, Broaddus R, Frumovitz M, Atkinson EN, Smith DI, Hartmann L, Fishman D, et al. Patterns of gene expression in different histotypes of epithelial ovarian cancer correlate with those in normal fallopian tube, endometrium, and colon. Clin Cancer Res. 2005;11:6116–6126. doi: 10.1158/1078-0432.CCR-04-2509. [DOI] [PubMed] [Google Scholar]
- Medeiros F, Muto MG, Lee Y, Elvin JA, Callahan MJ, Feltmate C, Garber JE, Cramer DW, Crum CP. The tubal fimbria is a preferred site for early adenocarcinoma in women with familial ovarian cancer syndrome. Am J Surg Pathol. 2006;30:230–236. doi: 10.1097/01.pas.0000180854.28831.77. [DOI] [PubMed] [Google Scholar]
- Metcalfe K, Lubinski J, Lynch HT, Ghadirian P, Foulkes WD, Kim-Sing C, Neuhausen S, Tung N, Rosen B, Gronwald J, et al. Family history of cancer and cancer risks in women with BRCA1 or BRCA2 mutations. J Natl Cancer Inst. 2010;102:1874–1878. doi: 10.1093/jnci/djq443. [DOI] [PubMed] [Google Scholar]
- Moore CM, Hubbard GB, Leland MM, Dunn BG, Best RG. Spontaneous ovarian tumors in twelve baboons: a review of ovarian neoplasms in non-human primates. J Med Primatol. 2003;32:48–56. doi: 10.1034/j.1600-0684.2003.00002.x. [DOI] [PubMed] [Google Scholar]
- Murdoch WJ, Martinchick JF. Oxidative damage to DNA of ovarian surface epithelial cells affected by ovulation: carcinogenic implication and chemoprevention. Exp Biol Med (Maywood) 2004;229:546–552. doi: 10.1177/153537020422900613. [DOI] [PubMed] [Google Scholar]
- Murdoch WJ, McDonnel AC. Roles of the ovarian surface epithelium in ovulation and carcinogenesis. Reproduction. 2002;123:743–750. doi: 10.1530/rep.0.1230743. [DOI] [PubMed] [Google Scholar]
- Okamoto S, Okamoto A, Nikaido T, Saito M, Takao M, Yanaihara N, Takakura S, Ochiai K, Tanaka T. Mesenchymal to epithelial transition in the human ovarian surface epithelium focusing on inclusion cysts. Oncol Rep. 2009;21:1209–1214. doi: 10.3892/or_00000343. [DOI] [PubMed] [Google Scholar]
- Okamura H, Katabuchi H, Ohba T. What we have learned from isolated cells from human ovary? Mol Cell Endocrinol. 2003;202:37–45. doi: 10.1016/s0303-7207(03)00060-1. [DOI] [PubMed] [Google Scholar]
- Osterholzer HO, Johnson JH, Nicosia SV. An autoradiographic study of rabbit ovarian surface epithelium before and after ovulation. Biol Reprod. 1985;33:729–738. doi: 10.1095/biolreprod33.3.729. [DOI] [PubMed] [Google Scholar]
- Pejovic T, Yates JE, Liu HY, Hays LE, Akkari Y, Torimaru Y, Keeble W, Rathbun RK, Rodgers WH, Bale AE, et al. Cytogenetic instability in ovarian epithelial cells from women at risk of ovarian cancer. Cancer Res. 2006;66:9017–9025. doi: 10.1158/0008-5472.CAN-06-0222. [DOI] [PubMed] [Google Scholar]
- Pothuri B, Leitao MM, Levine DA, Viale A, Olshen AB, Arroyo C, Bogomolniy F, Olvera N, Lin O, Soslow RA, et al. Genetic analysis of the early natural history of epithelial ovarian carcinoma. PLoS One. 2010;5:e10358. doi: 10.1371/journal.pone.0010358. [DOI] [PMC free article] [PubMed] [Google Scholar]
- Rae MT, Price D, Harlow CR, Critchley HO, Hillier SG. Glucocorticoid receptor-mediated regulation of MMP9 gene expression in human ovarian surface epithelial cells. Fertil Steril. 2009;92:703–708. doi: 10.1016/j.fertnstert.2008.06.040. [DOI] [PubMed] [Google Scholar]
- Semmel DR, Folkins AK, Hirsch MS, Nucci MR, Crum CP. Intercepting early pelvic serous carcinoma by routine pathological examination of the fimbria. Mod Pathol. 2009;22:985–988. doi: 10.1038/modpathol.2009.64. [DOI] [PMC free article] [PubMed] [Google Scholar]
- Shaw PA, Rouzbahman M, Pizer ES, Pintilie M, Begley H. Candidate serous cancer precursors in fallopian tube epithelium of BRCA1/2 mutation carriers. Mod Pathol. 2009;22:1133–1138. doi: 10.1038/modpathol.2009.89. [DOI] [PubMed] [Google Scholar]
- Smith ER, Xu XX. Ovarian ageing, follicle depletion, and cancer: a hypothesis for the aetiology of epithelial ovarian cancer involving follicle depletion. Lancet Oncol. 2008;9:1108–1111. doi: 10.1016/S1470-2045(08)70281-X. [DOI] [PMC free article] [PubMed] [Google Scholar]
- Vanderhyden BC. Loss of ovarian function and the risk of ovarian cancer. Cell Tissue Res. 2005;322:117–124. doi: 10.1007/s00441-005-1100-1. [DOI] [PubMed] [Google Scholar]
- Woo MM, Gilks CB, Verhage HG, Longacre TA, Leung PC, Auersperg N. Oviductal glycoprotein, a new differentiation-based indicator present in early ovarian epithelial neoplasia and cortical inclusion cysts. Gynecol Oncol. 2004;93:315–319. doi: 10.1016/j.ygyno.2004.01.047. [DOI] [PubMed] [Google Scholar]
- Wright JW, Stouffer RL, Rodland KD. High-dose estrogen and clinical selective estrogen receptor modulators induce growth arrest, p21, and p53 in primate ovarian surface epithelial cells. J Clin Endocrinol Metab. 2005;90:3688–3695. doi: 10.1210/jc.2004-2456. [DOI] [PubMed] [Google Scholar]
- Wright JW, Pejovic T, Fanton J, Stouffer RL. Induction of proliferation in the primate ovarian surface epithelium in vivo. Hum Reprod. 2008;23:129–138. doi: 10.1093/humrep/dem347. [DOI] [PubMed] [Google Scholar]
- Wright JW, Pejovic T, Lawson M, Jurevic L, Hobbs T, Stouffer RL. Ovulation in the absence of the ovarian surface epithelium in the primate. Biol Reprod. 2010;82:599–605. doi: 10.1095/biolreprod.109.081570. [DOI] [PMC free article] [PubMed] [Google Scholar]
- Wright JW, Jurevic L, Stouffer RL. Dynamics of the primate ovarian surface epithelium during the ovulatory menstrual cycle. Hum Reprod. 2011;26:1408–1421. doi: 10.1093/humrep/der057. [DOI] [PMC free article] [PubMed] [Google Scholar]
- Young KA, Chaffin CL, Molskness TA, Stouffer RL. Controlled ovulation of the dominant follicle: a critical role for LH in the late follicular phase of the menstrual cycle. Hum Reprod. 2003;18:2257–2263. doi: 10.1093/humrep/deg467. [DOI] [PubMed] [Google Scholar]
- Zelinski-Wooten MB, Slayden OD, Chwalisz K, Hess DL, Brenner RM, Stouffer RL. Chronic treatment of female rhesus monkeys with low doses of the antiprogestin ZK 137 316: establishment of a regimen that permits normal menstrual cyclicity. Hum Reprod. 1998;13:259–267. doi: 10.1093/humrep/13.2.259. [DOI] [PubMed] [Google Scholar]
- Zhu Y, Nilsson M, Sundfeldt K. Phenotypic plasticity of the ovarian surface epithelium: TGF-beta 1 induction of epithelial to mesenchymal transition (EMT) in vitro. Endocrinology. 2010;151:5497–5505. doi: 10.1210/en.2010-0486. [DOI] [PubMed] [Google Scholar]


