Abstract
MicroRNA (miRNA) expression profiling studies revealed a number of miRNAs dysregulated in the malignant brain tumor, glioblastoma. Molecular functions of these miRNAs in gliomagenesis are mainly unknown. We show that inhibition of miR-10b, a miRNA not expressed in human brain and strongly up-regulated in both low-grade and high-grade gliomas, reduces glioma cell growth by cell cycle arrest and apoptosis. These cellular responses are mediated by augmented expression of the direct targets of miR-10b, including BCL2L11/Bim, TFAP2C/AP-2γ, CDKN1A/p21, and CDKN2A/p16, which normally protect cells from uncontrolled growth. Analysis of The Cancer Genome Atlas (TCGA) expression dataset reveals a strong positive correlation between numerous genes sustaining cellular growth and miR-10b levels in human glioblastomas, while pro-apoptotic genes anti-correlate with the expression of miR-10b. Furthermore, survival of glioblastoma patients expressing high levels of miR-10 family members is significantly reduced in comparison to patients with low miR-10 levels, indicating that miR-10 may contribute to glioma growth in vivo. Finally, inhibition of miR-10b in a mouse model of human glioma results in significant reduction of tumor growth. Altogether, our experiments validate an important role of miR-10b in gliomagenesis, reveal a novel mechanism of miR-10b-mediated regulation, and suggest the possibility of its future use as a therapeutic target in gliomas.
Keywords: microRNA, glioma, apoptosis, cell cycle, cancer
Introduction
Glioblastoma (GBM), the highest grade glioma, is the most common malignant primary brain tumor in adults. Despite aggressive treatments, the median survival for patients diagnosed with GBM has only marginally changed over the past 25 years and still remains about one year. There is a critical need for new molecular targets, concepts, and approaches to treat this devastating disease. MicroRNA (miRNA) function in cancer formation has been extensively studied and is currently well established. Oncogenic miRNAs were shown to promote carcinogenesis by targeting tumor suppressors, e.g. regulators of cell cycle and pro-apoptotic genes (1, 2). Such miRNAs represent attractive targets for anti-cancer therapies, since their activity can be efficiently blocked by sequence-specific oligonucleotides or other antisense approaches.
Here we identified miR-10b as a unique miRNA expressed specifically in glioma tumors but not in normal brain cells, neither neural progenitor cells nor mature glia or neurons. miR-10b is highly expressed in a number of cancers, including glioma (3–6), but its role in gliomagenesis remains unclear. miR-10b is reported to regulate invasion and metastasis in breast cancer by targeting HOXD10 and downstream RHOC and uPAR genes or, alternatively, Tiam1 mRNA and the downstream gene Rac (5, 7). It also promotes cell migration and invasion of human esophageal squamous cell carcinoma cells by direct regulation of KLF4 (8). miR-10b also targets neurofibromin/NF-1 mRNA leading to the activation of RAS signaling in neurofibromatosis type 1 (9). These observations indicate that miR-10b targets different genes and thus controls various cellular pathways in heterogeneous cellular environments.
In this study, we focused on miR-10b function in gliomagenesis. Since miR-10b is strongly up-regulated in glioma, we applied a loss-of-function approach to identify miR-10b targets and explore its function in glioma growth in vitro and in vivo. These experiments, along with the analysis of the TCGA glioma dataset, led us to propose a new function for miR-10b in glioma: as a global regulator of glioma cell proliferation and death. Furthermore, this study indicates that miR-10b inhibition, alone or in combination with other treatments, may represent a novel therapeutic strategy against human glioma.
Materials and Methods
Human tissue samples
Fresh frozen human non-neoplastic brain tissue and tumor samples were obtained from the Department of Pathology at Brigham and Women’s Hospital (BWH) and the Department of Neurosurgery at VU University Medical Center (VUUMC). All human materials were used in accordance with the policies of BWH and VUUMC institutional review boards.
Cell cultures
Human glioma U87, A172, U251, LN229; neuroblastoma SH-SY5Y; breast carcinoma MCF7; and HeLa cells were obtained from ATCC (2005–2007); glioma LN215 and LN464 from Dr. Van Meir (Emory University School of Medicine, 2009); LN308 from Drs. Hegi and Levivier (The Laboratory of Brain Tumor Biology and Genetics, Lausanne, Switzerland; 2009); GBM8 from Dr. Wakimoto (MGH, 2009), and BT74 was gift of Dr. D. James (UCSF, 2008). LN308, LN215, and LN464 cell lines were authenticated for CDKN2A deletion in 2009 using qRT-PCR and western blot analysis. BT74 cell line was confirmed for p53 and PTEN mutations using PCR analysis. Other cell lines were not specifically tested, however they were obtained from either reliable commercial sources (ATCC, employing STR analysis (DNA profiling) for intraspecies identification) or from laboratories originally created the cell lines (GBM8 and BT74). In addition, every two month we test the cells for mycoplasma contamination and maintain our cells as mycoplasma-free cultures. The cells were cultured in DMEM (except for MCF7 which was maintained in RPMI) medium supplemented with 10% fetal calf serum. Primary glioma cells and human neural progenitors (hNPs) were cultured as described previously (10, 11) in the absence of serum. The cells were transfected, and miRNA and mRNA analyzed as described in Supplementary material.
Cell viability and caspase assays
Cells were transfected in 96-well plate and assayed for their viability three days later (5 days for BT74 cells) using CellTiter Glo Luminescent Cell Viability Assay (Promega). Enzymatic activities of caspase-3 and -7 were measured 48 h post-transfection by Caspase-Glo 3/7 Assay (Promega).
BrdU incorporation Assay
At 48 h after transfections the cells were pulsed with 10 μM of BrdU for 3 h. The cells were further fixed and stained with anti-BrdU antibodies using FITC BrdU Flow Kit (BD Biosciences), and analyzed using FlowJo software (Treestar).
Cell cycle analysis
Three days following transfection, attached and floating cells were collected for propidium iodide (PI) staining and FACS analysis. Typically, 10,000 events per sample were acquired on LCRII (BD Biosciences) and analyzed using FlowJo software.
Luciferase reporter assay
The cells were co-transfected in 96-well plate with 100 ng per well of psiCHECK-2 luciferase reporter vector containing 3′UTR variants and either control or anti-miR-10b oligos at 50 nM concentration. Two days later, luciferase activities were measured with Dual-Glo Luciferase Assay System (Promega), and Renilla luciferase activity was normalized to Firefly luciferase activity.
Western blotting
Western blot analysis was performed according to standard protocol (12) and as described in Supplementary material.
TCGA GBM data analysis
The TCGA miRNA and mRNA microarray data and metadata including survival information for GBM patients were downloaded from the following portal (13), and analyzed as described in Supplementary material.
In vivo targeting of miR-10b
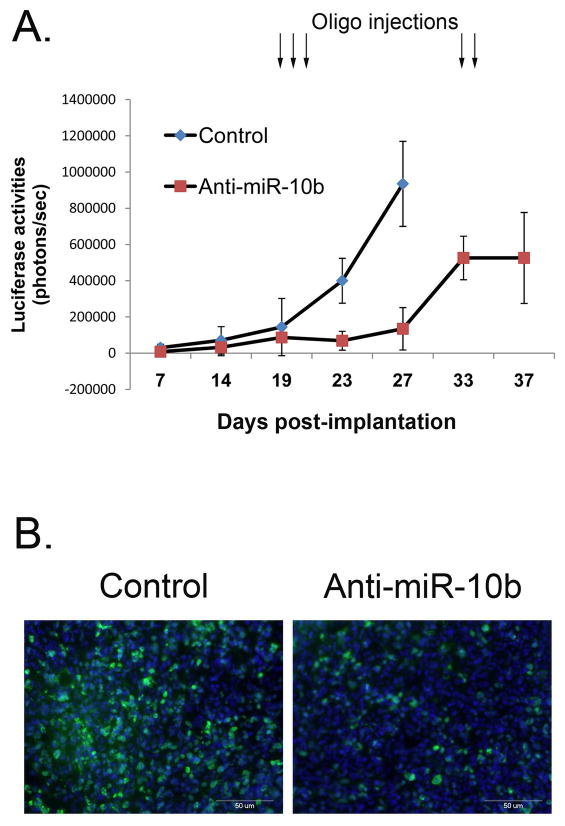
Nude mice were implanted subcutaneously with 1×10⁶ U87-Fluc cells. On day 19 post-implantation, tumors (n=5) were injected directly with a mixture containing 1.2 μl of in vivo-jetPEI (Invitrogen) and 8 μg of anti-miR-10b or control oligo in 5% glucose. The injections were repeated on days 20, 21, 33, and 34. Tumor growth was monitored over time using Fluc bioluminescence imaging after injection of D-luciferin (150 mg/kg) and acquiring photon counts over 10 sec using a CCD camera (Roper Scientific). Data acquisition, processing, quantification, and visualization were performed using CMIR-Image program as described earlier (14). Control mice were sacrificed on day 27 when tumor signals reached saturation and mice treated with miR-10b inhibitor were sacrificed on day 37. For immunohistochemistry, the established tumors were injected with either control or miR-10b inhibitor for two days in a row. Two days later, mice were sacrificed, tumors removed, freshly frozen, sectioned into 10 μm sections, and stained with antibody against Ki-67 (Abcam, 1:100), followed by visualization using fluorescent microscopy.
Results and Discussion
miR-10b is highly expressed in glioma cells and tumors but not detected in normal brain cells
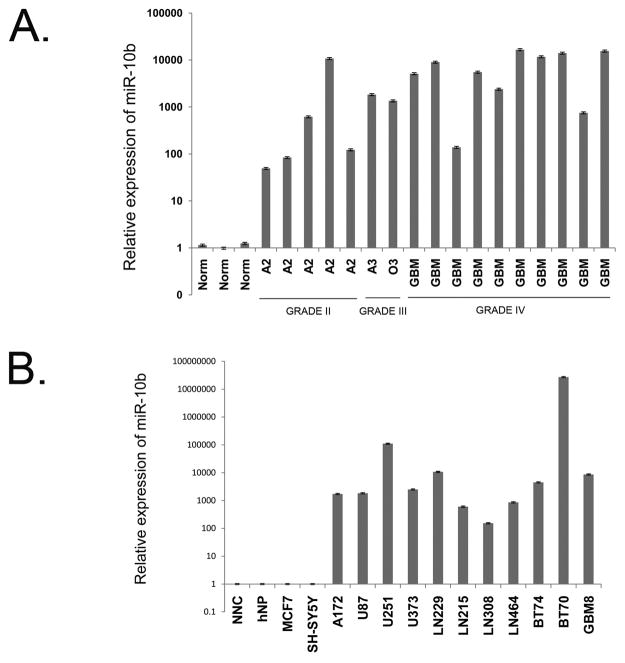
Several miRNA expression profiling studies, including ours, identified miR-10b as one of the most highly and significantly up-regulated miRNAs in human GBM tumors, compared to normal brain (3, 4, 12). To study miR-10b expression at different stages of glioma progression, we examined miR-10b levels in primary human glioma tissue specimens by qRT-PCR. Fig. 1A and our previous observations (12) show that miR-10b is highly expressed in gliomas of different grades and types, including low grade tumors (diffuse astrocytoma W.H.O. Grade II), however it is not detected in normal adult human brain specimens. In addition, we analyzed miR-10b expression in TCGA dataset, the largest currently available collection of GBM tissues, which includes array-based data on miRNA expression in 261 GBM samples and 10 normal brain samples (15). We found a broad range of miR-10b expression in GBM, with its high expression levels detected in the vast majority of GBM tissues. In contrast, in all normal brain specimens, miR-10b expression was at the baseline level (Supplementary Fig. S1). We further studied miR-10b expression in specific populations of human neural cells cultured in vitro. Remarkably, miR-10b was not detected by qRT-PCR in normal human neural progenitors that were cultured as neurospheres (hNP, Fig. 1B) and in mixed neuro-glial cultures obtained from human fetal brain (NNC). In contrast, it was highly expressed in tumorigenic glioma stem cell-like cultures as well as in all established glioma cell lines tested (Fig. 1B). A close homolog of miR-10b, miR-10a, is expressed in a normal brain and, based on qRT-PCR reactions and our analysis of the TCGA data, does not appear significantly up-regulated in GBM (up-regulation of ~1.5-fold only, based on TCGA dataset).
Figure 1.
Elevated expression of miR-10b in glioma cells and tumors. A, miR-10b expression in normal brain and glioma tumors. miR-10b expression was measured by qRT-PCR in gliomas of different grades (A2 and A3, astrocytoma; O3, oligodendroglioma; GBM, glioblastoma) and normal brain cortical tissues (Norm). B, miR-10b expression in normal human neural and glioma cells. Glioma cell lines (A172, U87, U251, U373, LN229, LN215, LN308, and LN464), low-passage tumorigenic GBM cells (BT74, BT70, and GBM8), and normal brain cells (mixed primary neuro-glial culture, NNC, and normal neural progenitors, hNP) were analyzed for miR-10b expression by qRT-PCR.
miR-10b inhibition leads to reduction of glioma cell growth
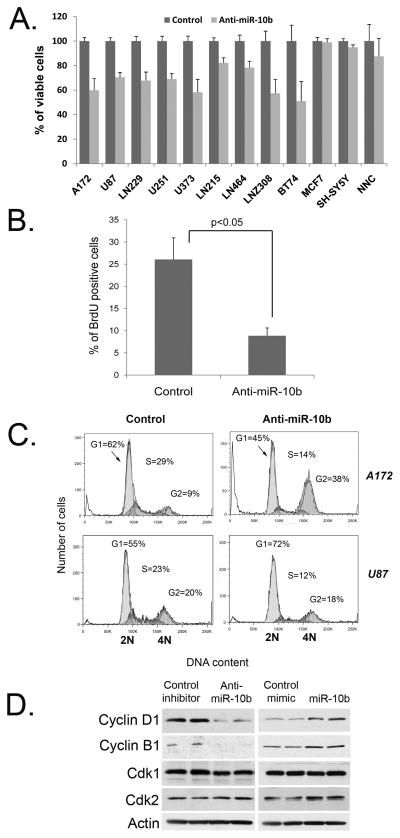
To study miR-10b function in glioma growth we inhibited miR-10b in glioma cells and measured cell viability. For miR-10b inhibition we utilized a highly specific 2′-O-MOE miR-10b antisense oligonucleotide (oligo) molecule, and in parallel, a non-targeting 2′-O-MOE control oligo (16). Treatment of different glioma cells with anti-miR-10b oligo resulted in about a 17-39-fold reduction of miR-10b expression levels, based on Taqman miRNA assays (Supplementary Fig. S2A). Furthermore, using a luciferase reporter vector containing a single perfect miR-10b binding site downstream of luciferase open reading frame, we observed a complete block of miR-10b activity (Supplementary Fig. S2B). Since glioma tumors and cell lines are heterogeneous genetically, we analyzed the response of eight established human glioma cell lines (A172, U87, LN229, U251, U373, LN215, LN464, LN308) and tumorigenic low-passage GBM cell line (BT74) maintained under neurosphere conditions in order to identify the common effects of miR-10b inhibition. Despite extreme genetic variability, all glioma cell lines consistently responded to miR-10b inhibition by significant reduction of cell growth (Fig. 2A). Moreover, treatment of glioma cells with other types of miR-10b inhibitors (e.g, 2′-O-MOE with phosphorothioate backbone and LNA-modified) resulted in similar reduction of glioma cell growth (Supplementary Fig. S2C and data not shown). Differently, inhibition of miR-10b paralog, miR-10a, did not cause significant growth reduction in all tested glioma cell lines (Supplementary Fig. S2D). Viability of cells not expressing miR-10b, including normal human primary neuro-glial cultures, was not affected by transfections with the anti-miR-10b oligo (Fig. 2A). These results indicate that growth inhibitory effects of the anti-miR-10b oligo are indeed mediated by the reduced miR-10b activity, rather than off-target effects. They also suggest an important role for miR-10b in promoting glioma cell growth, which can be specifically antagonized by its synthetic inhibitors without toxic effects on normal neural cells. Of note, modulation of miR-10b expression in A172 and U251 glioma cell lines did not affect cell invasiveness in vitro as tested by a transwell matrigel invasion assay (Supplementary Fig. S3).
Figure 2.
miR-10b silencing leads to cells cycle arrest and reduces glioma cell growth. A, Cell viability assay was performed on various glioma (A172, U87, U251, U373, LN229, LN215, LN308, LN464, and BT74) and non-glioma (MCF7, SH-SY5Y, and human NNC) cells transfected with either control (Control) or miR-10b 2′-O-MOE with phosphate backbone inhibitor (Anti-miR-10b). Error bars represent SD for 3-6 independent transfections; p<0.05 for all glioma lines. B, Inhibition of miR-10b in A172 glioma cells reduces BrdU incorporation. C, miR-10b inhibition leads to cell cycle arrest in glioma cells. A172 and U87 cells were analyzed by PI staining and FACS three days following transfections. D, miR-10b modulates expression of cyclins B1 and D1 in glioma cells. A172 cells were transfected with miR-10b inhibitor (Anti-miR-10b), mimic (miR-10b), and corresponding controls, and analyzed by Western blotting.
Inhibition of miR-10b leads to cell cycle arrest
To further explore miR-10b role in glioma cell proliferation, we analyzed the DNA replication and cell cycle in glioma cells treated with anti-miR-10b. First, we measured BrdU incorporation in glioma A172 cells. miR-10b suppression in these cells led to 3-fold reduction in BrdU incorporation implicating a decrease in DNA replication (Fig. 2B). Next, to analyze the mechanism of cell growth arrest caused by miR-10b inhibition, we assessed the cell cycle distribution of glioma cells transfected with either miR-10b inhibitor or control oligo. In most glioma cell lines, such as A172, LN229, U251, LN308, and U373, miR-10b inhibition caused cell cycle arrest at G2 phase. Other cells, like U87 and LN215, accumulated in G1 phase of the cell cycle (Fig. 2C). We also examined permanent cell cycle arrest, senescence, and observed that in several cell lines the down-regulation of miR-10b led to accumulation of senescent glioma cells (Supplementary Fig. S4A). Thus, miR-10b inhibition in various glioma cell lines blocks cell cycle progression, implying the involvement of this miRNA in cell cycle genes regulation. We therefore analyzed the response of several principal cell cycle regulators to the modulation of miR-10b expression by both miR-10b inhibition and over-expression (Fig. 2D). Levels of positive cell cycle regulators, such as cyclins B1 and D1 correlated with the modulated expression of miR-10b: the over-expression of miR-10b caused up-regulation of cyclins B1 and D1, whereas the inhibition of miRNA significantly reduced their levels. Regulation of these cyclins by miR-10b is most likely indirect and reflects its potential in promoting cell cycle. Therefore, miR-10b may control the sustained growth of glioma cells by regulation of cell cycle machinery.
Apoptosis and autophagy are induced in response to miR-10b inhibition
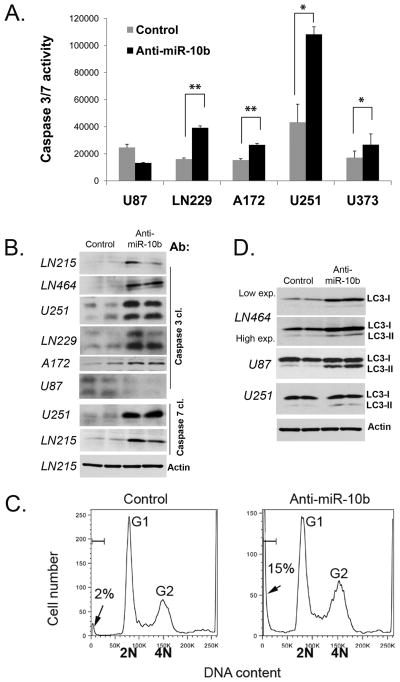
Reduction of glioma cell growth by down-regulation of miR-10b suggests that these cells may undergo programmed cell death. To test this hypothesis, we performed a number of assays to measure the induction of apoptosis in cells transfected with the anti-miR-10b oligo. Enzymatic assays measuring caspase-3 and -7 demonstrated about 2-fold activation of these effector caspases in most glioma cell lines following miR-10b inhibition (Fig. 3A). miR-10b down-regulation also caused caspase-3 and -7 cleavages, as detected by Western blot, indicating their activation (Fig. 3B). Finally, since DNA degradation is a hallmark of apoptotic induction, we examined cellular DNA content in different glioma cells transfected with anti-miR-10b using propidium iodide (PI) staining. U251 cells treated with the control oligo exhibited low levels of sub-G1 population representing mostly apoptotic cells (2%±0.3) while the miR-10b inhibitor strongly induced apoptosis (15%±0.1) (Fig. 3C). We also observed an increase in sub-G1 population in other glioma cell lines, such as A172, LN229, LN308, LN464, LN215, U87 and U373 (Supplementary Fig. S4B). These experiments demonstrate a potent apoptotic response of glioma cells to miR-10b inhibition.
Figure 3.
miR-10b inhibition leads to glioma cell death. A, Caspase 3/7 activity is induced in glioma cells treated with miR-10b inhibitor; *p<0.05, **p<0.005. B, miR-10b silencing results in caspase cleavage. Indicated glioma cells were analyzed by Western blots for cleaved (cl.) caspase-3 and -7. Anti-actin was used for loading control and representative immunoblot is shown. C, Inhibition of miR-10b leads to accumulation of glioma cells in sub-G1. U251 cells were analyzed by PI staining. Fractions of apoptotic cells (sub-G1) are indicated by arrows. D, miR-10b inhibition leads to autophagy, as determined by immunoblots with anti-LC3 antibody.
Interestingly, not all glioma cell lines responded to miR-10b inhibition by induction of apoptosis. This result led us to test anti-miR-10b effects on autophagy, an additional non-apoptotic cellular pathway associated with cell death, by following the autophagic marker LC3. In several glioma cell lines, including LN464, U87, and U251, LC3 expression was up-regulated and/or its mature form LC3-II was detected following miR-10b inhibition (Fig. 3D). Altogether, these observations demonstrate an involvement of miR-10b in the regulation of programmed death of glioma cells.
miR-10b directly regulates Bim, TFAP2C, p16, and p21
In order to identify target mRNAs directly regulated by miR-10b in glioma cells, we utilized several bioinformatic target prediction algorithms (TargetScan, Microcosm, Pictar, and RNAhybrid). We were particularly interested in the predicted targets that belong to “cell cycle” and “apoptosis” related Gene Ontology (GO) terms. Among predicted targets, we focused on Bim, TFAP2C, CDKN2A/p16, and p21. The first putative target, Bim, is a BCL2 interacting mediator of cell death, a pro-apoptotic protein whose expression and activation is a common response to anti-cancer therapeutics (17). Second, Transcription Factor AP-2γ (TFAP2C) is involved in cancer cell death, growth, and invasion (18). It can interact and activate p53, up-regulate cell cycle inhibitor p21, and also function in a p53-independent way. The third putative target, CDKN2A/p16 cell cycle inhibitor and tumor suppressor gene, is deleted in ~55% of malignant gliomas and in most glioma cell lines (15, 19), suggesting that the loss of this gene represents a key event on a road to GBM. In glioma cells that retain the CDKN2A chromosomal locus, miR-10b-mediated post-transcriptional repression of p16 mRNA would provide an additional mechanism of its silencing. Finally, p21 is a cell cycle inhibitor capable of inducing cell cycle arrest and senescence in cancer cells (20).
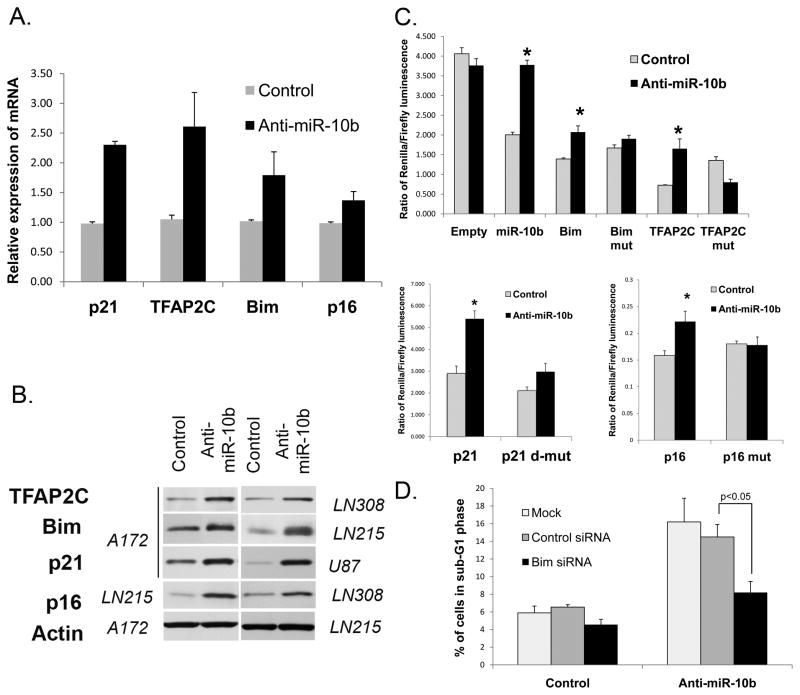
mRNAs for these predicted targets have perfect matches in their 3′UTRs to the seed region (nucleotides 2–8) of miR-10b (Supplementary Fig. S5). Predicted miR-10b binding sites in the TFAP2C and Bim mRNAs are highly conserved among mammals; predicted binding sites for CDKN2A/p16 and p21 are less conserved. To validate the regulation of these genes by miR-10b, we tested their expression levels upon inhibition of miR-10b. As expected, silencing of miR-10b caused de-repression of each of these genes, that was detected at both mRNA and protein levels in a number of glioma cell lines (Fig. 4A–B and Supplementary Fig. S6A). In contrast, HOXD10, the target validated for miR-10b and involved in migration and invasion of breast carcinoma cells (5) was not affected by anti-miR-10b in glioma cells (Supplementary Fig. S6B). These results indicate that in glioma miR-10b regulates Bim, TFAP2C, p16, and p21 but not HOXD10.
Figure 4.
Validation of miR-10b targets Bim, TFAP2C, p16, and p21. A, Inhibition of miR-10b causes up-regulation of target mRNA expression. Glioma cells (A172 for detecting p21, TFAP2C, and Bim; LN464 for p16) were analyzed by qRT-PCR. p<0.05 for all mRNAs. B, Inhibition of miR-10b causes up-regulation of target proteins Bim, p16, p21, and TFAP2C. Indicated (in italics) glioma cells were analyzed by Western blot. Elevated levels of p16 were detected upon miR-10b inhibition in all tested cell lines that express p16 (LN215, LN464, and LN308). Representative immunoblots for actin expression are shown for the loading control. C, Response of luciferase reporters containing 3′UTRs of miR-10b targets. The following luciferase reporters were used: empty plasmid (Empty), with miR-10b perfect binding site (miR-10b), with Bim, TFAP2C, p21, and p16 wild-type and corresponding mutant (Bim mut, TFAP2C mut, p21 d-mut [double mutant], and p16 mut) 3′UTR constructs. Glioma A172 cells (for Bim, p21, and TFAP2C) and HEK cells (for p16) were co-transfected with luciferase reporters and either miR-10b inhibitor or control oligos. Error bars represent SEM from 3–5 independent transfections; *p<0.05. D, Bim siRNA partially rescues apoptosis caused by miR-10b inhibition. Glioma LN308 cells were co-transfected with anti-miR-10b or its control oligo, and either siRNA to Bim, control siRNA or no siRNA (Mock), as indicated. The cells were stained with PI to examine DNA content by FACS.
To further validate direct binding and targeting by miR-10b, we constructed Renilla luciferase reporters containing either wild type or mutated 3′UTRs of these four target genes. Mutations were designed within the miR-10b seed-binding regions of the 3′UTRs, as indicated in Supplementary Fig. S5, in order to disrupt the predicted binding. Reporter activities were quantified and normalized to non-targeted Firefly luciferase activity. All four reporters containing the wild type 3′UTRs demonstrated notable de-repression in response to inhibition of miR-10b (Fig. 4C), indicating that miR-10b regulates those four genes via their 3′UTRs. Mutations within the miR-10b binding sites of Bim, TFAP2C, p21, and p16 3′UTRs partially abolished the responsiveness of the corresponding reporters to the miR-10b inhibitor. These results indicate that these sites are indeed critical for miR-10b binding and mediate its regulation.
Additional evidence supporting regulation of Bim, TFAP2C, and p21 by miR-10b in GBM was obtained from the combined analysis of miR-10b expression and Affymetrix mRNA profiling datasets reported by TCGA for GBM patients (15). Across 258 GBM tumors analyzed, miR-10b levels negatively correlated with Bim, TFAP2C, and p21 mRNAs (correlation coefficient for TFAP2C −0.228, p=0.0002; for Bim −0.153, p=0.01, and for p21 −0.113, p=0.06) (Supplementary Fig. S7). In contrast, based on TCGA dataset, HOXD10 was among the genes which expression most strongly positively correlated with miR-10b expression in GBM (correlation coefficient 0.402, p=7.9E-12). Moreover, HOXD10 downstream negative target, uPAR/PLAUR negatively correlated with miR-10b (correlation coefficient −0.219, p=0.0003). Altogether, these results indicate that miR-10b regulates Bim, TFAP2C, p16, and p21 and do not support miR-10b function in regulating HOXD10 in glioma cellular contexts.
One miRNA usually regulates multiple mRNA targets in a specific cellular context. To investigate whether miR-10b-regulated glioma cell growth is indeed mediated by the identified targets, we performed a set of rescue experiments. In these experiments, miR-10b inhibitor was co-transfected with siRNAs to Bim, TFAP2C, p16, or p21 mRNAs (Supplementary Fig. S8A). If these mRNAs are functional targets of miR-10b in glioma, abolishing their de-repression by specific siRNAs is expected to reduce cell cycle arrest and/or cell death caused by anti-miR-10b. Indeed, specific siRNAs prevented de-repression of miR-10b targets caused by miR-10b inhibition (Supplementary Fig. S8B) and apoptosis induction was alleviated by siRNA to Bim, as quantified by glioma cell accumulation in sub-G1 (Fig. 4D). Individual siRNAs to other tested mRNAs also tended to reduce the accumulation of glioma cells in sub-G1 (Supplementary Fig. S8C). In addition, siRNA to p21 restored S-phase in the anti-miR-10b treated glioma cells (Supplementary Fig. S8D). These results indicate that the identified targets at least partly mediate apoptosis and cell cycle effects caused by miR-10b inhibition. Variations in cell cycle arrest and apoptosis caused by anti-miR-10b in different glioma cell lines are likely due to diverse genetic background (e.g. p53 or CDKN2A/p16 wild-type versus mutated/deleted) and differential expression of miR-10b targets in these cells. Altogether, these data suggest that miR-10b simultaneously targets several key regulators of cell growth and death, which leads to increased glioma growth.
Inhibition of miR-10b reduces glioma growth in mouse model in vivo
To test the effects of miR-10b silencing on glioma growth in vivo, we used a mouse model of human gliomas. Since delivery of therapeutic molecules to intracranial gliomas remains one of the major obstacles in neuro-oncology, we performed proof-of-principal experiment on subcutaneous (s.c.) tumors. Tumorigenic human U87 glioma cells, stably expressing Firefly luciferase (Fluc) (14), were injected s.c into nude mice, and tumor growth was monitored by in vivo Fluc bioluminescence imaging. When the tumors were established, miR-10b 2′-O-MOE inhibitors were complexed with the in vivo-jetPEI delivery reagent and injected intratumorally for three sequential days (one injection per day) to ensure continuous distribution of the oligos. As demonstrated in Fig. 5A and Supplementary Fig. S9A, while all tumors treated with the control oligo continued to grow rapidly, injections of the anti-miR-10b oligos efficiently suppressed tumor growth for at least 7 days post-treatment. When the tumors resumed to re-grow, they were re-injected for two days with the same dose of anti-miR-10b, which again blocked tumor growth (Fig. 5A). After treatment, tumors were removed, sectioned, and stained for Ki-67, a marker of cell proliferation, and TUNEL, a marker for cell death. Tumors injected with anti-miR-10b showed reduced Ki-67 staining and increased TUNEL-positive cells as compared to controls, indicating that miR-10b suppression leads to inhibition of glioma cell proliferation and up-regulation of apoptosis in tumor xenografts (Fig. 5B and Supplementary Fig. S9B).
Figure 5.
Inhibition of miR-10b reduces glioma growth in vivo in U87 mouse model. A, Mice with established subcutaneous U87 tumors were injected intratumorally with either inhibitor of miR-10b or corresponding control oligo at days indicated by arrows. Tumor growth was monitored by in vivo Fluc bioluminescence imaging. Each data point represents the mean ±SD. B, Established U87 tumors were injected with either control or miR-10b inhibitor for two days in a row. Two days later, mice were sacrificed and tumors were removed, sectioned, and stained for nuclei using DAPI (blue) and Ki-67 (green).
TCGA data analysis suggests a global regulatory role for miR-10b in GBM cell growth and death, and patients’ survival
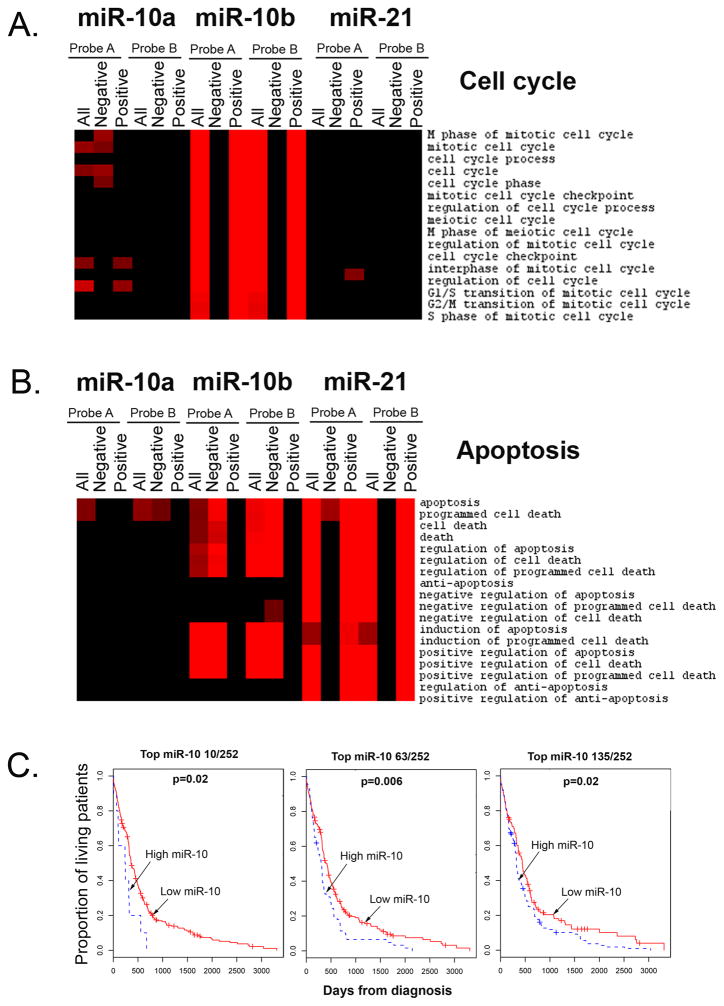
A recently published TCGA collaborative study on 258 GBM specimens allows for an integrated analysis of various molecular characteristics of the tumors, including mRNA and miRNA expression, as well as clinical parameters and survival data (15). We utilized these TCGA data for the analysis of correlation between miR-10b levels and expression of genes associated with different biological processes (GO terms). Interestingly, we found that expression of numerous genes that belong to cell cycle bioterms, positively correlated with miR-10b levels, while mRNA levels of pro-apoptotic genes anti-correlated with miR-10b expression (Fig. 6A and 6B, p<0.0001). In particular, miR-10b expression strongly correlated with expression of genes that belong to “G1/S transition”, “G2/M transition”, “S-phase” and “M-phase of mitotic cell cycle” bioterms. For comparison, similar analysis performed for miR-21 and miR-10a demonstrated no such correlations with the cell cycle and apoptosis bioterms. These data, along with our in vitro results, indicate that regardless of the number of direct mRNA targets, miR-10b is upstream of cell cycle and anti-apoptotic genes, controlling principal decisions of proliferation versus cell death in glioma cells. Importantly, miR-10b did not correlate with bioterms related to migration and invasion (Supplementary Fig. S10), further suggesting that miR-10b is not involved in these processes in glioma.
Figure 6.
Analysis of miR-10b function in GBM as suggested by TCGA data. A, Expression of cell cycle genes positively correlates with miR-10b expression in GBM patients. Significantly correlated genes (p<0.0001) were assessed for enrichment level of GO biological processes terms and the enrichment scores are presented in the form of heatmaps, showing the terms in rows. The gradient of red color shows the level of enrichment and black corresponds to no enrichment. Enrichment of all correlated (All), negatively correlated (Negative), and positively correlated (Positive) genes is demonstrated for two miR-10b probes (Probe A and Probe B) used on the TCGA arrays. Correlation for miR-21 and miR-10a is demonstrated for comparison. B, Expression of “positive regulators of cell death” anti-correlates with miR-10b expression in GBM patients. C, Shorten survival of GBM patients is strongly associated with high miR-10 expression. Only three (top 10 miR-10 expressors out of 252 patients, top 63, and top 135) from numerous miR-10-based stratification strategies that exhibit significant association are shown. Log rank test p-values for the difference between two survival curves for the miR-10-high and -low expressor GBM patients are indicated.
Finally, we investigated association between miR-10b expression in GBM tumors and patients’ post-diagnosis survival. Kaplan-Meier survival analysis available through the TCGA Cancer Molecular Analysis Portal (21) suggested that miR-10b expression may correlate with patient survival (22). Using our more stringent approach that included all possible patients’ stratification conditions, we also detected some association between miR-10b expression and survival, however it was insignificant for most stratification conditions. Of note, both miR-10a and miR-10b are expressed in glioma from two independent loci, thus their expressions do not correlate. The two miRNAs likely co-function since they are predicted to mainly have identical targets. We therefore assessed whether combined miR-10a/b (miR-10) expression correlates with the survival. Importantly, regardless of the stratification conditions, the expression of miR-10 was significantly associated with survival: patients with high miR-10 levels have much shorter survival compared with the low-miR-10 expressors (Fig. 6C). This strong correlation of combined miR-10a and miR-10b expression levels with patients’ survival indicates that both miR-10a and miR-10b may contribute to gliomagenesis. Nevertheless, the profound effects of miR-10b on cell cycle and apoptosis in vitro (Fig. 2 and 3), suggest that the functions of miR-10a and -10b are not absolutely redundant and the highly elevated levels and activity of miR-10b in glioma cells play an important role in the tumor biology. Additional in vivo experiments will be required to determine if antagonizing miR-10b alone or miR-10 as a family proves most efficient for glioma treatments.
In conclusion, we integrated in vitro experiments on glioma cells and in vivo studies on a mouse model of human glioma together with in silico analysis of a large dataset of human GBM (TCGA) to understand the functions of miR-10b in these brain tumors. Importantly, miR-10b is highly expressed in a number of genetically diverse glioma cell lines including p53- or PTEN-mutated and CDKN2A-deleted cells, and its inhibition reduces growth of all of them. Indeed, miR-10b appears to target at least several key cell cycle inhibitors and pro-apoptotic genes and thus controls glioma growth by modulating several independent signaling pathways. Previous correlative studies suggested that, as in breast carcinoma, miR-10b may target HOXD10 and thus control migration/invasion in glioma (4). Our functional studies demonstrate that in glioma, differently from breast carcinoma, miR-10b operates not by repressing HOXD10 and thus promoting cell migration and invasion, but by a principally different mechanism of controlling cell cycle and apoptosis. Therefore, one miRNA may serve different oncogenic functions in different cellular environments such as glioma and breast carcinoma. Whether mechanisms that regulate miR-10b expression in various cancer types are common or cell-specific, and what are the mechanisms preventing miR-10b expression in normal brain cells, remain to be investigated. Finally, potent effect of miR- 10b sequence-specific inhibitors on the growth of various glioma cell lines and tumors as well as a significant correlation between miR-10 levels and patient survival suggest that miR-10b targeting can represent a novel therapeutic strategy for the diverse population of glioma patients.
Supplementary Material
Acknowledgments
Grant support: This study was supported by NCI R01CA138734 and Sontag awards (to AMK) and Paul Brazen American Brain Tumor Association Fellowship (to GG).
We would like to thank to Drs. S. Absalon and T. Veremeyko for preparing primary neuro-glial cultures and Ms. M. Kerami for the TUNEL staining. We are grateful to people who provided us glioma cell lines (Drs. Van Meir, Hegi, and Wakimoto) and Dr. N. Teplyuk for the critical reading of the manuscript.
Footnotes
The authors have declared that no conflict of interest exists.
References
- 1.Hammond SM. MicroRNAs as oncogenes. Curr Opin Genet Dev. 2006;16:4–9. doi: 10.1016/j.gde.2005.12.005. [DOI] [PubMed] [Google Scholar]
- 2.Hwang HW, Mendell JT. MicroRNAs in cell proliferation, cell death, and tumorigenesis. Br J Cancer. 2006;94:776–80. doi: 10.1038/sj.bjc.6603023. [DOI] [PMC free article] [PubMed] [Google Scholar]
- 3.Ciafre SA, Galardi S, Mangiola A, et al. Extensive modulation of a set of microRNAs in primary glioblastoma. Biochem Biophys Res Commun. 2005;334:1351–8. doi: 10.1016/j.bbrc.2005.07.030. [DOI] [PubMed] [Google Scholar]
- 4.Sasayama T, Nishihara M, Kondoh T, Hosoda K, Kohmura E. MicroRNA-10b is overexpressed in malignant glioma and associated with tumor invasive factors, uPAR and RhoC. Int J Cancer. 2009;125:1407–13. doi: 10.1002/ijc.24522. [DOI] [PubMed] [Google Scholar]
- 5.Ma L, Teruya-Feldstein J, Weinberg RA. Tumour invasion and metastasis initiated by microRNA-10b in breast cancer. Nature. 2007;449:682–8. doi: 10.1038/nature06174. [DOI] [PubMed] [Google Scholar]
- 6.Garzon R, Garofalo M, Martelli MP, et al. Distinctive microRNA signature of acute myeloid leukemia bearing cytoplasmic mutated nucleophosmin. Proc Natl Acad Sci U S A. 2008;105:3945–50. doi: 10.1073/pnas.0800135105. [DOI] [PMC free article] [PubMed] [Google Scholar]
- 7.Moriarty CH, Pursell B, Mercurio AM. miR-10b targets Tiam1: implications for Rac activation and carcinoma migration. J Biol Chem. 2010;285:20541–6. doi: 10.1074/jbc.M110.121012. [DOI] [PMC free article] [PubMed] [Google Scholar]
- 8.Tian Y, Luo A, Cai Y, et al. MicroRNA-10b promotes migration and invasion through KLF4 in human esophageal cancer cell lines. J Biol Chem. 285:7986–94. doi: 10.1074/jbc.M109.062877. [DOI] [PMC free article] [PubMed] [Google Scholar]
- 9.Chai G, Liu N, Ma J, et al. MicroRNA-10b regulates tumorigenesis in neurofibromatosis type 1 [published online ahead of print May 12, 2010] Cancer Sci. doi: 10.1111/j.1349-7006.2010.01616.x. [DOI] [PMC free article] [PubMed] [Google Scholar]
- 10.Wakimoto H, Kesari S, Farrell CJ, et al. Human glioblastoma-derived cancer stem cells: establishment of invasive glioma models and treatment with oncolytic herpes simplex virus vectors. Cancer Res. 2009;69:3472–81. doi: 10.1158/0008-5472.CAN-08-3886. [DOI] [PMC free article] [PubMed] [Google Scholar]
- 11.Imitola J, Raddassi K, Park KI, et al. Directed migration of neural stem cells to sites of CNS injury by the stromal cell-derived factor 1alpha/CXC chemokine receptor 4 pathway. Proc Natl Acad Sci U S A. 2004;101:18117–22. doi: 10.1073/pnas.0408258102. [DOI] [PMC free article] [PubMed] [Google Scholar]
- 12.Gabriely G, Wurdinger T, Kesari S, et al. MicroRNA 21 promotes glioma invasion by targeting matrix metalloproteinase regulators. Mol Cell Biol. 2008;28:5369–80. doi: 10.1128/MCB.00479-08. [DOI] [PMC free article] [PubMed] [Google Scholar]
- 13.TCGA Data Portal. [Updated 2011, Jan 23; cited 2011, Jan 24] Available from: http://tcga-data.nci.nih.gov/tcga/
- 14.Wurdinger T, Badr C, Pike L, et al. A secreted luciferase for ex vivo monitoring of in vivo processes. Nat Methods. 2008;5:171–3. doi: 10.1038/nmeth.1177. [DOI] [PMC free article] [PubMed] [Google Scholar]
- 15.Comprehensive genomic characterization defines human glioblastoma genes and core pathways. Nature. 2008;455:1061–8. doi: 10.1038/nature07385. [DOI] [PMC free article] [PubMed] [Google Scholar]
- 16.Davis S, Lollo B, Freier S, Esau C. Improved targeting of miRNA with antisense oligonucleotides. Nucleic Acids Res. 2006;34:2294–304. doi: 10.1093/nar/gkl183. [DOI] [PMC free article] [PubMed] [Google Scholar]
- 17.Jiang Z, Zheng X, Lytle RA, Higashikubo R, Rich KM. Lovastatin-induced up-regulation of the BH3-only protein, Bim, and cell death in glioblastoma cells. J Neurochem. 2004;89:168–78. doi: 10.1111/j.1471-4159.2004.02319.x. [DOI] [PubMed] [Google Scholar]
- 18.Pellikainen JM, Kosma VM. Activator protein-2 in carcinogenesis with a special reference to breast cancer--a mini review. Int J Cancer. 2007;120:2061–7. doi: 10.1002/ijc.22648. [DOI] [PubMed] [Google Scholar]
- 19.Ishii N, Maier D, Merlo A, et al. Frequent co-alterations of TP53, p16/CDKN2A, p14ARF, PTEN tumor suppressor genes in human glioma cell lines. Brain Pathol. 1999;9:469–79. doi: 10.1111/j.1750-3639.1999.tb00536.x. [DOI] [PMC free article] [PubMed] [Google Scholar]
- 20.Abbas T, Dutta A. p21 in cancer: intricate networks and multiple activities. Nat Rev Cancer. 2009;9:400–14. doi: 10.1038/nrc2657. [DOI] [PMC free article] [PubMed] [Google Scholar]
- 21.TCGA Cancer Molecular Analysis Portal. [cited 2011, Jan 24; Available from: https://cma.nci.nih.gov/cma-tcga/
- 22.TCGA Cancer Molecular Analysis for miR-10b. [cited 2011, Jan 24] Available from: https://cma.nci.nih.gov/cma-tcga/geneView/kmPlot?control_taskId=1295909131920&taskId=1295909131320&geArrayPlatform=TCGA_miRNA_level2_Jan30_09.Rda&sampleGroups=All_Patients&platformName=MIRNA&reporter=Median_of_All_Reporters&geneSymbol=hsa-mir-10b&plotType=GE_KM_PLOT&plot=GE_KM_PLOT&method=Go.
Associated Data
This section collects any data citations, data availability statements, or supplementary materials included in this article.


