

Abstract
We developed Surface Proteome Signatures (SPS) for identification of new biomarkers playing a role in cancer drug resistance. SPS compares surface antigen expression of different cell lines by immunocytochemistry of a phage display antibody library directed to surface antigens of HT1080 fibrosarcoma cells. We applied SPS to compare the surface proteomes of two epithelially derived cancer cell lines, MCF7 and NCI/ADR-RES, which is drug resistant due to overexpression of the P-glycoprotein drug efflux pump. Surface proteome profiling identified CD44 as an additional biomarker that distinguishes between these two cell lines. CD44 immunohistochemistry can distinguish between tumors derived from these lines and predict tumor response to doxorubicin in vivo. We further show CD44 acts in drug resistance independently of P-glycoprotein in NCI/ADR-RES cells and increases expression of the anti-apoptotic protein Bcl-xL. Our findings illustrate the utility of SPS to distinguish between cancer cell lines and their derived tumors and identify novel biomarkers involved in drug resistance.
Keywords: CD44, Proteomics, Bcl-xL, Cancer, Drug Resistance
Introduction
Ascertaining tumor drug resistance would allow clinicians to better individualize cancer therapy. Current practice utilizes factors such as age, tumor size, and pathological grade to determine the appropriate chemotherapeutic regimen. However, patients presenting with similar profiles do not always respond similarly to treatment (1). It is estimated that as few as 50% of patients are responsive to current chemotherapeutic regimens (2). Therefore, new methods of predicting tumor response to chemotherapy could enhance patient outcomes.
Differential expression microarrays to profile transcriptional variation between cancers have shown promise in predicting patient outcome to chemotherapeutic treatments (3, 4, 5, 6). However, these approaches do not account for post-translational modifications and alternate splicing events inherent in the proteome. While the genome is estimated at roughly 23,000–40,000 genes (7, 8) the human proteome is thought to contain over 1 million proteins (9). Thus, the greater complexity of the proteome provides opportunities to develop tumor profiles based on novel differences between cancer subtypes that differ in resistance to chemotherapy. Thus far, proteomic profiling has not been fully exploited to address this goal. To begin to access this complexity, we have developed surface proteome signature technology (SPS) as a complementary tool to current proteomic-profiling techniques such as 2D gel electrophoresis and mass spectrometry. SPS utilizes a library of single chain variable fragment antibodies (scFv) raised against the cell surface of HT1080 fibrosarcoma cells. This scFv library is used to interrogate cancer cells and assess their differential expression by comparing surface protein expression between cell lines. By comparing SPS profiles between two cell lines with varying response to chemotherapeutic drugs, we can identify new biomarkers with potential diagnostic value.
Results
Generation of scFv library development and test of SPS
SPS is based on comparative immunocytochemistry between two cell samples using an antibody library that assesses quantitative differences of surface expression between these samples. Our analysis focused on the surface proteome as a subset of the total proteome that, by virtue of accessibility, is potentially more amenable to drug discovery and therapeutic intervention. We previously developed a 700-component E-tag labeled single chain variable fragment (scFv) phage display library that recognizes surface antigens of HT1080 fibrosarcoma cells (10, 12). By binding cells with an E-tagged scFv followed by anti-E-tag mouse IgG, Alexa488 conjugated rabbit anti-mouse secondary and Alexa488 goat anti-rabbit tertiary antibodies; we generated a quantitative fluorescent signal that corresponds to surface expression of the scFv cognate antigen. Assessing the binding of scFvs on each cell line allowed us to generate a surface proteome signature that reflects the relative expression of the antigens bound by the scFv library. While we do not know a priori the identity of the antigens bound, scFvs that show significant differences in binding are then used to identify the antigen by IP/MS from cell lysates. This approach takes advantage of the ability to generate large-scale antibody libraries by phage display and identification of antigens by IP/MS.
We first tested the ability of SPS to detect changes in surface expression of a single specific protein. The expression of the poliovirus receptor CD155, the antigen for scFv 5d11, was knocked down in HT1080 cells and confirmed via western blot and immunofluorescent microscopy (Figure 1A & B). We compared the relative binding for a 10-scFv SPS, including 5d11, for both anti-PVR siRNA-treated HT1080 cells and HT1080 cells treated with a scrambled control (Figure 1C). SPS profiling revealed a marked difference (t-test, p=0.00008) of 5d11 fluorescence in anti-PVR siRNA treated HT1080 cells when compared to scramble siRNA control. In contrast, there was no significant difference observed in binding for the other surface antigens in the subset of scFvs employed. These findings indicated that SPS could detect specific differences in surface expression of HT1080 cells and served as a proof of principle for use of this technology.
Fig. 1. SPS can detect altered expression of controlled knockdown for PVR.
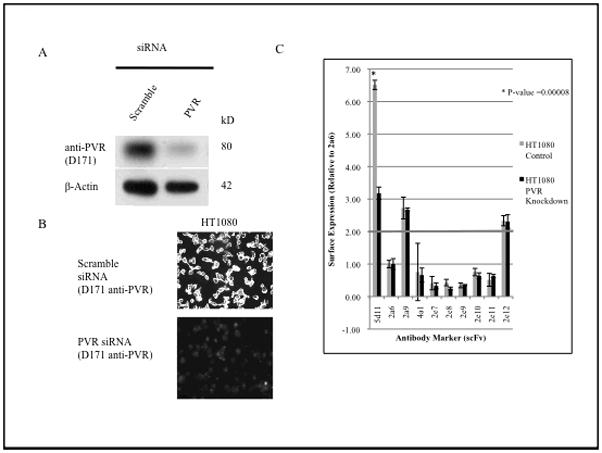
A, siRNA knockdown of a known scFv (5d11) cognate antigen, PVR, in HT1080 cells. Western blot analysis shows 79% knockdown of PVR. B, confirmation of knockdown by immunofluorescent microscopy using the anti-PVR monoclonal antibody D171. C, Immunocytochemistry quantification of scFv binding in PVR siRNA treated HT1080 cells. *, significant difference (P<0.0001) compared with control by t-test.
We then tested for the sensitivity and reproducibility of our assay by comparing the SPS of two identical samples of MCF7 performed on separate days using a 70 scFv panel (~10% of our library). We defined potential biomarkers that distinguished between these cell lines by the following criteria: 1) having a greater than two-fold difference in binding between cell lines; 2) statistically significant difference in binding between cell lines as measured by t-test (P<0.01) and 3) a surface expression difference that repeats in a duplicate SPS screen. The vast majority of scFvs showed no significant difference in binding between samples (Figure 2A). Three scFvs did show a significant difference in scFv surface binding but did not repeat in a secondary screen, and thus did not meet our established criteria. This experiment shows a false positive rate of ~ 4% (3 out of 70) inherent in any single SPS experiment but a repeat analysis can be used to rule out these false positives.
Fig. 2. Pair-wise comparison of 70 scFvs SPS panel for MCF7, HT1080 and MCF7 replicates.
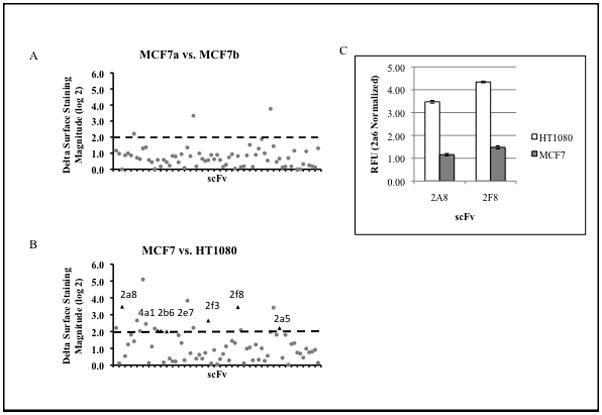
A, MCF7 replicate comparison of (70 scFv SPS profile). Dashed line indicates 2-fold difference in binding threshold. Three scFvs that met criteria in the original SPS screen did not repeat in a confirmatory screen. B, MCF7 vs. HT1080 SPS comparison shows numerous differences in scFv antigen binding. (circle)= scFv change in binding during initial experiment, (triangle)= indicate scFv’s demonstrating significant difference in antigen binding repeating in secondary screen and are designated as potential biomarkers. C, Immunocytochemistry for scFv 2a8 and 2f8 signals for 30 individual samples performed in triplicate of HT-1080 and MCF7 cells from three separate experiments.
We next applied our 70 scFv SPS panel to two unrelated cell lines, expecting a large amount of variation in their surface proteomes, to determine if SPS could distinguish between the two. SPS comparison of HT1080 fibrosarcoma and MCF7 breast adenocarcinoma cells yielded 7 reproducible hits (indicated by triangle, Figure 2B). We expected that SPS comparing cells of distinct lineage would be markedly different in their surface proteome and about 10% of the scFvs applied showed reproducible and significant differences. While there are numerous similarities in SPS between these two cell lines, we focused primarily on differences in surface binding as these represent candidates for potentially distinguishing biomarkers.
We tested the ability of scFvs identified by SPS to distinguish between HT1080 and MCF7 cell lines. We selected 2a8 and 2f8 (two scFvs that showed the largest difference in SPS) for use in fluorescent immunocytochemistry of samples of MCF7 and HT1080 cells and provided the resulting fluorescence signals to an observer blinded to the identity of the cell samples. 10 samples per cell line were assayed on three separate days to determine if day-to-day experimental variation affects scFv binding levels. Each individual sample consists of three wells containing 20,000 cells per well for a total of 30 samples. The average of these samples was used by the scorer to correctly identify 100% of the 60 total samples as being of either MCF7 or HT1080 based on the relative binding of 2a8 and 2f8. Figure 2C shows the average binding of single chain markers (±sem) for this experiment and clearly shows the difference in fluorescence signal for these scFvs between HT1080 and MCF7 cell samples. These findings indicate that scFvs identified by SPS can distinguish between these cell lines.
SPS identifies CD44 as a biomarker that distinguishes MCF7 from NCI/ADR-RES cells
We next applied SPS to two cell lines of differing drug resistance: MCF7 vs. NCI/ADR-RES, previously shown to have high expression of the drug efflux pump, p-glycoprotein (MDR1) (13, 14, 15). NCI/ADR-RES, formerly MCF7-Adr, was originally isolated from MCF7 by growth in gradually increasing concentrations of doxorubicin (16) and was thought to be a drug resistant subline. Recent analysis has suggested the NCI/ADR-RES cell line is actually an OVAR-8 contaminant of the original MCF7 population (17, 18). In an Affymetrix microarray analysis of the NCI-60 cell line panel, there was a 98.7% similarity in SNP’s between NCI/ADR-RES and the OVAR-8 ovarian carcinoma (19). In addition, subsequent spectral karyotyping analysis performed on these cell lines showed a significant similarity between NCI/ADR-RES and the OVAR-8 cell line (19). While the genomic analysis shows that NCI/ADR-RES are not derived from MCF7 cell line, the proteomic analysis of these cells is not as clear. 2D gel electrophoresis of NCI/ADR-RES cell lysates clearly demonstrated a high amount of similarity with two breast cancer cell lines, MDA-MB 231 and MDA-MB 435 (20).
Due to this finding, we applied a 70-scFv SPS panel to these two cell lines to assess surface proteomic differences between MCF7 and NCI/ADR-RES in order to resolve this issue. As a positive control, we included an antibody against MDR1/pgp. The overall goal was two-fold: to identify potential biomarkers useful in identifying cells that would be refractory to treatment with the chemotherapeutic doxorubicin and determine if MCF7 and NCI/ADR-RES express proteomically distinct profiles. SPS comparison of these two cell lines revealed two repeatable differences: MDR1/pgp (positive control) and 4a1 (Figure 3A). These findings show that MCF7 and NCI/RES-ADR have very similar surface proteomes and that 4a1 recognizes a potential biomarker for drug resistance in NCI/ADR-RES cells. We performed IP/MS to identify the antigen bound by 4a1 (12) and established its identity as CD44, the hyaluronan receptor.
Fig. 3. scFv 4a1 can distinguish between cell lines in vitro.
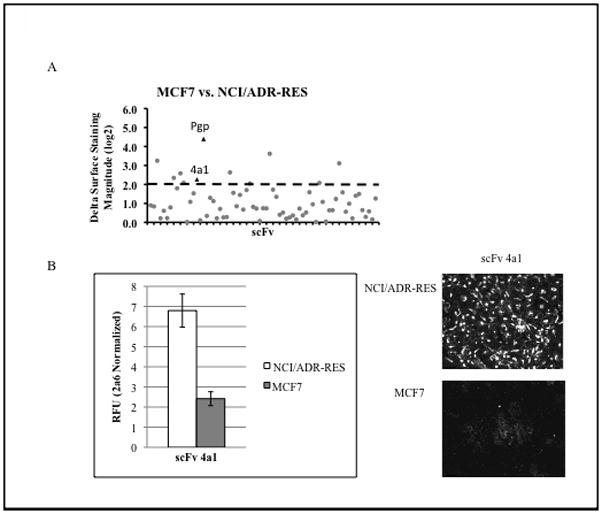
A. 70 scFv SPS comparison of MCF7 and NCI/ADR-RES yielded nine candidate biomarkers. (circle)= scFv change in binding during initial experiment, (triangle)=indicate scFv’s demonstrating significant difference in antigen binding repeating in secondary screen and are designated as potential biomarkers. B. Average normalized RFU for 4a1 shown for immunocytochemistry for 30 individual samples (each sample is the average of a triplicate of 20,000 cells per well) of MCF7 and NCI/ADR-RES cells from three separate experiments. Immunofluorescent microscopy of MCF7 and NCI/ADR-RES cells confirm relative binding differences for 4a1 between cell lines.
We tested if CD44 immunocytochemistry alone was sufficient to distinguish between MCF7 and the drug resistant line NCI/ADR-RES in a similar experiment as outlined above. Again, the scorer correctly identified 100% of the blinded samples of being either MCF7 or NCI/ADR-RES (Figure 3B). The high accuracy of scoring shows that CD44 expression can distinguish between NCI/ADR-RES and MCF7 cells in vitro.
This observation was further supported by in vitro experiments utilizing commercially available monoclonal antibodies raised against CD44. Immunocytochemistry comparing fluorescent staining between scFv 4a1, CD44 clone 2C5 and CD44 clone IM7 show similar difference in signal magnitude between MCF7 and NCI/ADR-RESS cells and this result was confirmed by immunofluorescent microscopy and FACS sorting (Supplemental Data Figure 1A, 2 and 3). Furthermore, fluorescent signal from lysed cells for CD44 expression (normalized to scFv 2a6) was three-fold higher in NCI/ADR-RES cells compared with MCF7 cells (Supplemental Data Figure 1B).
CD44 serves as a distinguishing biomarker in vivo
Our results show that CD44 expression can distinguish between NCI/ADR-RES and MCF7, two cell lines that differ in drug resistance in vitro, yet it was not clear if CD44 could serve to distinguish between tumors derived from these cells in vivo. To test this, we generated MCF7 and NCI/ADR-RES tumors in a xenograft mouse model and performed CD44 immunohistochemistry on paraffin sections derived from these tumors. In addition, we also addressed the ability of CD44 to predict tumor susceptibility to the chemotherapeutic drug doxorubicin. We transfected both cell lines with the firefly luciferase reporter construct pGL4.13[luc2/SV40] to track tumor growth in vivo by detection via the Xenogen IVIS 200 imaging system. Live animal imaging permitted us to measure tumor growth accurately for each of these cell line-derived tumors and assess the response to doxorubicin. SCID mice were injected subcutaneous to the nipple with 2×10⁶ MCF7 (n=14) or NCI/ADR-RES (n=13) cells transfected with luciferase reporter construct and were allowed to grow for a period of eight weeks. At week 4, a subset of each MCF7 (n=8) and NCI/ADR-RES (n=7) cohort were treated with 2mg/kg of doxorubicin weekly to assess drug resistance.
Figure 4 shows tumor growth for both untreated and doxorubicin treated mice injected with either MCF7 or NCI/ADR-RES cells. Both untreated mouse cohorts exhibit marked tumor growth over a period of 8 weeks. However, the MCF7 xenograft mouse group treated with doxorubicin exhibited a decrease in tumor growth (3.3 fold decrease when compared to untreated control group) consistent with the effects of doxorubicin on non-drug resistant tumor cells (Figure 4A). In contrast, the doxorubicin treated NCI/ADR-RES xenograft tumors exhibited no significant decrease in tumor growth when compared to the control group, reflecting the drug resistance of tumors derived from NCI/ADR-RES cells. We used these tumors to test the efficacy of CD44 immunohistochemistry at identifying drug resistant tumors in vivo. MCF7 tumors showed light staining while NCI/ADR-RES tumors exhibit an intense positive staining for CD44 on both the cell surface and cytoplasm (Figure 4B). In the untreated control group, stained sections were assessed on a −/+ to +++ scale in a blinded fashion by an examiner who correctly identified 12 out of 12 tumors as being of MCF7 or NCI/ADR-RES (100%) (Figure 4C). These findings suggest that CD44 expression does not change significantly when these cells proliferate in vivo and that CD44 surface expression is a reliable distinguishing biomarker for tumors derived from these cell lines.
Fig. 4. CD44 distinguishes MCF7 from NCI/ADR-RES derived tumors.
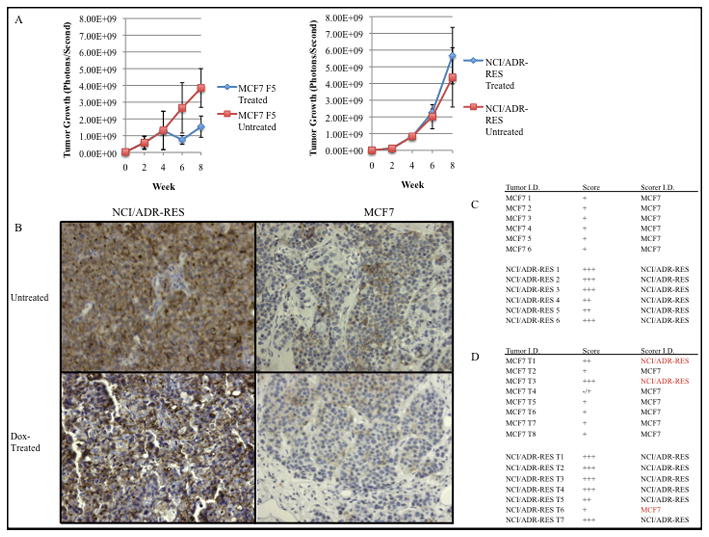
A. Analysis of average tumor growth for both treated (n=15) and untreated (n=12) tumors as indicated by light emission (photon/second) upon luciferase activity. Starting at week 4, a subset of each tumor cohort (MCF7 n=8, NCI/ADR-RES n=7) were treated with doxorubicin (2mg/kg, weekly injection) B. Immunohistochemical staining of NCI/ADR-RES cells and xenograft tumors with anti-CD44 antibody (10× magnification) C. Doxorubicin untreated tumor sections were scored for CD44 staining in a blinded fashion using (−/+)-(+++) scaled scoringD. CD44 scoring of doxorubicin treated tumors. Red type indicates tumors staining inconsistent with tumor identity.
When we examined the doxorubicin-treated cohort (n=15), a blinded examiner used CD44 staining to correctly identified 86% of the NCI/ADR-RES and 75 % of the MCF7 tumors (Figure 4D). We also used this cohort to ask if CD44 can serve as a good predictor of tumor response to drug. Using the CD44 IHC as if it were a biopsy, a blinded examiner was asked to state whether this tumor would respond to doxorubicin treatment and was correct in 12 out of 15 cases (p= 0.035). Interestingly, two of the MCF7 tumors, incorrectly identified as being of NCI/ADR-RES origin, exhibited an increased level of staining for CD44 as well as an increased growth rate comparable to CD44 + tumors. This may represent a doxorubicin dependent selection for high CD44 expressing cells in response to chemotherapy. The scoring results of the untreated IHC stained tumors, together with the doxorubicin-treated group, support our hypothesis that CD44 can distinguish between drug susceptible and drug resistant tumors derived from MCF7 and NCI/ADR-RES cells in vivo. These results further suggest that CD44 may have value in predicting tumor response to doxorubicin.
CD44 mediated doxorubicin resistance is through a mechanism separate from MDR1/pgp
We sought to determine whether CD44 has a functional role in drug resistance. While NCI/ADR-RES cells are thought to be drug resistant due to increased MDR1 expression (13, 14), other proteins may also contribute. To test if CD44 affects doxorubicin sensitivity, we used siRNA to knock down expression of CD44, MDR1 or both in NCI/ADR-RES cells and tested for viability in doxorubicin (Figure 5A). As expected, loss of expression of MDR1 by siRNA decreased this resistance significantly when compared to control (IC50=18 ug/ml ± 3, P=.0014; Figure 5A). However, siRNA knockdown of CD44 also increased sensitivity to doxorubicin by 36%, (IC50 =36 ug/ml ±4, P=.0011) indicating a role for CD44 in the observed resistance to doxorubicin. Moreover, when both MDR1 and CD44 expression were decreased via siRNA, the effects were additive, increasing NCI/ADR-RES cells susceptibility to doxorubicin by 95% (IC50= 5 ug/ml±0.5, P=.0001). These findings indicated that CD44 plays a role in doxorubicin drug resistance independent of MDR1. We tested this notion by assessing the effects of siRNA treatments on drug efflux, by measuring MDR1 transport of 3,3 diethyloxacarbocyanine iodide dye in cells treated with siRNA against MDR1 or CD44. Loss of MDR1/pgp expression results in a marked decrease (31%) in dye efflux of when compared to control, whereas loss of CD44 had no observable effect on efflux (Figure 5B). The lack of dye efflux inhibition by CD44 siRNA knockdown supports a role for CD44 in drug resistance of NCI/ADR-RES cells by a mechanism independent of MDR/pgp mediated drug efflux.
Fig 5. CD44 and MDR1/p-glycoprotein act in doxorubicin resistance by distinct mechanisms.
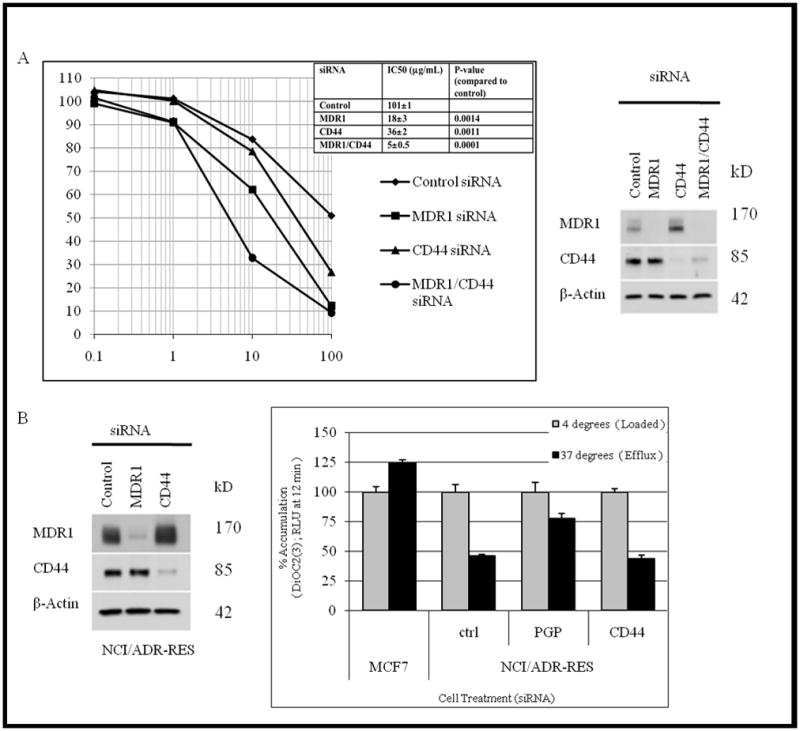
A, Independent function of CD44 and p-glycoprotein was assessed by RNAi co-knockdown (Western blot) effect on doxorubicin sensitivity. Inset table, average IC50 dose for siRNA treated cells. Data reflects average values for two separate experiments. Statistical significance was established via t-test (P< 0.05) by comparing siRNA treatment to control IC50. B, NCI/ADR-RES cells depleted of CD44 and p-glycoprotein expression was confirmed via western blot and assayed for efflux of 3,3 diethyloxacarbocyanine iodide dye to determine p-glycoprotein activity.
Elevated levels of CD44 confer drug resistance via upregulation of the anti-apoptotic protein Bcl-xL
To address CD44’s role in drug resistance, we performed several experiments aimed at defining its role in NCI/ADR-RES cells. CD44 has been implicated in preventing Death Induced Signaling Complex (DISC) formation (12, 21) which is increased by doxorubicin treatment (22). However, 90% knockdown of CD44 by siRNA caused no significant increase in DISC formation or expression of activated caspase 8, the downstream product of DISC formation (data not shown). Therefore, our findings do not support a mechanism by which CD44 inhibits DISC formation.
Another potential mechanism links increased CD44 binding of hyaluronan polymers to upregulation of Bcl-xL, an anti-apoptotic protein that has been shown to increase resistance to doxorubicin in MCF7 cells (23). Aggressive tumors have been shown to secrete hyaluronan (24) thus providing ligand to bind to CD44, thereby increasing Bcl-xL expression in cancer cells. We tested if CD44 was required for drug resistance of NCI/ADR-RES cells via a hyaluronan-mediated increase in Bcl-xL expression. Basal expression of Bcl-xL is higher in NCI/ADR-RES cells when compared to MCF7 cell lysate (Figure 6A lanes 1 and 3). When challenged with hyaluronan (~500,000 dalton) polymers capable of mimicking endogenous hyaluronan, we observed an increase in overall Bcl-xL expression, with the greatest increase observed in the NCI/ADR-RES cells, consistent with their high levels of CD44 expression (Figure 6A lanes 2 and 4). Loss of CD44 by siRNA in NCI/ADR-RES cells is sufficient to reduce Bcl-xL expression and lowers Bcl-xL levels to those comparable to MCF7 cells (lanes 5) and these cells do not exhibit an increase in Bcl-xL expression when challenged with hyaluronan (lane 6).
Fig. 6. Bcl-xL expression is increased in NCI/ADR-RES cells challenged with Hyaluronan.
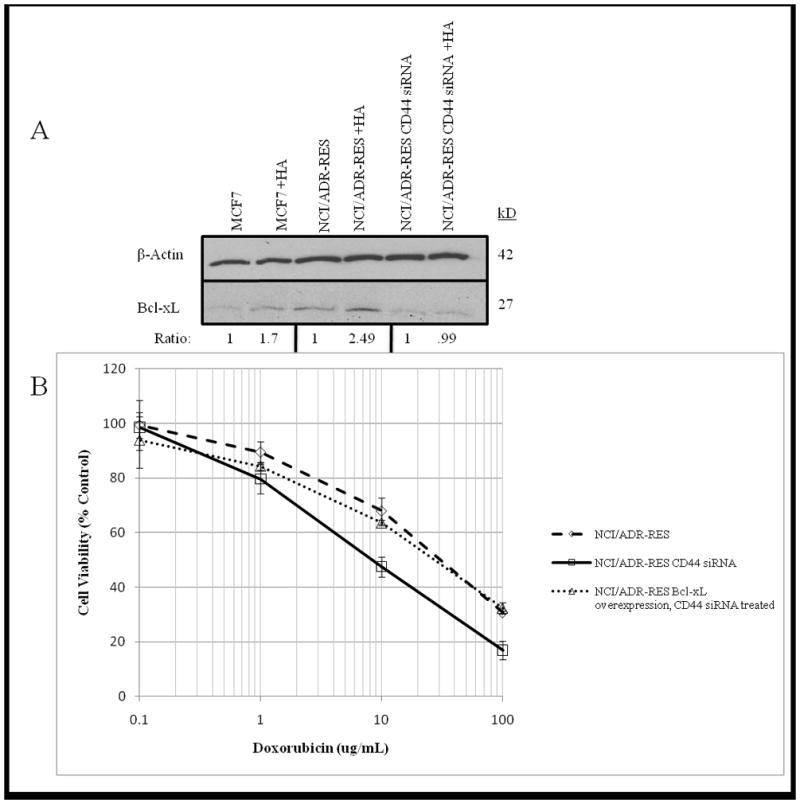
A. Bcl-xL expression was measured in serum starved MCF7, NCI/ADR-RES and CD44 siRNA NCI/ADR-RES cells treated with +/− 50 μg/ml hyaluronan polymers for 24 hours. Ratio values represent fold difference of siRNA treated lysates compared to control. β-actin expression was determined for MCF7 and NCI/ADR-RES +/− CD44 siRNA for loading control. B. Functional relevance of Bcl-xL in drug resistance was tested using NCI/ADR-RES, CD44 siRNA NCI/ADR-RES and CD44 siRNA NCI/ADR-RES cells overexpressing Bcl-xL. Cells were treated with increasing levels of Doxorubicin for 24 hours and viability was determined by CellTiter Glo assay.
While we have shown that HA binding of CD44 can induce Bcl-xL expression, functional significance of this induction for NCI/ADR-RES is not clear. To address this, we overexpressed Bcl-xL in CD44 depleted NCI/ADR-RES cells and this resulted in rescue of resistance to doxorubicin (Figure 6B).
Together, these findings support the hypothesis that CD44 acts in NCI/ADR-RES drug resistance via a hyaluronan binding leading to increased Bcl-xL production consistent with its role in MCF7 cells (23). These findings demonstrate the ability of SPS to identify CD44 as an additional and functional biomarker for drug resistance in both NCI/ADR-RES cells and tumors derived from these cells.
Discussion
Development of diagnostic tools that can accurately predict tumor response to drug would be highly useful in the clinical setting. For example, clinical diagnostic kits using FISH or CISH to measure gene amplification have already been developed to identify herceptin-responsive patients (25). Proteomic profiling has the potential to provide complementary and potentially more sensitive classification schemes for clinical tumors than those currently achieved by genomic methods. In this study, we developed SPS to begin to interrogate the surface proteome for distinguishing biomarkers. SPS illustrated how similar MCF7 and NCI/ADR-RES are with respect to their surface proteomes, despite their distinct lineages (18), explaining why it was so difficult to resolve that NCI/ADR-RES were not derived from MCF7. SPS identified CD44 as a potential biomarker for doxorubicin resistance that is highly expressed on NCI/ADR-RES cells compared to MCF7 cells. In addition, CD44 exhibited a diagnostic capability by predicting therapeutic outcome in MCF7 and NCI/ADR-RES xenograft tumors treated with doxorubicin. Furthermore, we demonstrated that CD44 acts in doxorubicin resistance independent of MDR1 and increases expression of Bcl-xL, an anti-apoptotic protein.
CD44 is ubiquitously expressed in human tissues and possesses multiple ligands such as hyaluronan, osteopontin, collagen and matrix metalloproteases (26,27,28). In addition, CD44 has been shown to be involved in numerous cellular processes such as lymphocyte activation and homing, hematopoiesis, and tumor metastasis (28). However, its role in drug resistance remains unclear. One established mechanism for CD44 mediated drug resistance is via upregulation of MDR1 in response to challenge with hyaluronan (29). Our findings indicate that CD44 also mediates drug resistance through a mechanism separate from MDR1. We tested two potential mechanisms for CD44 drug resistance and our findings support the notion that it functions as an anti-apoptotic factor through upregulation of Bcl-xL. Bcl-xL is an anti-apoptotic protein thought to counteract pro-apoptotic mitochondrial swelling by maintaining mitochondrial membrane potential through its inherent ion channel activity (30). This maintenance of mitochondrial membrane integrity prevents cytochrome-c release, thereby inhibiting apoptosis (30). Increased Bcl-xL expression has been shown to protect against chemotherapeutic induced apoptosis and serves as an indicator of poor clinical outcome in cancer (31, 32). Recent work links CD44, and it’s binding of hyaluronan, to upregulation of Bcl-xL in MCF7 cells and showed that increased CD44 mediated Bcl-xL expression confers a resistance to doxorubicin (24). Our results suggest that elevated expression of CD44 leads to an increase in Bcl-xL expression that would contribute to doxorubicin resistance in NCI/ADR-RES cells. This hypothesis is supported by the observation that overexpression of Bcl-xL in CD44 depleted NCI/ADR-RES cells is sufficient to rescue them from doxorubicin exposure. Misra et al. (29) implicated CD44 in drug resistance via its up-regulation of P-glycoprotein. Our findings suggest that elevated CD44 in tumor cells may affect apoptosis beyond drug resistance because elevated Bcl-xL inhibits apoptosis generally. Previous studies have implicated CD44 in the extrinsic apoptotic pathway through its binding to the death receptor from the DISC complex (12). Our findings support the role of CD44 in the intrinsic pathway by its increase in expression of Bcl-xL in agreement with Bourguignon et al. (2008) (23). Thus, CD44 inhibition of both the intrinsic and extrinsic pathways of apoptosis, may have a more profound effect on cancer cell survival.
Aggressive cancer cells secrete high levels of hyaluronan (33, 34, 35, 36) and hyaluronan synthases have been shown to be upregulated in cancer (37, 38). We speculate that NCI/ADR-RES derived tumors are aggressive because they highly express CD44, leading to increased expression of Bcl-xL contributing to their drug and apoptotic resistance. Thus, we envision a feedback loop in which tumors possessing elevated CD44 levels and secreting high levels of hyaluronan would increase Bcl-xL expression, thereby enabling the cells to resist apoptosis, contributing to overall tumor survival.
These studies serve as a proof of principle for SPS technology. It has an advantage over current proteomic methods such as FACS and 2-dimensional gel electrophoresis due to its potential for high-throughput. SPS technology complements high throughput scFv protein microarrays (39) by providing semi-quantitative differences in cell expression of surface protein not currently possible with scFv microarrays. Our studies demonstrated SPS using an unbiased scFv library against surface proteins, thus extending high throughput analyses beyond microarrays using only known surface antigens (39). A further advantage of SPS is that it is both general and scalable. Our current scFv library is composed of 700 scFvs. However, SPS using larger-scale antibody libraries with greater diversity could address a greater fraction of the whole proteome. In principle, the dynamic range of proteomic expression can be addressed for SPS by using different numbers of cells to address antigens of differing copy number. For example, high expressers such as CD44 only require 2,000 cells to observe significant quantitative fluorescence signals, but when lower expressing antigens such as CD155 are used, 20,000 cells are needed (data not shown).
These studies show the value of SPS in identifying novel biomarkers for potential use in clinical diagnosis through the established diagnostic method of clinical immunohistochemistry. Our in vitro and in vivo analyses suggest the potential value for CD44 as a biomarker for patient samples. For clinical application of SPS, we envision its major use will be to identify a panel of biomarkers for multiple aspects of tumor biology, including drug resistance, which would then be assessed by immunohistochemistry of clinical samples. Theoretically, SPS technology could be directly applied to clinical samples obtained from surgical debulking, but detecting differences in low abundance surface proteins would require large numbers of cells.
Materials and Methods
Cell Culture
HT-1080 fibrosarcoma cells were obtained from American Type Culture Collection (Manassas, VA). MCF7 and NCI/ADR-RES cells were a gift of Jerry Faust (Tufts University). Cells were maintained in either DMEM (HT1080) or IMEM (MCF7, NCI/ADR-RES) with 10% fetal bovine serum, penicillin/streptomycin and 0.1 mmol/L nonessential amino acids ((Invitrogen, Carlsbad, CA; HyClone, Logan, UT). MCF7 and NCI/ADR-RES were supplemented with 2% L-Glutamine (Invitrogen, Carlsbad, CA). For hyaluronan treatment, cells were serum starved for 24 hours prior to treatment in DMEM supplemented with penicillin/streptomycin and dosed with 50 μg/ml Hyalose hyaluronan (~500,000 dalton polymers) for 24 hours prior to western blot (Lifecore Biomedical, Chaska, MN). All cells were cultured at 37°C under a humidified 5% CO2 atmosphere.
Luciferase transfection of MCF7 and NCI/ADR-RES
2×10⁵ of MCF7 or NCI/ADR-RES cells were plated in a 6 well plate and co-transfected with TK Hygro hygromycin resistance vector and pGL4.13[luc2/SV40] (Invitrogen, Carlsbad, CA) luciferase expression vector at a 1:10 ratio using Lipofectamine 2000 as per manufacturer’s instructions. Cells were incubated at 37°C, 5% CO2, for 48 hours in media supplemented with .26mg/ml Hygromycin (Sigma, St. Louis, MO) for selection. Luciferase transfection was confirmed using Dual-Glo (Promega, Madison, WI) luciferase assay system as per manufacturer’s instructions.
Overexpression of Bcl-xL
2×10⁵ of CD44 siRNA treated NCI/ADR-RES cells were plated in a 6 well plate and transfected with a Bcl-xL expression vector (Origene, Rockland, MD) at a 1:10 ratio using Lipofectamine 2000 as per manufacturer’s instructions. Cells were incubated at 37°C, 5% CO2, for 48 hours in appropriate media and expression was measured via western blot.
Cell Surface Single-Chain Variable Fragment Antibody (scFv) Library Generation
Development of the SPS scFv library by our lab has been previously described (10). ScFv expressing E. Coli were prepared in 2YT media supplemented with 100μg/ml Ampicillin overnight (Invitrogen, Carlsbad, CA; Sigma, St. Louis, MO) and scFv production was induced by adding 1.5 mM IPTG (Sigma, St. Louis, MO). Cells were lysed in PBS/0.2mg/ml lysozyme/EDTA free protease inhibitor solution (Sigma, St. Louis, MO; Roche Diagnostics, Basel, Switzerland) and centrifuged at 4000 rpm for 15 minutes to isolate scFv-supernatant.
SPS Assay
2×10⁴ cells per well of MCF7, NCI/ADR-RES, or HT1080 were aliquoted in poly-d-lysine coated 96-well plates (Greiner Bio-One, Frickhausen. Germany) and incubated overnight. Cells were washed with 10% FBS/PBS and incubated for one hour with a 1:1000 dilution of anti p-glycoprotein (Kamiya Biomedical, Seattle, WA) or scFvs. Cells were washed with 0.1%BSA/PBS and fixed with 2% para-formaldehyde (Sigma, St. Louis, MO). All scFv-treated cells were incubated with a 1:200 dilutions of mouse anti E-tag antibody (Amersham, Piscataway, NJ), Alexa488 rabbit anti-mouse and Alexa488 goat anti-rabbit antibodies (Invitrogen, Carlsbad, CA). Additional washes of 0.1%BSA/PBS were performed and cells were lysed in 1%SDS/10mM Tris solution to solubilize scFv signal (Sigma, St. Louis, MO). ScFv binding was measured as fluorescent output as read on SPECTRAFluor plus plate reader set to measure with optimal gain (Tecan, Palm Springs, CA). Values were background subtracted and normalized to the scFv 2a6 value to determine relative fluorescence. Comparisons looking for potential biomarkers were plotted on a log2 scale and defined as having a two-fold change in signal magnitude and being statistically significant (p < 0.01) as measured by unpaired t test. Immunofluorescent microscopy analysis was performed prior to solubilization and cells were imaged using an Axiovert 10 microscope (Carl Zeiss, Thornwood, NY) and analyzed using OpenLab software (Improvision, Lexington, MA).
siRNA Knockdown
A double-stranded siRNA oligonucleotides targeting CD44 (5′-GAACGAAUCCUGAAGACAUdTdT-3′), p-glycoprotein encoding gene MDR1 (5′-GGAAGGCCUAAUGCCGAAdTdT-3′) and CD155/PVR (5′-CAACUUUAAUCUGCAACGUdTdT-3′) were chemically synthesized (Dharmacon, Lafayette, CO) and transfected into cells using Oligofectamine (Invitrogen, Carlsbad, CA) per manufacturer’s instructions using 200 nM siRNA per 10 cm dish. Cells were incubated with siRNA in OptiMEM (Invitrogen, Carlsbad, CA) for 6 hours after which normal growth media was added. After a 48-hour incubation period, knockdown was measured by immunoblot with appropriate antibody. Control cells were transfected with a scrambled siRNA oligonucleotide at matching concentration.
Immunoblotting
Immunoblotting was performed as previously described (11). Blots were reacted with mouse anti p-glycoprotein (1:1000) (Kamiya Biomedical, Seattle, WA), CD44 clone 2C5 (1:1000) (Chemicon, Temecula, CA), Bcl-xL (1:1000) (Cell Signaling, Beverly, MA), PVR/CD155 (D171) (1:1000) (Abcam, Cambridge, MA) or mouse β-actin (1:1000) (Sigma, St. Louis, MO). Primary antibodies were detected after enhanced chemiluminescence (Perkin-Elmer, Boston, MA) using peroxidase-conjugated anti-mouse (Cell Signaling, Beverly, MA) and anti-rabbit (Jackson ImmunoResearch, West Grove, PA) immunoglobulin G. The secondary antibodies were initially applied to fresh blots as negative antibody controls. Densitometry analysis was performed using ImageJ software (NIH, Bethesda, MD).
Doxorubicin Viability Assay
MCF7, NCI/ADR-RES or siRNA treated cells were aliquoted 2×10⁴ cells per well, in triplicate, and incubated for 5 hours prior to treatment. Cells were exposed to increasing levels of doxorubicin (Sigma, St. Louis, MO), allowed to incubate for 24 hours and assayed for viability with CellTiter-Glo (Promega, Madison, WI) reagent, as per manufacturer instructions. Luminescence was measured via SPECTRAFluor plus plate reader (Tecan, Palm Springs, CA) and a standard curve was used to determine number of viable cells per well.
In Vivo Mouse Analysis
27 C.B.-17 SCID (Charles River Labs, Cambridge, MA) mice lacking a functional immune system were subcutaneously implanted with 0.36 mg 17 β-estradiol time-release pellet (Innovative Research of America, Sarasota, FL) three days prior to tumor cell injection to provide supplemental estrogen. Luciferase reporter construct transfected MCF7 and NCI/ADR-RES cells were mixed in a one-to-one ratio with Matrigel HC (BD Biosciences, San Jose, CA) to facilitate tumor seeding. Total of 2×10⁶ cells were injected using a 16-gauge needle subcutaneous to the nipple and allowed to grow for 8 weeks. A subset of MCF7 (n=8) and NCI/ADR-RES (n=7) mice were treated weekly with 2mg/kg doxorubicin (Sigma, St. Louis, MO) injections starting at week 4. After 8 weeks mice were sacrificed by CO2 asphyxiation and tumors were resected.
Xenogen Imaging
Tumor growth was tracked weekly using the Xenogen IVIS 200 in vivo imaging system (Caliper Life Sciences, Hopkinton MA) to measure luciferase cleavage of 100λ luciferin (10mg/ml) injections. Living Image (Caliper Life Sciences, Hopkinton MA) software was used to measure tumor growth as a function of light emitted (photons/second) by luciferase activity.
Immunohistochemistry
Resected tumors from sacrificed mice were fixed in 10% formalin (Sigma, St. Louis, MO), paraffin embedded, and sectioned to 5 μm thickness. Immunostaining was performed using the avidin-biotin-peroxidase method (Vector Labs, Burlingame, CA) as per manufacturer’s protocol. Briefly, endogenous peroxidase activity was inhibited by exposure to a 3% H2O2 solution (Fisher Scientific, Pittsburgh, PA), unspecific antigen sites were blocked with 10% normal horse serum (Vector Labs, Burlingame, CA) and sections were incubated overnight at 4°C with human specific anti-CD44 antibody (1:1000) (Chemicon, Temecula, CA). Stained tumors were imaged using an Axiovert 10 microscope at 10 × magnification (Carl Zeiss, Thornwood, NY) and analyzed using OpenLab software (Improvision, Lexington, MA).
DiOC(3) Efflux Assay
The P-glycoprotein fluorescent substrate 3,3-diethyloxacarbocyanine iodide, DiOC(3), (Sigma, St. Louis, MO) was added to 96 well format plate containing MCF7, NCI/ADR-RES and NCI/ADR-RES cells treated with siRNA against CD44 and MDR1, for a final concentration of 1.5 ng/ml, at 4°C. Plates containing DiOC (3) loaded cells were immediately measured for dye content as a function of total fluorescence using the SPECTRAFluor plus plate reader (Tecan, Palm Springs, CA). After 12 minutes incubation at 37°C, an additional reading was taken and correlated to initial 4°C results to measure p-glycoprotein activity.
Supplementary Material
Acknowledgments
Grant Support: R33 CA103548
References
- 1.Koscielny S. Critical review of microarray-based prognostic tests and trials in breast cancer. Curr Opin Obstet Gynecol. 2008;20(1):47–50. doi: 10.1097/GCO.0b013e3282f39d9e. [DOI] [PubMed] [Google Scholar]
- 2.O’Driscoll L, Clynes M. Biomarkers and multiple drug resistance in breast cancer. Curr Cancer Drug Targets. 2006 Aug;6(5):365–84. doi: 10.2174/156800906777723958. [DOI] [PubMed] [Google Scholar]
- 3.Perou CM, Sorlie T, Eisen MB, et al. Molecular portraits of human breast tumours. Nature. 2000 Aug 17;406(6797):747–52. doi: 10.1038/35021093. [DOI] [PubMed] [Google Scholar]
- 4.Lonning PE, Sorlie T, Borresen-Dale AL. Genomics in breast cancer-therapuetic implications. Nat Clin Pract Oncol. 2005 Jan;2(1):26–33. doi: 10.1038/ncponc0072. [DOI] [PubMed] [Google Scholar]
- 5.Zhang Z, Chen D, Fenstermacher DA. Integrated analysis of independent gene expression microarray datasets improves the predictability of breast cancer outcome BMC. Genomics. 2007 Sept;8:331. doi: 10.1186/1471-2164-8-331. [DOI] [PMC free article] [PubMed] [Google Scholar]
- 6.Villeneuve DJ, Hembruff SL, Veitch Z, Cecchetto ZM, Dew WA, Parissent AM. cDNA microarray analysis of isogenic paclitaxel- and doxorubicin-resistant breast tumor cell lines reveals distinct drug-specific genetic signatures of resistance. Breast Cancer Res Treat. 2006 Mar;96(1):17–39. doi: 10.1007/s10549-005-9026-6. [DOI] [PubMed] [Google Scholar]
- 7.Lander ES, Linton LM, Birren B, et al. Initial sequencing and analysis of the human genome. Nature. 2001 Feb 15;409(6822):860–921. doi: 10.1038/35057062. [DOI] [PubMed] [Google Scholar]
- 8.Venter JC, Adams MD, Myers EW, et al. The sequence of the human genome. Science. 2001 Feb 16;291(5507):1304–51. doi: 10.1126/science.1058040. [DOI] [PubMed] [Google Scholar]
- 9.Pandey A, Mann M. Proteomics to study genes and genomes. Nature. 2000 Jun 15;405(6788):837–46. doi: 10.1038/35015709. [DOI] [PubMed] [Google Scholar]
- 10.Eustace BK, Sakurai T, Stewart JK, et al. Functional proteomic screens reveal an essential extracellular role for hsp90 in cancer cell invasiveness. Nat Cell Biol. 2004 Jun;6(6):507–14. doi: 10.1038/ncb1131. [DOI] [PubMed] [Google Scholar]
- 11.Sloan KE, Eustace BK, Stewart JK, et al. CD155/PVR plays a key role in cell motility during tumor cell invasion and migration. BMC Cancer. 2004 Oct 7;4:73. doi: 10.1186/1471-2407-4-73. [DOI] [PMC free article] [PubMed] [Google Scholar]
- 12.Hauptschein RS, Sloan KE, Torella C, et al. Functional proteomic screen identifies a modulating role for CD44 in death receptor-mediated apoptosis. Cancer Res. 2005 Mar 1;65(5):1887–96. doi: 10.1158/0008-5472.CAN-04-3571. [DOI] [PubMed] [Google Scholar]
- 13.Batist G, Tulpule A, Sinha BK, Katki AG, Myers CE, Cowan KH. Overexpression of a novel anionic glutathione transferase in multidrug-resistant human breast cancer cells. J Biol Chem. 1986 Nov 25;261(33):15544–9. [PubMed] [Google Scholar]
- 14.Cowan KH, Batist G, Tulpule A, Sinha BK, Myers CE. Similar biochemical changes associated with multidrug resistance in human breast cancer cells and carcinogen-induced resistance to xenobiotics in rats. Proc Natl Acad Sci USA. 1986 Dec;83(24):9328–32. doi: 10.1073/pnas.83.24.9328. [DOI] [PMC free article] [PubMed] [Google Scholar]
- 15.Kawasaki K, Watanabe M, Sakaguchi M, et al. REIC/Dkk-3 overexpression downregulates P-glycoprotein in multidrug-resistant MCF7/ADR cells and induces apoptosis in breast cancer. Cancer Gene Ther. 2009 Jan;16(1):65–72. doi: 10.1038/cgt.2008.58. [DOI] [PubMed] [Google Scholar]
- 16.Sinha BK, Katki AG, Batist G, Cowan KH, Myers CE. Adriamycin-stimulated hydroxyl radical formation in human breast tumor cells. Biochem Pharmacol. 1987 Mar 15;36(6):793–6. doi: 10.1016/0006-2952(87)90164-x. [DOI] [PubMed] [Google Scholar]
- 17.Scudiero DA, Monks A. Cell line designation change: multidrug-resistant cell line in the NCI anticancer screen. J Natl Cancer Inst. 1998 Jun 3;90(11):862. doi: 10.1093/jnci/90.11.862. [DOI] [PubMed] [Google Scholar]
- 18.Mehta K, Devarajan E, Chen J, Multani A, Pathak S. Multidrug-Resistant MCF-7 Cells: An Identity Crisis? J Natl Cancer Inst. 2002 Nov 6;94(21):1652–4. doi: 10.1093/jnci/94.21.1652-b. [DOI] [PubMed] [Google Scholar]
- 19.Liscovitch M, Ravid DA. A case study in misidentification of cancer cell lines: MCF-7/AdrR cells (re-designated NCI/ADR-RES) are derived from OVCAR-8 human ovarian carcinoma cells. Cancer Lett. 2007 Jan 8;245(1–2):350–2. doi: 10.1016/j.canlet.2006.01.013. [DOI] [PubMed] [Google Scholar]
- 20.Hathout Y, Gehrmann ML, Chertov A, Fenselau C. Proteomic phenotyping: metastatic and invasive breast cancer. Cancer Lett. 2004 Jul 16;210(2):245–53. doi: 10.1016/j.canlet.2004.01.019. [DOI] [PubMed] [Google Scholar]
- 21.Mielgo A, van Driel M, Bloem A, Landmann L, Günthert U. A novel antiapoptotic mechanism based on interference of Fas signaling by CD44 variant isoforms. Cell Death Differ. 2006 Mar;13(3):465–77. doi: 10.1038/sj.cdd.4401763. [DOI] [PubMed] [Google Scholar]
- 22.Dumitru CA, Carpinteiro A, Trarbach T, Hengge UA, Gulbins E. Doxorubicin enhances TRAIL-induced cell death via ceramide-enriched membrane platforms. Apoptosis. 2007 Aug;12(8):1533–41. doi: 10.1007/s10495-007-0081-9. [DOI] [PubMed] [Google Scholar]
- 23.Bourguignon LY, Xia W, Wong G. Hyaluronan-mediated CD44 interaction with p300 and SIRT1 regulates beta-catenin signaling and NFkappaB-specific transcription activity leading to MDR1 and Bcl-xL gene expression and chemoresistance in breast tumor cells. J Biol Chem. 2009 Jan 30;284(5):2657–71. doi: 10.1074/jbc.M806708200. [DOI] [PMC free article] [PubMed] [Google Scholar]
- 24.Toole BP. Hyaluronan: from extracellular glue to pericellular cue. Nature Reviews Cancer. 2004 Jul;4:528–39. doi: 10.1038/nrc1391. [DOI] [PubMed] [Google Scholar]
- 25.Cayre A, Mishellany F, Lagarde N, Penault-Llorca F. Comparison of different commercial kits for HER2 testing in breast cancer: looking for the accurate cutoff for amplification. Breast Cancer Res. 2007;9(5):R64. doi: 10.1186/bcr1770. [DOI] [PMC free article] [PubMed] [Google Scholar]
- 26.Gotte M, Yip GW. Heparanase, hyaluronan, and CD44 in cancers: a breast carcinoma perspective. Cancer Res. 2006 Nov 1;66(21):10233–7. doi: 10.1158/0008-5472.CAN-06-1464. [DOI] [PubMed] [Google Scholar]
- 27.Wai PY, Kuo PC. Osteopontin: regulation in tumor metastasis. Cancer Metastasis Rev. 2008 Mar;27(1):103–18. doi: 10.1007/s10555-007-9104-9. [DOI] [PubMed] [Google Scholar]
- 28.Marhaba R, Zöller M. CD44 in cancer progression: Adhesion, migration and growth regulation. J Mol Histol. 2004 Mar;35(3):211–31. doi: 10.1023/b:hijo.0000032354.94213.69. [DOI] [PubMed] [Google Scholar]
- 29.Misra S, Ghatak S, Toole BP. Regulation of MDR1 expression and drug reisistance by a positive feedback loop involving hyaluronan, phosphoinositide 3-kinase, and ErbB2. J Biol Chem. 2005 May 27;280(21):20310–5. doi: 10.1074/jbc.M500737200. [DOI] [PubMed] [Google Scholar]
- 30.Minn AJ, Kettlun CS, Liang H, et al. Bcl-xL regulates apoptosis by heterodimerization-dependent and -independent mechanism. EMBO J. 1999 February 1;18(3):632–643. doi: 10.1093/emboj/18.3.632. [DOI] [PMC free article] [PubMed] [Google Scholar]
- 31.Olapadu OI, Adeyanju MO, Safa AR, Hagos F, Mick R, Thompson CB. Overexpression of Bcl-x protein in primary breast cancer is associated with high grade and nodal metastases. Cancer J Sci Am. 1997 Jul-Aug;3:230–7. [PubMed] [Google Scholar]
- 32.Schmitt E, Sané AT, Steyaert A, Cimoli G, Bertrand R. The Bcl-xL and Bax-alpha control points: modulation of apoptosis induced by cancer chemotherapy and relation to TPCK-sensitive protease and caspase activation. Biochem Cell Biol. 1997;75(4):301–14. [PubMed] [Google Scholar]
- 33.Kimata K, Honma Y, Okayama M, Oguri K, Hozumi M, Suzuki S. Increased synthesis of hyaluronic acid by mouse mammary carcinoma cell variants with high metastatic potential. Cancer Res. 1983;43:1347–54. [PubMed] [Google Scholar]
- 34.Ropponen K, Tammi M, Parkkinen J, et al. Tumor cell-associated hyaluronan as an unfavorable prognostic factor in colorectal cancer. Cancer Res. 1998;58:342–47. [PubMed] [Google Scholar]
- 35.Setälä L, Tammi M, Tammi R, et al. Hyaluronan expression in gastric cancer cells is associated with local and nodal spread and reduced survival rate. Br J Cancer. 1999;79:1133–38. doi: 10.1038/sj.bjc.6690180. [DOI] [PMC free article] [PubMed] [Google Scholar]
- 36.Auvinen P, Tammi R, Parkkinen J, et al. Hyaluronan in peritumoral stroma and malignant cells associates with breast cancer spreading and predicts survival. Am J Pathol. 2000 Feb;156(2):529–36. doi: 10.1016/S0002-9440(10)64757-8. [DOI] [PMC free article] [PubMed] [Google Scholar]
- 37.Kanomata N, Yokose T, Kamijo T, et al. Hyaluronan synthase expression in pleural malignant mesotheliomas. Virchows Arch. 2005 Mar;446(3):246–50. doi: 10.1007/s00428-004-1197-8. [DOI] [PubMed] [Google Scholar]
- 38.Li Y, Li L, Brown TJ, Heldin P. Silencing of hyaluronan synthase 2 suppresses the malignant phenotype of invasive breast cancer cells. Int J Cancer. 2007 Jun 15;120(12):2557–67. doi: 10.1002/ijc.22550. [DOI] [PubMed] [Google Scholar]
- 39.Dexlin L, Ingvarsson J, Frendéus B, Borrebaeck CA, Wingren C. Design of recombinant antibody microarrays for cell surface membrane proteomics. J Proteome Res. 2008 Jan;7(1):319–27. doi: 10.1021/pr070257x. [DOI] [PubMed] [Google Scholar]
Associated Data
This section collects any data citations, data availability statements, or supplementary materials included in this article.