Abstract
Background
Parenteral zanamivir is a promising drug for the treatment of severe influenza. However, quantification of this polar drug in biological matrices has traditionally been difficult and the methods developed have been relatively insensitive.
Results
A high-throughput bioanalytical method for the ana lysis of zanamivir in human plasma using SPE in the 96-well plate format and LC coupled to positive MS/MS has been developed and validated according to US FDA guidelines. The method uses 50 μl of plasma and covers a large working range from 1–50, 000 ng/ml with a LOD of 0.50 ng/ml.
Conclusion
This new LC–MS/MS assay is more sensitive than previous methods despite using a small plasma volume sample. It is particularly suitable for clinical studies on both parenteral and inhaled zanamivir.
Pandemic influenza is a global public health threat with the potential to cause enormous loss of life. Pandemics have occurred approximately every 40 years or so during the last 500 years [1]. Approximately 13 years ago there was an outbreak of a highly lethal avian influenza (H5N1) infection in humans in Hong Kong. The second wave came in 2003 and spread rapidly throughout southeast Asia causing a very high mortality in both the avian and human populations [2]. Many predicted that H5N1 would become the next pandemic influenza [2,3], but instead it was H1N1 that caused the recent pandemic that began in early 2009 in Mexico. The H1N1 pandemic caused many countries to stock-pile antiviral drugs and initiate mass vaccination programs [4–7]. Treatment options are limited in severely ill patients with influenza as the neuraminidase inhibitors oseltamivir (Tamiflu®) and zanamivir (Relenza®) are only available in oral and inhaled formulations, respectively [8]. Parenteral formulations of both zanamivir and peramivir are under development [9,10].
There are a few published methods for quantification of zanamivir in biological fluids. One of the first methods used precolumn derivatization and fluorescence detection to quantify zanamivir over the calibration range 10 to 800 ng/ml using a 1-ml serum sample [11]. Another method used column-switching and UV detection to quantify zanamivir in urine over the concentration range 0.3 to 100 μg/ml [12]. Allen et al. published a method using solid-phase extraction (SPE) and MS to quantify zanamivir in serum over the range 10 to 5,000 ng/ml using a 0.2-ml sample [13]. Recently, Baughman et al. published a method using protein precipitation and hydrophilic interaction LC (HILIC) to quantify zanamivir over the range 2 to 10,000 ng/ml in rat and monkey plasma [14]. This method used a stable isotope-labeled (SIL) internal standard and showed good results. However, it was not validated according to US FDA guidelines and in particular, was not evaluated for matrix effects as stipulated for hyphenated techniques. The aim of this project was to develop a selective, robust, high-throughput and sensitive assay for the analysis of zanamivir over a broad concentration range (1 to 50,000 ng/ml) using a small sample volume (50 μl) of human plasma and to validate it against FDA guidelines [15,16].
Experimental section
Chemicals & materials
Zanamivir and its SIL internal standard were obtained from GlaxoSmithKline (Stevenage, UK). The structures are shown in Figure 1. Peramivir was obtained from Biocryst (AL, USA). Oseltamivir and oseltamivir carboxylate were obtained from F Hoffmann-La Roche Ltd (Basel, Switzerland). Acetonitrile (HPLC-grade), methanol (HPLC-grade) and water (HPLC-grade) were obtained from JT Baker (NJ, USA). Ammonium acetate (LC–MS grade) was from Fluka (Sigma-Aldrich, MO, USA). Ammonium acetate buffer solutions were prepared by dissolving appropriate amounts of ammonium acetate in water and adjusting to pH 3.5 with acetic acid (Merck Darmstadt, Germany).
Figure 1.
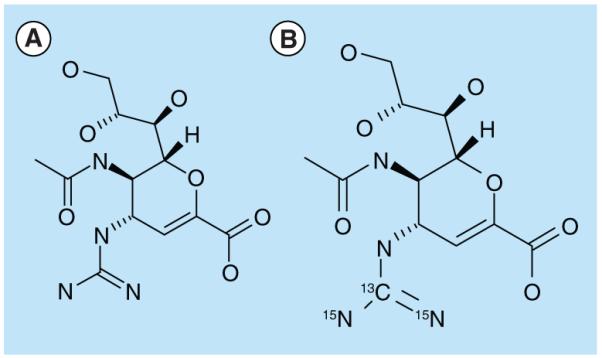
Zanamivir and stable isotope-labeled zanamivir.
Instrumentation: LC–MS
Sample preparation and SPE was performed automatically on a Freedom Evo 200 platform (TECAN, Mannedorf, Switzerland). The LC system was an Agilent 1200 system consisting of a binary LC pump, a vacuum degasser, a temperature-controlled micro-well plate autosampler set at 20°C and a temperature-controlled column compartment set at 20°C (Agilent technologies, CA, USA). Data acquisition and quantification were performed using Analyst 1.4 (Applied Biosystems/MDS Sciex, CA, USA). Zanamivir and its internal standard were analyzed on a ZIC-HILIC (5 μm, 50 × 2.1 mm) column protected by a ZIC-HILIC guard column (16 × 1.0 mm) (Merck Sequant, Umea, Sweden) at a flow rate of 500 μl/min. The LC gradient program is listed in Table 1. An API 5000 triple quadrupole mass spectrometer (Applied Biosystems/MDS Sciex) with a TurboV ionization source (TIS) interface operating in the positive ion mode, was used for the multiple reaction monitoring LC–MS/MS analysis. The MS conditions were optimized by infusing a 50-ng/ml standard solution in mobile phase at 10 μl/min using a Harvard infusion pump directly connected to the mass spectrometer. An additional optimization step was performed by continuously infusing the same standard solution at 20 μl/min via a ‘T’ connector into the postcolumn mobile phase flow (500 μl/min). The TIS temperature was maintained at 600°C and the TIS voltage was set at 5500 V. The curtain gas was set to 25.0 psi and the nebulizer (GS1) and TIS (GS2) gases at 45.0 and 60.0 psi, respectively. The collision-associated dissociation gas in the collision cell was set to 6 psi. Quantification was performed using selected reaction monitoring for the transitions m/z 333–60 and 336–63 for zanamivir and SIL-zanamivir, respectively.
Table 1.
LC gradient program.
Aqueous ammonium acetate 10 mM (+1% acetic acid, v/v).
Acetonitrile.
Preparation of standards
Stock solutions of zanamivir (2 mg/ml) and SIL-zanamivir (1 mg/ml) were prepared in water and working solutions were prepared by serial dilution in water. Calibration standards and quality control (QC) samples were prepared by adding 20–200 μl working solution to human fluoride/oxalate plasma. The total content of working solution was less than or equal to 2.5% of the total plasma volume in all cases except for the over-curve dilution sample where it was 10%. Since the method was intended for studies both of parenteral and inhaled zanamivir it was validated over two calibration ranges. The ‘high’ calibration curve ranged from LLOQ 50 ng/ml to ULOQ 50,000 ng/ml . The ‘low’ calibration curve ranged from LLOQ 1 ng/ml to ULOQ 1000 ng/ml. A calibration curve was constructed using 50 μl of each standard (n = 6) in duplicate. Two blank samples, one with and one without internal standard were processed with each standard curve. Linear regression with peak area ratio (zanamivir/SIL-zanamivir) against concentration with 1/concentration2 (x2) weighting was used for quantification. QC samples for determination of accuracy and precision at three concentrations (three-times LLOQ, midrange and upper range) were prepared in the same manner as the calibration standards and stored at −86°C until analysis. The calibration standards and QC samples were stored in cryovials at −86°C until analysis. A working solution of SIL-zanamivir (30 μg/ml) was stored in 1-ml aliquots at −86°C until use when it was thawed and diluted with water. The final concentration of SIL-zanamivir was 2500 ng/ml for the ‘high’ range and 104 ng/ml for the ‘low’ range. The stock solution of SIL-zanamivir was stored at −86°C until use.
Analytical procedure
All sample preparation steps were performed automatically on the Freedom Evo 200 platform. The internal standard solution was 2500 ng/ml for the ‘high’ range and 104 ng/ml for the ‘low’ range). A 100-μl aliquot of standard was added to a 1-ml 96-well plate placed on a Te-shake (i.e., mixing station), then 50 μl of plasma was added to each well. The sample plate was set to mix on the Te-shake at 800 rpm while plasma proteins were precipitated with 250 μl of acetonitrile followed by 50 μl of 3% aqueous acetic acid. The 96-well plate was then removed from the platform and covered with a seal mat and centrifuged at 1100 × g for 5 min while the Freedom Evo platform conditioned the SCX (50 mg, standard format) SPE 96-well plate (Biotage AB, Uppsala, Sweden). The SPE plate was activated by adding 1000 μl of methanol followed by 500 μl 10% aqueous acetic acid. Both solutions were passed through the SPE beds using the vacuum station on the Freedom Evo platform. The vacuum was controlled from the software and was set to approximately 6 bar. The centrifuged plate was placed back on the Te-shake and 250 μl of the supernatant (total sample volume 450 μl) was loaded directly from the protein precipitated sample onto the SPE plate and was then passed through the SPE bed. The vacuum started at low values and was increased continuously until all samples had passed through the SPE plate. For the ‘low’ range, the SPE plate was washed with acetonitrile:10% acetic acid (70:30, v/v) 1000 μl followed by 1000 μl of water. No washing step was required for the ‘high’ range. Full vacuum was thereafter applied for approximately 40 min to dry the SPE bed completely. The sample was eluted using 900 μl of methanol:water:triethylamine (45:45:10, v/v/v), which was passed through the SPE beds using a low vacuum. For the ‘high’ range, the eluates were mixed by aspiration/dispensation (300 μl) five times before 300 μl (out of a total 900 μl) was transferred to a new 96-well plate and evaporated. The dried eluates were reconstituted in 700 μl of acetonitrile:7.5 mM ammonium acetate:acetic acid (70:29.7:0.3, v/v/v) covered with a Nunc seal mat and mixed on a Mixmate at 850 rpm for 10 min. A volume of 2.5 μl was injected into the LC–MS/MS system. For the ‘low’ range the whole volume of the eluates were evaporated. The dried eluates were reconstituted in 250 μl of acetonitrile:7.5-mM ammonium acetate:acetic acid (70:29.7:0.3, v/v/v) covered with a Nunc seal mat and mixed on a Mixmate at 850 rpm for 10 min. A volume of 10 μl was injected into the LC–MS/MS system.
Validation
The method was subject to a full validation according to FDA guidelines [15,16]. The regression model for the calibration curve was evaluated using standards and QC samples obtained over 4 days. The regression model was chosen on the basis of back-calculated concentrations for the calibration curve together with predicted QC samples [17]. Precision and accuracy were assessed by analysis of five samples at three different concentrations throughout the calibration range (three-times LLOQ, mid-range and upper range) daily over 4 days. LLOQ and ULOQ were evaluated by analysis of three (‘high’ range) and five (‘low’ range) replicates over 4 days. Carryover effects were evaluated by injection of blank samples directly after injection of the highest point in the calibration curve. The possibility of diluting samples exceeding the ULOQ was evaluated through analysis of three (‘high’ range) and five (‘low’ range) replicates of a plasma sample spiked to concentrations exceeding ULOQ over 4 days. For the ‘high’ range, plasma was spiked to 200, 000 ng/ml and diluted by five to 40, 000 ng/ml with blank plasma before analysis. For the ‘low’ range, plasma was spiked to 20, 000 ng/ml and diluted 100 times to 200 ng/ml with blank plasma before analysis. Intra-, inter- and total-assay precisions were calculated using analysis of variance (ANOVA). The stability of zanamivir in human fluoride/oxalate plasma was evaluated during three freeze–thaw cycles, at ambient temperature for 48 h, at 4°C for 48 h and at 60°C for 1 h. Bench-top stability of zanamivir, ready for extraction and in the autosampler, was evaluated for 4 and 24 h, respectively. Three replicates of the lowest and highest QC sample at each condition was evaluated to assess stability. Stability was confirmed if the concentration found was within ±5% of the nominal concentration. Selectivity was evaluated by analysis of blank plasma samples from six different donors. The potential interference of zanamivir and SIL-zanamivir on each other was also evaluated. Recovery was determined by comparing the peak area for extracted QC samples with samples in reconstitution solution of the same nominal concentrations as the QC samples after extraction. Matrix effects were evaluated using blank plasma from six different donors. Quantitatively, matrix effects were assessed by comparing the peak area for QC samples spiked in reconstitution solution with extracted blank matrix spiked with the same nominal concentration of the analytes. Graphical evaluation of the matrix effects was performed through postcolumn infusion experiments. A solution containing 30 ng/ml zanamivir/SIL-zanamivir was infused at 10 μl/min through a T-connector into the LC column eluent and introduced to the mass spectrometer while samples to be tested were injected.
Results & discussion
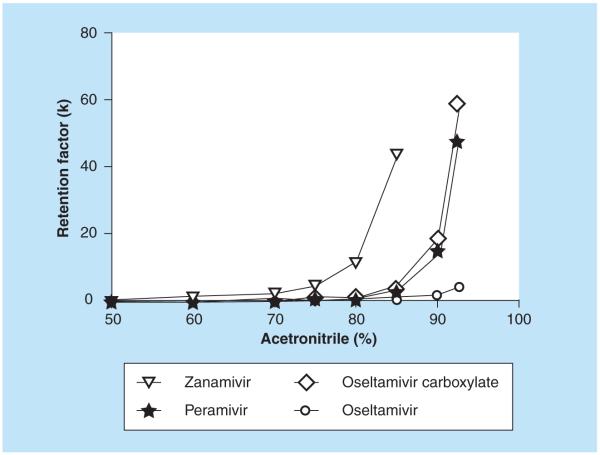
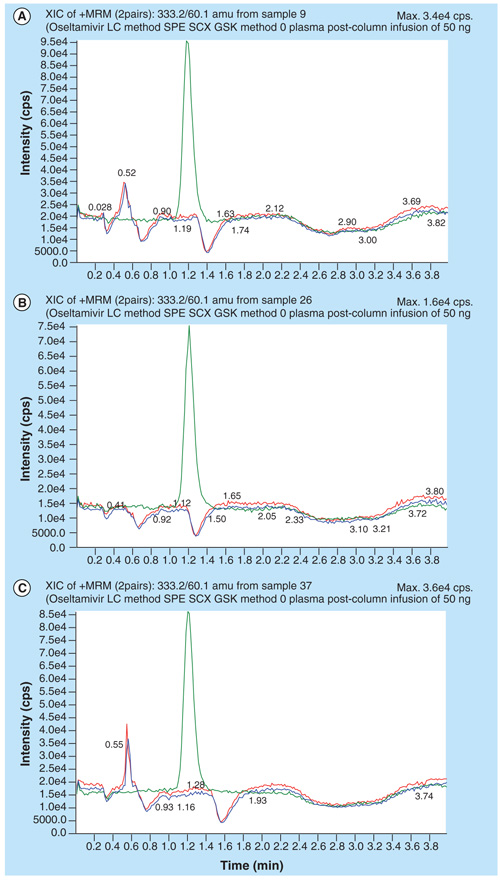
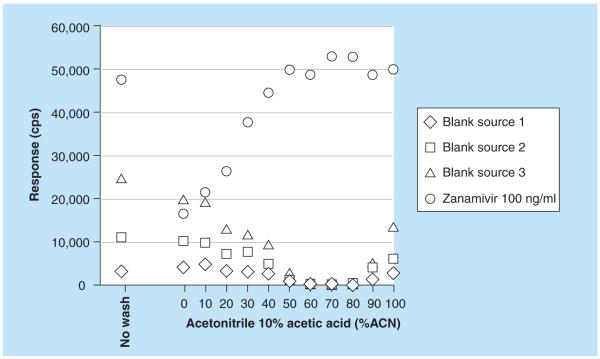
Zanamivir is a highly polar compound with a log P of −4.1. Zanamivir has one basic pKa estimated to be approximately 11.3 and one acidic pKa estimated to be approximately 3.8 [18]. Previously, the neuraminidase inhibitor oseltamivir and its metabolite oseltamivir carboxylate have been analyzed successfully on a ZIC HILIC LC coupled to MS/MS [19]. Another neuraminidase inhibitor peramivir was quantified using a high-throughput ZIC HILIC SPE method in combination with reversed-phase LC–MS/MS [20]. Zanamivir is much more hydrophilic than the other neuraminidase inhibitors oseltamivir and peramivir. In fact, it was not possible to achieve any retention at all for zanamivir on the LC column (Hypersil Gold C18), which was used for the peramivir method [20]. Conversely, the highly polar zanamivir was strongly retained on the ZIC HILIC column, even more so than oseltamivir and its metabolite oseltamivir carboxylate [19]. The retention factor for zanamivir, oseltamivir, oseltamivir carboxyate and peramivir on the ZIC-HILIC column as a function of acetonitrile content is shown in Figure 2. A mobile phase consisting of 70% acetonitrile and ammonium acetate gave good retention of zanamivir. The SPE column (MPC, strong cation exchange and reversed phase) used for oseltamivir and its metabolite oseltamivir carboxylate gave a very poor extraction recovery (~10%) for zanamivir in plasma. The reason for the poor recovery was breakthrough (i.e., poor retention) on the SPE column rather than irreversible binding (i.e., elution problems). Different strong cation exchangers were evaluated and SCX (IST) gave much better recovery than any of the other tested phases. The method for the ‘high’ range intended for the parenteral zanamivir was developed and validated first. With the original LC settings, blank plasma extracted with the developed SPE method produced one region with ion suppression at the tail of the zanamivir peak and another region some 15 s before the start of the peak (Figure 3A). Experiments to separate the area with ion-suppression and the zanamivir peak were carried out using extracted blank plasma and the postcolumn infusion technique (see validation for settings). Zanamivir was unaffected by changing the buffer concentration, but the retention for the unknown compounds that caused the suppression was inversely proportional to the buffer concentration (Figure 3A–C). A buffer concentration of 7.5 mM cleanly separated the zanamivir peak from both regions with ion suppression (Figure 3C). It was later found that thorough drying (i.e., 40 min full vacuum) of the SPE beds substantially minimized both areas with ion suppression. The method was later modified for the ‘low’ range. No problems were anticipated since it theoretically would be easy to obtain the desired sensitivity. However, with the modified method (more concentrated samples) approximately half of all blank sources tested produced signals in the zanamivir trace of up to 2–3 ng/ml (desired LLOQ was 1 ng/ml). This interference was visible in all selected reaction monitoring traces and all attempts to obtain LC separation on the HILIC column were unsuccessful. A thorough investigation of different SPE wash steps was therefore conducted. It was found that the retention behavior on the SCX SPE column for the interference and zanamivir differed at some conditions and it was possible to introduce a wash step that selectively removed the interference but not zanamivir. Figure 4 shows the detected response from three different blank sources (interference) and a zanamivir standard (100 ng/ml) without wash and with wash steps using various combinations of acetonitrile and 10% acetic acid. The interference was eliminated using a SPE wash of acetontrile: 10% acetic acid (70:30, v/v) while the recovery of zanamivir was unaffected (Figure 4).
Figure 2.
Retention of zanamivir, oseltamivir, oseltamivir, carboxyate and peramivir on the ZIC-hydrophilic interaction LC column as a function of acetonitrile content.
Figure 3. Injection of extracted blank human plasma with overlay of zanamivir during postcolumn infusion 10 μl/min of zanamivir and stable isotope labeled-zanamivir 30 ng/ml.
Mobile phase: acetonitrile: aqueous ammonium acetate (+1% acetic acid; 70:30, v/v). (A) 10 mM ammonium acetate (B) 15 mM ammonium acetate (C) 7.5 mM ammonium acetate.
Figure 4.
MS response from three different blank sources (interference) and a zanamivir standard (100 ng/ml) without wash and with wash steps using various combinations of acetonitrile and 10% acetic acid.
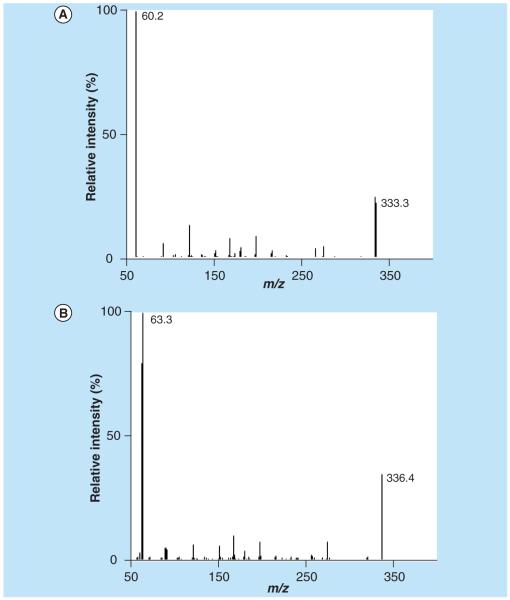
The collision-induced dissociation mass spectra (m/z 0–320) for zanamivir and SIL-zanamivir are shown in Figure 5A–B. The most intense product ion was the 60 and 63 m/z for zanamivir and SIL-zanamivir respectively.
Figure 5.
(A) Collision-induced dissociation mass spectra for zanamivir and (B) stable isotope-labeled zanamivir.
Validation
The concentrations of SIL-zanamivir chosen for the ‘low’ and the ‘high’ ranges were 104 and 2500 ng/ml respectively, as these concentrations produced no signals in the zanamivir trace. ULOQ samples of zanamivir did not produce any signal in the trace of SIL-zanamivir. Neither zanamivir nor the internal standard had any detectable carryover. Linear calibration curves were generated by 1/amount2 (x2) weighted linear regression analysis for both the ‘low’ and the ‘high’ ranges. The back-calculated concentrations for the calibration standards were within ±6% of their nominal concentration. Precision and accuracy for the QC samples is shown in Table 2. The LLOQ and LOD for zanamivir in plasma were 1 and 0.5 ng/ml for ‘low’ range and 50 and 12.5 ng/ml for ‘high’ range, respectively. The precision and accuracy at LLOQ met acceptance criteria (20 and 80–120%, respectively) for both ‘low’ and ‘high’ range. The LOD was chosen as the lowest concentration that could be distinguished reliably from the background noise (i.e., ≥ three-times the SD of a blank plasma sample). The precision and accuracy at the ULOQ and for over-curve dilution samples were within ±0% for both ‘low’ and ‘high’ range.
Table 2.
Inter-, intra- and total-assay precision (ANOVA) and accuracy for the measurement of zanamivir concentrations in human plasma.
| ‘High’ range (n = 3, h = 4) (μg/ml) |
Inter- assay RSD (%) |
Intra- assay RSD (%) |
Total- assay RSD (%) |
Accuracy (%) |
‘Low’ range (n = 5, h = 4) (ng/ml) |
Inter- assay RSD (%) |
Intra- assay RSD (%) |
Total- assay RSD (%) |
Accuracy (%) |
|---|---|---|---|---|---|---|---|---|---|
| LLOQ, 0.050 | 5.80 | 5.56 | 5.63 | −1.14 | LLOQ, 1.00 | 19.1 | 6.38 | 9.87 | −2.17 |
| QC 1, 0.150 | 3.54 | 2.96 | 3.06 | −2.97 | QC 1 3.00 | 4.26 | 2.97 | 3.21 | 0.660 |
| QC 2, 2.00 | 2.41 | 1.44 | 1.63 | −4.57 | QC 2 40.0 | 1.32 | 1.54 | 1.51 | 1.38 |
| QC 3, 40.0 | 3.41 | 1.12 | 1.70 | 5.00 | QC 3 800 | 2.97 | 2.19 | 2.33 | −2.07 |
H: Series; N: Replicates; QC: Quality control; RSD: Relative standard deviation.
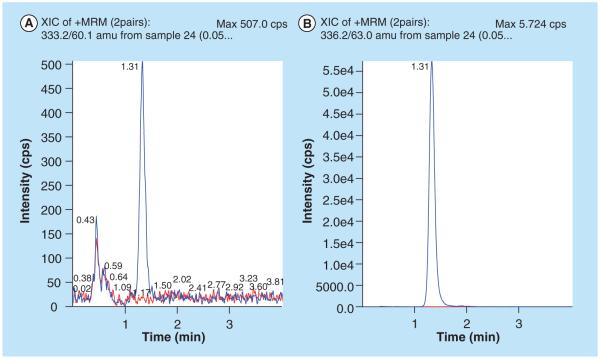
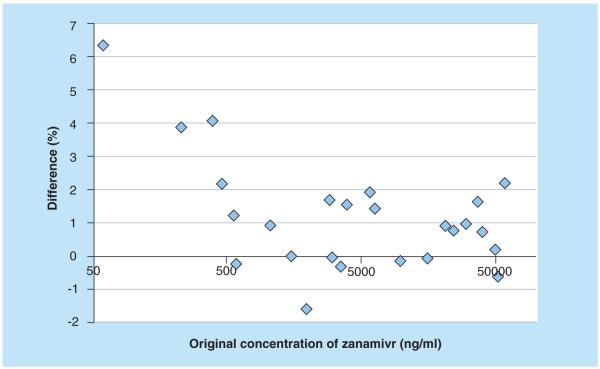
None of the blank samples produced any signals in the zanamivir or SIL-zanamivir trace. An example of blank plasma with an overlay of a LLOQ sample is shown in Figure 6. Zanamivir was stable in plasma during three freeze–thaw cycles, at ambient temperature for at least 48 h and at 4°C for at least 48 h. It was also stable in fluoride/oxalate plasma at 60°C for at least 60 min (i.e., heat inactivation of influenza virus) and was stable as ready for extraction for at least 4 h and in the autosampler for at least 24 h. Zanamivir was stable in the stock solution at ambient temperature for at least 6 h and at 4°C for at least 8 months. All results complied well with the generally accepted limits for relative standard deviation and accuracy (<15%) from FDA guidelines [15]. The method was implemented for analysis of clinical samples from a study evaluating potential pharmacokinetic interactions between oral oseltamivir and intravenous zanamivir in healthy Thai adults. Figure 7 displays the excellent results obtained during incurred sample reanalysis, which further confirms the robustness and performance of the developed method.
Figure 6. LLOQ (zanamivir 1.00 ng/ml) sample with an overlay of blank plasma.
(A) Zanamivir and (B) stable isotope-labaled zanamivir.
Figure 7. Bland–Altman plot for incurred sample reanalysis.
Difference (%) between original result and reanalyzed result is plotted as a function of the original concentration of zanamivir.
Recovery & matrix effects
The recovery (unadjusted for matrix effects) of zanamivir and SIL-zanamivir was between 90 and 100% at all tested concentrations for both the ‘low’ and the ‘high’ ranges. The recovery of the internal standard co-varied with the recovery of zanamivir so the normalized recovery (zanamivir/SIL-zanamivir) was close to unity. No suppression or enhancement for zanamivir or internal standard could be seen for the ‘high’ range while a small enhancement effect could be seen for the ‘low’ range (Table 3). The normalized matrix factors (compound/internal standard) were close to one with little variation, indicating that the internal standard compensates for any matrix effects [16]. Postcolumn infusion experiments confirmed the absence of regions with severe matrix effects (i.e., no sharp decreases or increases in the response) for blank human plasma extracted with the developed method.
Table 3.
Matrix effects. Zanamivir and stable isotope-labeled zanamivir spiked in extracted blank human plasma versus spiked in elution solution.
| Blank A | Blank B | Blank C | Blank D | Blank E | Blank F | Average | RSD (%) | |
|---|---|---|---|---|---|---|---|---|
| ‘High’ range | ||||||||
| Zanamivir (QC 1) 150 ng/ml | 100.4 | 98.5 | 104.7 | 100.6 | 106.0 | 94.1 | 100.7 | 4.3 |
| SIL-zanamivir (QC 1) 2500 ng/ml | 102.0 | 100.8 | 102.7 | 102.8 | 99.2 | 99.6 | 101.2 | 1.5 |
| Normalized matrix factor | 0.985 | 0.978 | 1.02 | 0.978 | 1.07 | 0.945 | 0.996 | 4.3 |
| Zanamivir (QC 3) 400 ng/ml | 98.2 | 99.3 | 99.1 | 99.0 | 98.5 | 99.2 | 98.9 | 0.4 |
| SIL-zanamivir (QC 3) 2500 ng/ml | 97.8 | 99.5 | 97.1 | 97.8 | 97.8 | 99.3 | 98.2 | 1.0 |
| Normalized matrix factor | 1.00 | 0.998 | 1.02 | 1.01 | 1.01 | 0.999 | 1.01 | 0.9 |
| ‘Low’ range | ||||||||
| Zanamivir (QC 1) 3.00 ng/ml | 113.6 | 121.7 | 116.7 | 115.3 | 117.6 | 119.4 | 117.40 | 2.5 |
| SIL-zanamivir (QC 1) 104 ng/ml | 110.5 | 122.4 | 113.6 | 114.7 | 116.6 | 117.1 | 115.83 | 3.5 |
| Normalized matrix factor | 1.028 | 0.994 | 1.027 | 1.006 | 1.009 | 1.020 | 1.014 | 1.3 |
| Zanamivir (QC 1) 800 ng/ml | 113.7 | 112.7 | 115.9 | 119.3 | 121.1 | 115.8 | 116.41 | 2.8 |
| SIL-zanamivir (QC 1) 104 ng/ml | 114.4 | 113.2 | 116.3 | 120.6 | 121.7 | 116.1 | 117.03 | 2.9 |
| Normalized matrix factor | 0.993 | 0.996 | 0.996 | 0.990 | 0.996 | 0.998 | 0.995 | 0.3 |
QC: Quality control; RSD: Relative standard deviation; SIL: Stable isotope labeled.
Conclusion
A high-throughput LC–MS/MS method for the determination of zanamivir in plasma over a wide concentration range (1–50,000 ng/ml) has been developed and validated. The method can be used for clinical pharmacology studies on both parenteral and inhaled zanamivir. The ZIC-HILIC LC step provides high sensitivity and proved to be robust throughout an extensive validation. The new assay uses SPE in the 96-well plate format and has a short LC run time, which makes it suitable for high-throughput analysis of large sample batches from pharmacokinetic studies. The assay has been validated carefully according to FDA guidelines and shows excellent performance.
Future perspective
We believe that HILIC techniques in combination with LC–MS/MS will become the gold standard for the analysis of polar drugs. Columns have been standardized and a considerable benefit is the improved MS sensitivity resulting from a much higher organic solvent content in the mobile phase than is possible with conventional techniques. It will undoubtedly be important to carry out therapeutic drug monitoring of these drugs in the future to investigate potential adverse effects and to investigate relationships between drug exposure and the development of resistance. In the future, simple finger prick sampling and collection of a small volume (i.e., 50–100 μl) of capillary blood spotted onto paper (i.e., dried blood spots) might be used after appropriate investigations.
Executive summary.
Method development
The ZIC-hydrophilic interaction LC column provides separation of the polar anti-influenza drug zanamivir at a relatively high content of acetonitrile, which leads to efficient electrospray conditions and good sensitivity.
Interference occurring in all selected reaction monitoring traces is not always explained by contamination, but can sometimes originate from a different source. Thorough method development can minimize or eliminate these signals.
Validation
A stable isotope-labeled internal standard should be used whenever possible as it can compensate for matrix effects and also for variation in extraction recovery.
The developed LC–MS/MS method is free from matrix effects as demonstrated by post-extraction addition experiments and postcolumn infusion experiments.
The developed LC–MS/MS method has been carefully and thoroughly validated according to published US FDA guidelines and shows excellent performance.
Stability of zanamivir is good in plasma and various other solutions.
Acknowledgments
Finanical disclosure This study was part of the Southeast Asia Influenza Clinical Trials Network supported by the US National Institute of Allergy and Infectious Diseases (NIH N01–AO–00042) and the Wellcome Trust–Mahidol University–Oxford Tropical Medicine Research Program (077166/Z/05/Z) supported by the Wellcome Trust of Great Britain. The authors have no other relevant affiliations or financial involvement with any organization or entity with a financial interest in or financial conflict with the subject matter or materials discussed in the manuscript apart from those disclosed. No writing assistance was utilized in the preparation of this manuscript.
Key Terms
- Zanamivir
Antiviral drug.
- SPE
Sample preparation technique.
- Hydrophilic interaction LC
Technique orthogonal to traditional reversed-phase LC that provides an excellent retention mechanism for polar drugs.
- Stable isotope-labeled internal standard
Compound where a few atoms have been exchanged with heavy isotopes (2H, 15N and 13C) to provide an internal standard.
- High-throughput
Analysis of numerous samples in a short time period.
- LC–MS/MS
State-of-the art analytical technology for analysis of drugs and metabolites.
Footnotes
Ethical conduct of research The authors state that they have obtained appropriate institutional review board approval or have followed the principles outlined in the Declaration of Helsinki for all human or animal experimental investigations. In addition, for investigations involving human subjects, informed consent has been obtained from the participants involved.
Bibliography
Papers of special note have been highlighted as:
■■ of considerable interest
- 1.Taubenberger JK, Morens DM. Influenza: the once and future pandemic. Public Health Rep. 2010;125(Suppl. 3):16–26. [PMC free article] [PubMed] [Google Scholar]
- 2.Taubenberger JK, Morens DM, Fauci AS. The next influenza pandemic: can it be predicted? JAMA. 2007;297(18):2025–2027. doi: 10.1001/jama.297.18.2025. [DOI] [PMC free article] [PubMed] [Google Scholar]
- 3.Normile D. Avian influenza. WHO proposes plan to stop pandemic in its tracks. Science. 2006;311(5759):315–316. doi: 10.1126/science.311.5759.315. [DOI] [PubMed] [Google Scholar]
- 4.How to win trust over flu. Nature. 2009;461(7265):698. doi: 10.1038/461698a. No authors listed. [DOI] [PubMed] [Google Scholar]
- 5.Schwarzinger M, Flicoteaux R, Cortarenoda S, Obadia Y, Moatti JP. Low acceptability of a/h1n1 pandemic vaccination in French adult population: did public health policy fuel public dissonance? PLoS ONE. 2010;5(4):e10199. doi: 10.1371/journal.pone.0010199. [DOI] [PMC free article] [PubMed] [Google Scholar]
- 6.Stone R. Swine flu outbreak. China first to vaccinate against novel H1N1 virus. Science. 2009;325(5947):1482–1483. doi: 10.1126/science.325_1482. [DOI] [PubMed] [Google Scholar]
- 7.Patel A, Gorman SE. Stockpiling antiviral drugs for the next influenza pandemic. Clin. Pharmacol. Ther. 2009;86(3):241–243. doi: 10.1038/clpt.2009.142. [DOI] [PubMed] [Google Scholar]
- 8.Hayden F, Klimov A, Tashiro M, et al. Neuraminidase inhibitor susceptibility network position statement: antiviral resistance in influenza a/H5N1 viruses. Antivir. Ther. 2005;10(8):873–877. [PubMed] [Google Scholar]
- 9.Boltz DA, Aldridge JR, Jr, Webster RG, Govorkova EA. Drugs in development for influenza. Drugs. 2010;70(11):1349–1362. doi: 10.2165/11537960-000000000-00000. [DOI] [PMC free article] [PubMed] [Google Scholar]
- 10.Hayden F. Developing new antiviral agents for influenza treatment: what does the future hold? Clin. Infect. Dis. 2009;48(Suppl. 1):S3–S13. doi: 10.1086/591851. [DOI] [PubMed] [Google Scholar]
- 11.Stubbs RJ, Harker AJ. Automated high-performance liquid chromatographic method for the determination of a neuraminidase inhibitor (GG167) in human serum by precolumn fluorescence derivatisation using benzoin. J. Chromatogr. B Biomed. Appl. 1995;670(2):279–285. doi: 10.1016/0378-4347(95)00165-4. [DOI] [PubMed] [Google Scholar]
- 12.Morris DM, Hussey BK, Geurin SL, Selinger KA. Determination of the novel sialic acid analog GG167 (GR121167x) in human urine by LC: direct injection with column switching. J. Pharm. Biomed. Anal. 1995;14(1–2):191–201. doi: 10.1016/0731-7085(95)01626-0. [DOI] [PubMed] [Google Scholar]
- 13.Allen GD, Brookes ST, Barrow A, Dunn JA, Grosse CM. Liquid chromatographic–tandem mass spectrometric method for the determination of the neuraminidase inhibitor zanamivir (GG167) in human serum. J. Chromatogr. B Biomed. Sci. Appl. 1999;732(2):383–393. doi: 10.1016/s0378-4347(99)00306-0. [DOI] [PubMed] [Google Scholar]
- 14.Baughman TM, Wright WL, Hutton KA. Determination of zanamivir in rat and monkey plasma by positive ion hydrophilic interaction chromatography (HILIC)–tandem mass spectrometry. J. Chromatogr. B Analyt. Technol. Biomed. Life Sci. 2007;852(1–2):505–511. doi: 10.1016/j.jchromb.2007.02.006. [DOI] [PubMed] [Google Scholar]
- 15.U.S. Department of Health and Human Services. Food and Drug administration. Centre for Drug Evaluation and Research (CDER) Centre for Veterinary Centre (CVM) Guidance for industry: bioanalytical method validation. 2001.
- 16.Viswanathan CT, Bansal S, Booth B, et al. Quantitative bioanalytical methods validation and implementation: best practices for chromatographic and ligand binding assays. Pharm. Res. 2007;24(10):1962–1973. doi: 10.1007/s11095-007-9291-7. [DOI] [PubMed] [Google Scholar]
- 17.Singtoroj T, Tarning J, Annerberg A, et al. A new approach to evaluate regression models during validation of bioanalytical assays. J. Pharm. Biomed. Anal. 2006;41(1):219–227. doi: 10.1016/j.jpba.2005.11.006. [DOI] [PubMed] [Google Scholar]
- 18.Chanteux H, Paternotte I, Mingeot-Leclercq MP, Brasseur R, Sonveaux E, Tulkens PM. Cell handling, membrane-binding properties, and membrane-penetration modeling approaches of pivampicillin and phthalimidomethyl-ampicillin, two basic esters of ampicillin, in comparison with chloroquine and azithromycin. Pharm. Res. 2003;20(4):624–631. doi: 10.1023/a:1023203017300. [DOI] [PubMed] [Google Scholar]
- 19.Lindegardh N, Hanpithakpong W, Wattanagoon Y, Singhasivanon P, White NJ, Day NP. Development and validation of a liquid chromatographic–tandem mass spectrometric method for determination of oseltamivir and its metabolite oseltamivir carboxylate in plasma, saliva and urine. J. Chromatogr. B Analyt. Technol. Biomed. Life Sci. 2007;859(1):74–83. doi: 10.1016/j.jchromb.2007.09.018. [DOI] [PubMed] [Google Scholar]
- 20.Lindegardh N, Hanpithakpong W, Phakdeeraj A, et al. Development and validation of a high-throughput zwitterionic hydrophilic interaction LC solid-phase extraction–LC–tandem mass spectrometry method for determination of the anti-influenza drug peramivir in plasma. J. Chromatogr. A. 2008;1215(1–2):145–151. doi: 10.1016/j.chroma.2008.11.009. ■■One of the first methods to use hydrophilic interaction LC–SPE for selective sample preparation of polar compounds.


