

Abstract
Primary brain tumors, gliomas, diffusely invade the brain by active cell migration either intraparenchymal, along white matter tracts or along blood vessels. The close relationship of glioma with the vasculature assures a continuous supply of oxygen and nutrients essential for cell growth, and exposes cells to a variety growth factors, chemokines, cytokines, and kinins. Signals that attract glioma cells to blood vessels are poorly understood. It has been shown that vascular endothelial cells can initiate the bradykinin (BK) signaling cascade and two bradykinin receptors, B1 and B2, have been identified and cloned. In this study we show that glioma cells isolated from patient biopsies express bradykinin 2 receptors (B2R) whose activation causes intracellular Ca2+ oscillations. Through time-lapse video-microscopy experiments we show that BK significantly enhances glioma cell migration/invasion. We further show that BK acts as a chemoattractant guiding glioma cells toward blood vessels in acute rat brain slices. The number of cells associated with blood vessels is decreased when B2R are either pharmacologically inhibited or B2R eliminated through short-hairpin RNA knockdown. These data strongly suggest that bradykinin, acting via B2R, acts as an important signal directing the invasion of glioma cells toward blood vessels. A clinically approved B2R antagonist is available that could be used as anti-invasive drug in glioma patients in the future.
Introduction
Gliomas derive from glial cells or their precursors and are the most common malignant primary brain tumors. Gliomas have an extraordinary ability to infiltrate the healthy brain (Laerum et al., 1984), which makes complete surgical resection almost impossible (Kaba and Kyritsis, 1997). Finding ways to attenuate glioma invasion is an important objective in glioma research. While all glioma cells invade intraparenchymally, many cells follow nerve tracts or migrate along blood vessels (Zagzag et al., 2008) where a constant supply of oxygen and nutrients essential for their growth is assured. This positioning also exposes cells to a variety of factors including growth factors, chemokines, cytokines and kinins. The kinins are a family of signaling molecules of which bradykinin (BK) is the most prominent. BK is a product of high molecular weight kininogen (HMWK). Its cleavage is initiated by vascular endothelial cells where physiological activation of the kallikrein-kinin system leads to activation of prekallikrein to kallikrein (Moreau et al., 2005). Furthermore, astrocytes are capable of binding HMWK and low molecular weight kininogen on their surface and cleaving BK (Joseph and Kaplan, 2005). Kinins are normally present in the brain, but are upregulated under pathophysiological conditions that correlate with tumor progression/metastasis: hypoxia, tissue damage, and inflammation (Ratajczak et al., 2006). Of note, bradykinin is an activator of matrix metalloproteinase (MMP) secretion (Hsieh et al., 2008), which may influence tissue remodeling (Ishiuchi et al., 2002).
BK exerts many functions through binding to one of two bradykinin receptors: B1R expression is induced under pathological conditions while B2R is constitutively active and responsible for physiological responses. BK receptors are G-protein coupled, and, after ligand binding, trigger a signal transduction cascade activating phospholipase β phosphoinositide breakdown, and PKC and calcium mobilization (Higashida et al., 2001). Analysis of patient-derived tissue (Raidoo et al., 1999) suggests an increased expression of B2R in gliomas. In rat glioma cells, a low dose of BK (1 μm) causes a sustained increase in intracellular calcium (Wang et al., 2007), while long-term superfusion with BK causes Ca2+ oscillations (Reetz and Reiser, 1996). Ca2+ oscillations have been implicated in cell migration of gliomas (Rondé et al., 2000; Giannone et al., 2002), and are a well understood phenomenon in cerebellar neurons (Komuro and Rakic, 1996). Like granule cells (Komuro and Rakic, 1996), glioma cells show oscillatory changes in intracellular Ca2+ as they migrate and Ca2+ fluctuations appear necessary for glioma cell migration (Bordey et al., 2000; Ishiuchi et al., 2002).
In this study, we show that bradykinin, acting via B2R, promotes migration of glioma cells. Low concentrations of BK stimulate sustained increases in intracellular Ca2+ concentration, whereas prolonged exposure to BK induces Ca2+ oscillations in glioma cells which, in turn, significantly enhance cell motility. More importantly, invasion of glioma cells into brain slices and association with blood vessels was disrupted when B2R were pharmacologically inhibited or specific short-hairpin RNA (shRNA) constructs were used. These data suggest that glioma cells use B2R to sense BK cleaved by endothelial cells and use this signal to identify and connect with blood vessels as they invade.
Materials and Methods
Cell culture.
Experiments were done using the glioma cell lines D54-MG [World Health Organization (WHO) grade IV, glioblastoma multiforme (GBM), provided as a gift by Dr. D. Bigner (Duke University, Durham, NC)], STTG-1, U251-MG, and U87-MG (GBM, WHO grade IV, ATCC), and two patient-derived acute GBM cultures labeled GBM 50 and GBM 62. The cells were maintained in DMEM/Ham's F-12 50/50 Mix containing 2 mm glutamine (media and glutamine supplied by Media Tech, University of Alabama at Birmingham Media Preparation Facility) and 7% fetal bovine serum (Aleken Biologicals), at 37°C and 10% CO2. D54-EGFP (enhanced green fluorescent protein)-MG cells were used for transfections with shRNA plasmids (Open Biosystems), and clones of the inducible plasmids were generated using puromycin resistance. The human glioma cell line U251-MG (GBM, WHO grade IV; a gift from Dr. Yancey Gillespie, University of Alabama at Birmingham) was used to generate U251-MG-GFP (green fluorescent protein) cells. Unless otherwise stated, all reagents were purchased from Sigma Aldrich. In all experiments, cells were treated with one or both bradykinin 2 receptor antagonists HOE 140 and Bradyzide (BZ).
Western blotting.
For Western blot analysis, non-nuclear membrane-enriched protein preparations were obtained from confluent dishes of cells, and processed as previously described (Montana et al., 2004). Protein concentrations were quantified using the DC protein assay kit (Bio-Rad). Protein (20 μg) was aliquoted and 6× Laemmli-SDS sample buffer containing 600 mm β-mercaptoethanol was added to appropriate proportions, and samples were loaded into individual lanes of 4–20% precast SDS polyacrylamide gels (Bio-Rad). Protein separation was accomplished by 100 V for ∼90 min. Gels were then transferred at 350 mA for 90 min at room temperature onto polyvinylidene difluoride paper (Millipore). Membranes were blocked in blocking buffer consisting of 5% nonfat milk in Tris-buffered saline–Tween 20. Primary antibodies for bradykinin 2 receptor (BD Transduction Laboratories) were diluted in blocking buffer at 1:250 overnight at 4°C followed by three washes. Membranes were incubated with HRP-conjugated secondary antibodies for 1 h and washed three times. The blots with HRP-conjugated secondary antibodies were developed using FemtoWest (Pierce), and all blots were imaged on a Kodak 4000MM imager.
Immunocytochemistry/immunohistochemistry.
D54-MG, STTG1, U251-MG, U87-MG, GBM 62, and GBM 50 cells were seeded on glass coverslips (12 mm round, Macalaster Bicknell) and, once they reached 70% confluency, fixed in 4% paraformaldehyde for 15 min and rinsed at room temperature. Cells were permeabilized with 0.25% Triton X-100 in PBS, and then blocked in PBS with 0.25% Triton X-100 and 5% goat serum for 30 min at room temperature. Primary B1R and B2R rabbit polyclonal antibodies obtained from Sigma, 1:100 dilution in PBS with 5% goat serum, were incubated at 4°C overnight. The following day, cells were rinsed three times with PBS. Tetramethylrhodamine isothiocyanate (TRITC)-conjugated goat anti-rabbit secondary antibody, 1:750 (Invitrogen) in PBS and 5% goat serum were incubated on cells in the dark for 1 h at room temperature. Cells were then washed once with PBS, incubated 5 min with 4′,6′-diamidino-2-phenylindole dihydrochloride (DAPI) diluted 1:2000 in PBS, and washed twice more with PBS. Coverslips were then mounted on glass slides with Gel Mount Aqueous Mounting Medium, and imaged. For immunohistochemistry, 100 μm sections of human tissue biopsies were fixed in 4% paraformaldehyde for 2 h at room temperature. Following triple washes with PBS, samples were permeabilized for 1–2 h with PBS with 0.25% Triton X-100, blocked in PBS with 0.25% Triton X-100 and 5% goat serum for 2 h at room temperature, and incubated in primary antibodies overnight at 4°C. In subset of experiments, tissue sections were double-labeled. Antibodies against laminin (1:500) and glial fibrillary acidic protein (GFAP)-Cy3 (1:400), both obtained from Sigma, were used. FITC- and TRITC-conjugated goat anti-rabbit secondary antibody, 1:750 (Invitrogen) in PBS, and 5% goat serum were incubated on cells in the dark for 2 h at room temperature. Following staining, the slices were mounted in between two coverslips for imaging. Quantification of fluorescent staining intensity after background subtraction was analyzed using Slidebook 4.2 software (Intelligent Imaging Innovations). All experiments were repeated at least three times.
Calcium imaging.
D54-MG cells were plated on 35 mm glass-bottom dishes (MatTek) at ∼100 × 103 per dish and cultured for 2 d. pTRIPZ-transfected cells, after stable selection, were plated at a density of ∼20 × 103 cells per dish and treated with 1 mg/ml doxycycline for 4–5 d to allow for sufficient protein knockdown. All cells were loaded in serum-free culture medium for 45 min with the ratiometric Ca2+ dye Fura-2-acetoxymethylester (5 μmol/L; TEFLabs) reconstituted in 20% w/v pluronic acid in DMSO (Invitrogen). Cells were rinsed with serum-free medium and allowed to rest in 7% serum-containing medium for 45 min at 37°C. The glass-bottom dishes were placed in an environmental chamber mounted on an inverted microscope. Cells were allowed to equilibrate in the chamber for 15 min before calcium images were collected. Following equilibration, recordings were obtained with an Olympus Disk Spinning Unit (DSU) fluorescent imaging microscope in which cells were alternately excited at 340 and 380 nm using an X-Cite illumination light source. Emitted light was collected at >520 nm. Images were digitized online using Slidebook 4.2 software (Intelligent Imaging Innovations), and 340:380 nm ratios were obtained every 15 s. Following a 5 min baseline recording every 15 s, bradykinin was applied to the cells, and imaging continued every 15 s for 30 or 60 min. In a subset of experiments, bradykinin antagonists, HOE 140 and Bradyzide, were applied to the cells. These experiments were repeated at least three times and data were pooled for statistical analysis.
Time-lapse motility assay.
We performed time-lapse studies using a stably transfected daughter cell line from D54-MG cells that express EGFP, previously generated in the lab (Habela et al., 2009) and U251-EGFP cell line to visualize cells as they migrate. Increased motility was tested using an Ibidi chemotaxis chamber, which is commercially available from Ibidi Scientific (Ibidi GmbH) and has been used in previous studies (Kronlage et al., 2010; Fabian et al., 2011) with D54-EGFP MG cells seeded. Liquid chemical gradients were established in the μ-channel of the μ-chamber as follows: the dye Patent Blue V Blue Sodium Salt (1 mg/ml in medium) was mixed with an equivolume of medium with or without 1 mm stock of BK with or without 1 mm stocks of HOE 140 or BZ; half of the volume was loaded in the well at one side of the μ-channel, and the identical volume was then aspirated from the well on the other side of the μ-channel. This created concentration gradient easily visualized by the dye. Twelve to 15 different positions along the concentration gradient were imaged every 5 min over 5 h period on a Zeiss Axiovert 200 M system equipped with a Zeiss micro-incubation chamber that maintains cells at constant temperature (37°C) and 95%/5% CO2/O2 for extended periods of time. We obtained images from different sections using 20× objective and FITC filter, along with differential interference contrast images. Neutral density filters (500×) to capture images using Axiovision software, and a digital Axiocam HR 1 megapixel camera in 2*2 binning mode were used. Data were analyzed using the imaging tools provided by National Institutes of Health ImageJ and Tracking, and Chemotaxis and Migration Tool plugins (Coller et al., 2009; Jacobelli et al., 2009; Kronlage et al., 2010; Fabian et al., 2011) by randomly selecting 15 cells for each field of view. Cells treated with BK with or without antagonists were compared with controls in which only dye was added. These experiments were repeated in triplicates.
Migration/invasion assay.
The day before the experiment was performed, ∼70% confluent dishes of cells were prepared. Transwell migration Fluoroblock cell culture inserts (BD Biosciences) with 8 μm pores were coated overnight with Vitronectin (BD Biosciences) at a concentration of 5 μg/ml in PBS. The following day, inserts were blocked with 1% fatty acid-free bovine serum albumin for 1 h. Inserts were then washed two times in PBS, and 400 μl of migration assay buffer (MAB) (0.1% fatty acid-free bovine serum albumin in serum-free media) was added to the bottom of each well. Cells were rinsed once in PBS and were lifted off the dish by the addition of 0.5 mm EGTA. Cells were rinsed twice by centrifugation and resuspended in MAB and counted. Forty thousand cells were plated on the top of each filter and allowed to adhere for 30 min before drug was added. When BK with or without antagonists was added to the filters, it was added only to the bottom of the filter for chemotaxis. For migration assay, D54-EGFP MG cells were allowed to migrate for 5 h, washed with PBS, fixed with 4% paraformaldehyde 15 min at room temperature, washed thrice and counterstained with DAPI for 5 min at room temperature. Invasion assay was performed similarly. Matrigel cell-cultured inserts (BD Biosciences) with 8 μm pores were pretreated with Vitronectin and blocked as described above. A total of 40,000 D54 cells were plated on the top of each filter, BK with or without antagonist was added to the bottom of the chamber, and cells were allowed to invade through an artificial, more complex Matrigel matrix barrier for 24 h. Inserts in which drugs were omitted were processed in parallel and used as controls. Filters were then fixed and stained with crystal violet overnight at 4°C and washed with PBS; the tops were wiped clean of cells, and representative fields (five per filter) were imaged with a Zeiss Axiovert 200 M microscope with a 20× objective. The number of nuclei that migrated through pores was counted. All counts per treatment were averaged and SE values were calculated. These experiments were repeated at least three times and data were pooled for statistical analysis.
In situ zymographic analysis of cell surface gelatinolytic activity in vitro.
To assess gelatinolytic MMP activity we used in situ zymography, as described previously (Deshane et al., 2003). Briefly, after cell nuclei were labeled with Hoechst dye, fluorescein isothiocyanate-labeled DQ gelatin with BK with or without antagonists (Invitrogen) was applied overnight on the coverslips plated with D54 MG cells. Coverslips from which drugs were omitted were processed in parallel and used as controls. At the end of the incubation period, cells were photographed by fluorescence microscopy with a Zeiss Axiovert 200 M microscope using a 20× objective. Quantification of fluorescent staining intensity after background subtraction was done using Slidebook 4.2 software (Intelligent Imaging Innovations). Experiments were repeated three times.
Slice invasion.
Experiments were performed on male and female Sprague Dawley rats and were approved by the University of Alabama Institutional Animal Care and Use Committee. Seventeen- to 22-d-old pups were decapitated. Meninges were stripped, and brain was taken out and put in an ice-cold bath of artificial CSF (ACSF). Tissue was sliced using a Vibratome 3000 sectioning system. Slices (300 μm thick) were allowed to recover in ACSF for 1 h at room temperature, followed by recovery in ACSF at 37°C in 95%/5% CO2/O2 for 1 h. CD31antibody (BD Biosciences), which labels blood vessels, was added during the latter recovery period. Slices were then transferred into Transwell migration cell culture inserts (BD Biosciences) with 8 μm pores that were pretreated with Vitronectin and blocked as described above. Then, 50,000 D54-EGFP MG cells were seeded on top of the slices and allowed to migrate/invade into the tissue for 2 h at 37°C. During that period, slices were treated with 1 μm BK, 1 μm BK + 5 μm HOE 140, or 5 μm HOE 140 added to the bottom of migration chamber to create a concentration gradient, similar to in vitro migration/invasion assay (see Fig. 5C). In control experiments, drug treatment was omitted. Following double washes with PBS, slices were fixed in 4% paraformaldehyde overnight at 4°C. The following day, samples were washed three times with PBS and the slices were mounted between two coverslips for imaging on an Olympus Fluoview confocal microscope with 60× objective.
Figure 5.
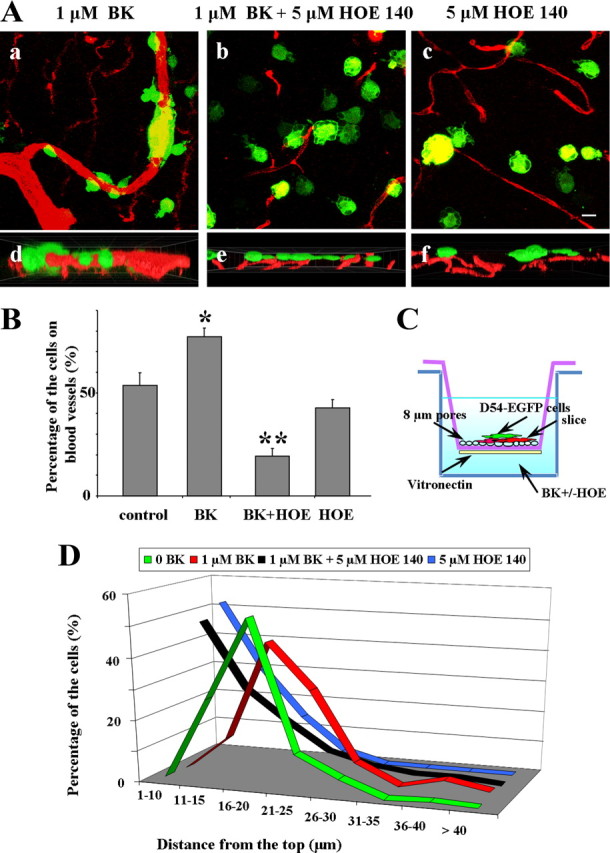
BK enhances cell invasion in brain slices. A, Representative immunofluorescent images of D54-MG-GFP cells fixed 2 h after brain slices invasion. D54-MG-GFP (green) cells enwrapping blood vessels (red) in the presence of BK (a) while invading brain slice. Addition of B2R antagonist dramatically reduces the number of cells on the blood vessels (b, c), as quantified in B. Cross-section of cells in reconstructed z-stack indicate deeper penetration of glioma cells enwrapping blood vessel, 50 μm (d) with addition of BK than in presence of B2R antagonist (e), 27 μm imaging plane, or only B2R antagonist, 40 μm imaging plane (f). C, Experimental set-up for slice invasion assay. D, Percentage of the D54-MG-GFP cells at certain depth as they migrate/invade from the top of the slice, presence of BK causes shift to the right/deeper into the tissue (red) compared with controls (black) or to addition of B2R antagonist when most of the cells remain on the top of the slice (green, blue). Columns, Percentage control; bars, SEM. Statistical analysis: one-way ANOVA (*p < 0.05). Scale bar, 10 μm.
Transfections of shRNA and control plasmids.
For inducible B2R knockdown in D54-EGFP MG cells, pTRIPZ-lentiviral vectors were obtained (Open Biosystems; catalog numbers RHS4743 and RHS4696-99682, RHS4696-99635991, RHS4696-99408793) for nonsilencing, shRNA1, and shRNA2 plasmids, respectively, and TurboRed expression indicated induction of shRNA. Cells were transfected as described by Weaver et al. (2006). To generate stable lines, 1 μg/ml puromycin treatment began 96 h after transfection. After selection, cells were passed (density, 0.5 cells/100 μl) into 96 well plates and scored for single colonies. Cells were treated with doxycycline and B2R knockdown was assessed.
Data analysis.
Results were analyzed using Origin (v.6.0, MicroCal Software). Significance was determined by one-way ANOVA or Student's t test, as appropriate, since all data showed normal distribution. Post hoc comparisons were performed using Tukey analysis. All data reported are mean ± SEM and asterisks denote significance (*p < 0.05, **p < 0.01 and ***p < 0.001).
Results
Expression of bradykinin 2 receptors in glioma cell lines and patient tissue biopsies
While bradykinin can bind to two classes of receptors, B1R and B2R, previous studies reported increased expression of B2R in glioma biopsy tissues (Raidoo et al., 1999). Figure 1A shows representative examples of patient-derived tissue sections stained for B2R showing immunoreactivity across all four malignancy grades (WHO grades I–IV) as well as in normal brain. Indeed, normal brain samples typically showed uniform B2R immunoreactivity (Fig. 1A) and colabeling with GFAP antibodies (supplemental Fig. 1, available at www.jneurosci.org as supplemental material) indicate significant colocalization, suggesting that B2R is expressed in normal astrocytes. Increasing grades of malignancy showed increasing B2R immunoreactivity yet also presented a decrease in GFAP expression. Indeed, in Grade IV samples we observed areas with strong B2R expression that lacked GFAP immunoreactivity (supplemental Fig. 1, available at www.jneurosci.org as supplemental material). Importantly, we found highest levels of B2R immunoreactivity in perivascular regions as shown in a representative example in Figure 1B. Here we colabeled the tissue with anti-laminin antibody to label blood vessels.
Figure 1.
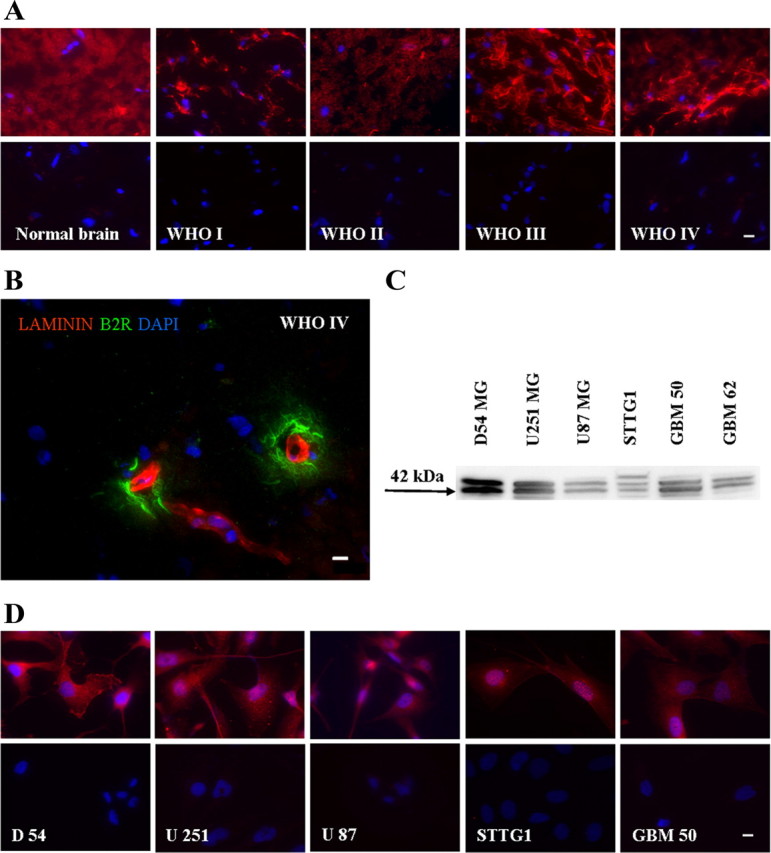
Bradykinin 2 receptor is expressed in glioma cell lines and patient tissue biopsies. A, D, Normal human brain tissue and four GBM patient tissues (WHO grades I–IV) (A) and glioma cell lines (D) were stained with specific anti-B2R antibodies and counterstained with DAPI. Primary antibodies were omitted in controls (bottom, A and D). B, GBM patient tissue, WHO grade IV colabeled with specific antibodies against B2R and laminin, and counterstained with DAPI. C, Protein expression of B2R in non-nuclei protein-enriched membrane fractions of glioma cell lines. The approximate molecular weight of the protein is indicated to the left as the blot image was cropped for clarity. Scale bar, 10 μm.
Expression of B2R is also maintained in many frequently used human glioma cell lines: D54-MG, U251 MG, U87 MG, STTG1, and GBM 50 (Fig. 1D). Representative images of immunostained cells indicate strong membrane-associated labeling with specific antibodies against B2R. Nuclei were visualized with DAPI and we controlled for the background by staining coverslips processed in parallel identically, but without primary antibody (Fig. 1A,D, bottom). We also confirmed B2R protein expression by Western blot analysis in membrane-enriched (non-nuclei) protein preparations revealing a characteristic double band where the lower band (42 kDa) corresponds to B2R, as specified by the manufacturer (Ewert et al., 2003) (Fig. 1C). B1R was barely detectible by immunohistochemistry in a side-by-side comparison staining D54-MG with specific antibodies against B1R and B2R and quantitative assessment of fluorescent intensities (supplemental Fig. 2, available at www.jneurosci.org as supplemental material) suggesting that in our experimental system B2R is the dominant bradykinin receptor expressed.
Glioma cells respond to various stimuli by increasing intracellular calcium concentrations, yet only prolonged bradykinin exposure resulted in calcium oscillations through binding to B2R
Glioma cells respond to environmental clues as they invade the brain. It has been previously shown that the exposure of glioma cells to certain neuroligands induces increase in intracellular calcium concentrations. In this series of experiments, we investigated Ca2+ responses in cultured D54-MG glioma cells, after addition of acetylcholine (ACh), ATP, or BK. Glioma cells were loaded with the ratiometric Ca2+ dye FURA2-AM, and imaged over 30 min. Application of either 50 μm ACh (116 cells responded of 128 cells imaged; average peak 0.23 ± 0.04), 100 μm ATP (87 of 146 cells responded; average peak 0.45 ± 0.05), or 10 μm BK (85 of 109 cells responded; average peak 0.45 ± 0.03) each caused a sustained rise in intracellular calcium (Fig. 2A). Similar Ca2+ responses were observed with much lower BK concentrations (Fig. 2B), namely 0.1 μm (256 of 283 cells responded; average peak 0.34 ± 0.02), 0.3 μm (300 of 330 cells responded; average peak 0.33 ± 0.07), and 1.0 μm (231 of 247 cells responded; average peak 0.30 ± 0.07). Prolonged exposure (60 min) of D54-MG cells to 1 μm BK resulted in Ca2+ oscillations (Fig. 2C). Similar Ca2+ oscillations have been reported in migratory cerebellar granule cells and correlated with the ability of the cells to migrate (Komuro and Rakic, 1996; Lyons et al., 2007). To illustrate an association of cell movement with Ca2+ oscillations we show a sequence of time-lapse images from D54 cells loaded with Fura-2 (Fig. 2D) spanning a 5 min time period (supplemental Movie 1, available at www.jneurosci.org as supplemental material). The cell labeled with the arrow shows large calcium oscillations preceding translocation. To determine whether these effects were due to actions of BK (236 of 269 cells responded; average peak 0.75 ± 0.05) on B2R, we repeated these experiments in presence or absence of the B2R antagonists HOE 140 (22 of 162 cells responded; average peak 0.15 ± 0.01 which was significantly different from response to BK, p < 0.001, one-way ANOVA), and Bradyzide (156 of 300 cells responded; average peak 0.15 ± 0.02 which was significantly different from response to BK, p < 0.001, one-way ANOVA). No increase in intracellular Ca2+ concentrations was observed in the presence of these specific B2R antagonists (Fig. 2E).
Figure 2.

Glioma cells respond to various stimuli by increasing intracellular calcium concentrations, yet only prolonged bradykinin exposure results in calcium oscillations through binding to B2R. A, ATP, BK, and ACh were applied on D54-MG cells previously loaded with FURA2-AM, and Ca2+ response was recorded. B, D54-MG loaded with FURA2-AM respond to various concentrations of BK by increase in intracellular Ca2+ concentrations. C, Representative example of prolonged exposure to BK resulting in frequent Ca2+ oscillations in cells (9 of 11). D, Last 5 min of a 30 min sequence time-lapse imaging of D54 cells loaded with Fura-2. Images were taken every 15 s. E, Calcium response to BK is abolished in the presence of specific B2R antagonists. Arrows in A–C, and E indicate application of agonist. Arrows in D indicate a cell that changed position following calcium oscillations. Scale bar, 10 μm.
Glioma cell motility increases in a bradykinin concentration gradient
To more closely investigate the responsiveness of glioma cells to BK, we examined the underlying signaling in more detail. As calcium dynamics are often correlated with cell motility, we performed time-lapse studies using a stably transfected daughter cell line from D54-MG cells that expresses GFP to visualize cells as they migrate (Fig. 3A; supplemental Movie 2, available at www.jneurosci.org as supplemental material). Increased motility was tested in μ-slides in which a BK concentration gradient can be maintained. Multiple fields of view of the cells were imaged during a 5 h period and different migration parameters were analyzed using NIH ImageJ. A representative example of directionality analysis shown in Figure 3B, red traces, reveals that in the presence of BK, cells moved toward increasing BK concentration. By contrast, in the absence of a BK concentration gradient, or in the presence of the B2R antagonists HOE 140, and Bradyzide, in addition to BK, cells failed to show any directionality of movement. Averaged cell paths of these examples are featured by rose diagrams in Figure 3C. Both cell velocity and distance traveled were significantly increased for cells maintained in the BK concentration gradient (29.5 ± 8.7%, 28.8 ± 8.9%, respectively) compared with control, while in the presence of specific antagonists, the effect was not observed (Fig. 3Cb and 3Cc, respectively; one-way ANOVA, **p < 0.01). We further tested another frequently used human glioma cell line, U251-MG that stably express EGFP and obtained similar results (data not shown). Together, these data suggest that BK, acting through B2R, increases cell motility and chemotaxis (a directed movement of a cell or groups of cells toward increased concentrations of the chemical in their environment) in glioma cells.
Figure 3.
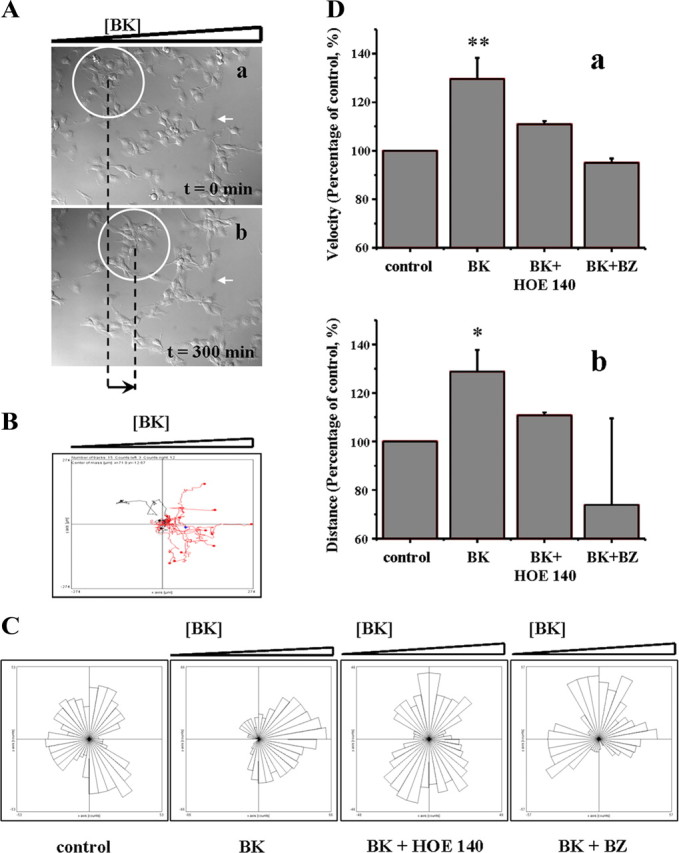
Glioma cell motility is increased in a bradykinin concentration gradient. A, The first (a) and the last (b) frame of a time-lapse study of D54-MG-GFP cells exposed to a BK concentration gradient, increasing concentration from left to right; the group of cells in the white circle moved toward higher BK concentrations (black arrow indicates the overall distance change for that group of cells). White arrow in a and b labels a random particle on the field of view ensuring that there was no shift of the chamber during the course of imaging. Frame/5 min over 5 h of imaging. Magnification 20×. B, A representative example of directionality for individual cell analysis reveals that in the presence of BK, 12 of 15 cells moved toward increasing BK concentration, red traces. C, Rose diagram presentation of averaged cell paths of D54-MG movement in an example from a representative field of view for each condition analyzed, indicating directionality was affected in BK concentration gradient while in the control (8 of 15) and in the presence of HOE 140 (8 of 15) or Bradyzide (6 of 15) cells were moving in random fashion. D, Presence of BK concentration gradient significantly increased velocity (a) and distance (b) traveled by D54-MG glioma cells. All data reported are mean ± SEM. Statistical analysis: one-way ANOVA (*p < 0.05, **p < 0.01).
Transwell glioma cell migration/invasion assays suggest that bradykinin enhances invasive migration of glioma cells
To investigate the hypothesis that BK promotes glioma migration in vitro, we used Transwell migration assay which conveniently permit examination of cell migration across a membrane barrier with 8 μm pores toward vitronectin, a chemoattractant extracellular matrix protein. This frequently used assay allows a quantitative study of drug effects with regards to drugs acting as motogens or as chemoattractants. D54-MG-GFP glioma cells were allowed to migrate for 5 h in the presence or absence of neuroligands. First, we tested the effects of ACh, ATP, and BK on D54-MG cell migration and found that only BK, which also caused oscillatory changes in Ca2+, was able to significantly increase migration (one-way ANOVA, *p < 0.05), while ACh and ATP, which did not increase frequency of Ca2+ oscillations, failed to alter glioma migration (Fig. 4Aa,Ab). Next, we tested glioma cell migration in various BK concentrations. Parallel experiments using pharmacological antagonists of B2R, HOE 140 and Bradyzide (1 μm), were performed. Our data demonstrated a significant increase in the percentage of cells migrating through the pores toward BK (Fig. 4Ba,Bb). This increase was eliminated if either of the B2R antagonists were used. The reduction in migration was significant when compared with parallel experiment where only BK was added (one-way ANOVA, *p < 0.05, **p < 0.01). Similar results were obtained when an invasion assay was performed (Fig. 4C). In this assay, cells are exposed to a more complex, artificial Matrigel matrix barrier. We hypothesized that the observed increase was due to activation of MMPs as release of gelatinases MMP2 and MMP9 from glioma cells has been reported (Friedberg et al., 1998). To further investigate the observed increase in invasion activity of D54-MG-GFP in the presence of BK, the ability of BK to induce MMP activity in the presence or absence of the B2R antagonists HOE 140 and Bradyzide was examined. Therefore we used a MMP gelatinase activity assay analyzing changes in enzymatic activity of MMP by BK. A significant increase of fluorescence in the presence of BK indicates increased MMP activity, while addition of the B2R antagonists, HOE 140 and BZ, resulted in reduction of the fluorescence back to control levels (Fig. 4Da,Db) (*p < 0.05, one-way ANOVA). Together, these data suggest that BK, acting through B2R signaling pathway, enhances D54 MG invasion possibly through an increase in MMP activity.
Figure 4.

Transwell glioma cell migration/invasion assays suggest that bradykinin enhances invasive migration of glioma cells. Aa, Analysis of migration assay, effects of ATP, ACh, and BK: BK significantly increases migration. Ab, Representative fluorescent images of D54-MG-GFP fixed after 5 h of migration and counterstained with DAPI. Ba, Analysis of migration assay, effects of different BK concentrations in presence or absence of B2R antagonists: BK significantly increases migratory properties of glioma cells in a concentration-dependent manner, the effect was abolished in the presence of antagonists. Bb, Representative fluorescent images of D54-MG-GFP migrated for 5 h in 0, 0.1, 0.3 or 1 μm BK. After fixation, cells were counterstained with DAPI. C, Mean data from the invasion assay suggest that BK increased invasion of glioma cells significantly at 0.3 μm BK concentration; the effect was abolished in the presence of antagonists. Da, Analysis of fluorescent intensities. Db, Representative fluorescent images of D5-MG after 24 h incubation in gelatin DQ and BK in presence or absence of B2R antagonists. After fixation, cells were counterstained with DAPI. Columns, Percentage control; bars, SEM. Statistical analysis: one-way ANOVA (*p < 0.05). Scale bar, 10 μm.
BK enhances cell invasion in brain slices
Having established a dependence of migration and BK in vitro, we next wanted to examine the role of BK signaling in brain slices, where the presence of neurons, glia and endothelial cells resemble the complex environment more reminiscent of the actual invasions of glioma cells in the human brain. To this end, acute brain slices of rat cortex, that can be maintained viable for many hours of investigation, were incubated with CD31 antibody to label blood vessels and seeded with D54-MG-GFP cells. We allowed cells to migrate and invade for 2 h in presence or absence of BK and in presence or absence of B2R antagonist HOE 140. The experimental set-up is illustrated in Figure 5C. Representative confocal images of glioma cells invading into the slice in the presence of BK with and without antagonist HOE 140 added are shown in Figure 5Aa–c. The bottom panels in Figure 5 show cross-sections of reconstructed z-stacks indicating deeper penetration of glioma cells enwrapping blood vessel, 50 μm section in BK bath (Fig. 5Ad), while addition of B2R antagonist retains most of the cells on the top of the slice, 27 μm section, as seen in Figure 5Ae. Similarly, most of the cells remained on the slices when treated only with B2R antagonist, as depicted in 40 μm cross-section in Figure 5Af. Data were analyzed by counting the number of glioma cells that attached to blood vessels in the presence of BK (77.4 ± 4.1%, 391 cells analyzed), BK and antagonist HOE 140 (19.3 ± 3.4%, 461 cells analyzed) or antagonist HOE 140 (42.7 ± 4.2%, 452 cells analyzed) and compared with control (53.5 ± 6.3%, 403 cells analyzed) where no drugs were added. The presence of BK significantly increased the number of glioma cells attached to blood vessels while high doses of antagonist (5 μm HOE 140) significantly reduced the number of glioma cells attached to blood vessels compared with control. Interestingly, when antagonist alone was added, there was also a reduction in the percentage of cells associated with blood vessels suggesting that the antagonist also blocked the effects of endogenous BK present in the slice (Fig. 5B), implicating more complex interactions of glioma cells with their environment. Another important effect observed was that the glioma cells were invading deeper into the tissue in the presence of BK when compared with controls. In the control experiment 27.5% of cells invaded up to 15 μm into the tissue, 53.6 up to 20 μm, 11.9% up to 25 μm; when BK was added 11.9% of the cells invaded up to 15 μm, 44.2% up to 20 μm, 29.6% up to 25 μm; when antagonist HOE 140 was present in addition to BK most of the cells analyzed (47.5%) remained on the top of the slice, 25.7% migrated up to 15 μm, 15.4% up to 20 μm, and 6.4% up to 25 μm; likewise, addition of the antagonist HOE 140 alone left 51.9% cells on top of the slice, 29.8% migrated up to 15 μm, 14.4% up to 20 μm, 3.5% up to 25 μm (Fig. 5D).
Bradykinin effects on glioma cells are mediated by bradykinin 2 receptors
So far we pharmacologically manipulated the receptor using two different antagonists. HOE 140 was previously shown to be competitive antagonist very specific to signaling through B2R. However, to additionally confirm that the observed effects of BK on glioma cells were indeed mediated by B2R, we generated D54-MG cells that stably expressed shRNA to suppress the expression of B2R under a doxycycline inducible promoter. We confirmed a significant reduction of B2R expression in doxycycline-induced cells by Western blot analysis of non-nuclear membrane protein preparations (Fig. 6A). Next, we performed a battery of experiments to test for a functional capability of the remaining expressed protein. We compared Ca2+ response in the transfected D54-MG-GFP cells on/off doxycycline. Cells transfected with nonsilencing RNA did not show any difference in Ca2+ concentrations after addition of BK (96 of 104 cells responded with average peak 0.17 ± 0.01 which was not significantly different from calcium responses of cells treated with doxocycline, 78 of 96 with average peak 0.19 ± 0.03, one-way ANOVA). On the contrary, both cell lines transfected with different silencing shRNAs, lacked any response to BK in doxycycline-induced conditions (sh1: 60 of 73 cells responded with average peak 0.21 ± 0.02 which was significantly different from calcium responses of cells treated with doxycycline, 40 of 159 with average peak 0.1 ± 0.03, *p < 0.05, one-way ANOVA; sh2: 106 of 125 cells responded with average peak 0.28 ± 0.04 which was significantly different from calcium responses of cells treated with doxycycline, 18 of 101 with average peak 0.09 ± 0.01, **p < 0.01, one-way ANOVA) (Fig. 6B). The migratory abilities of B2R knockdown D54-MG-GFP cells on doxycycline were significantly reduced and were unaltered in the presence of BK (Fig. 6C). Slice invasion assays yielded similar results: the percentage of B2R knockdown D54-MG-GFP cells on doxycycline that attached to the blood vessels was significantly reduced compared with the control and this did not change if BK was added to the system (Fig. 6D). This is in good agreement with the reduction observed due to B2R antagonist effect in slice invasion experiment. Together, these data show an important role for B2R in BK-mediated chemoattraction of glioma cells to blood vessels.
Figure 6.

Bradykinin effects on glioma cells are due to actions of bradykinin 2 receptor. A, Representative Western blot displaying reduced B2R protein expression in shRNA-transfected cells when doxycycline treated for 5 d. The approximate molecular weight of the protein is indicated to the left as blot image was cropped for clarity. Ba–c, Control (scramble) and noninduced D54-MG-GFP cells show normal Ca2+ response after BK stimulation (as indicated by the arrow), while doxycycline-induced B2R knockdowns failed to respond to the stimulation. C, Migration assay analysis of doxycycline-treated shRNA-transfected cells in the presence or absence of BK: migration of control (scramble) cells was significantly increased in the presence of BK while migration of B2R knockdowns was insensitive to BK and significantly decreased compared with control (scramble) cells. D, Slice invasion assay was performed with doxycycline-treated cells: the percentage of control cells (scramble) on blood vessels is significantly increased with addition of BK while in case of shRNA-transfected D54-MG-GFP, BK did not affect attachment onto the blood vessel, and is significantly reduced compared with controls. Columns, Percentage control; bars, SEM. Statistical analysis: Student's t test (*p < 0.05) and one-way ANOVA (**p < 0.01, ***p < 0.001).
Discussion
In this study, we tested the hypothesis that bradykinin contributes to the invasive migration and dispersal of astrocyte-derived tumors through activation of B2R. We present a series of experiments in support of this hypothesis. B2R expression correlates positively with tumor grade in patient tissue biopsies. Glioma cell lines maintain membrane expression of B2R, as demonstrated by immunocytochemistry and Western blot analysis. Our functional assays demonstrate that BK stimulates the migration of glioma cells in vitro and in acute slices, where BK mediates association of invading glioma cells with blood vessels. Perivascular migration is one of three pathways used by glioma cells to disperse and this mode of cell invasion is well recapitulated in the xenograft invasion model used in our studies. Using pharmacological manipulation and inducible B2R knockdown cells we demonstrate that these actions of BK on glioma cells were indeed due to activation of B2R and enhance successful attraction of gliomas to blood vessels.
The bradykinin 2 receptor is a constitutively active protein localized mostly, as our data demonstrate, on the plasma membrane, although nuclear membrane localization in embryonic rat neurospheres has been reported (Martins et al., 2008). Our finding that increased expression of B2R correlates positively with pathological tumor grade in human gliomas is consistent with a previous study (Zhao et al., 2005). The overexpression of the receptor on the membrane implicates a functional importance of this receptor. Indeed, overexpression of B2R on glioma cells has been shown to enhance BK-mediated tumor blood–brain barrier permeability increase (Uchida et al., 2002). A number of later studies further supported this finding by using small concentrations of BK to insure better and more efficient drug delivery to malignant brain tumors (Sarin et al., 2009; Wang and Liu, 2009; Xia et al., 2009; Zhang et al., 2009; Côté et al., 2010). Of note, B2R was also expressed in normal brain, were it associated with GFAP-positive astrocytes, yet highest levels of expression were found in gliomas associated with blood vessels. While BK may enhance the delivery of chemotherapeutics to the brain, our data suggest a secondary, undesired effect of BK in enhancing invasion and possibly increasing rather than diminishing the formation of satellite tumors. Of interest, under our experimental conditions, we demonstrated a significant increase in both velocity and distance traveled by the cells when exposed to a BK concentration gradient. Evidently, BK enhances motility of glioma cells. Our finding that in vitro migration is significantly increased in the presence of BK compared with control, is in agreement with a recent study in human chondrosarcoma (Yang et al., 2010), suggesting that this effect may apply to other cancers as well. A recent report suggests that BK enhances migration of C6 rat glioma cells and U251 human glioma cells in vitro through B1R activation of PI-3 kinase/AKT signaling cascade (Lu et al., 2010). Our data show only very low expression of B1R, but very prominent expression of B2R, and together with data from functional experiments, pharmacological manipulation and knock down of B2R suggest that B2R is the principle BK receptor in gliomas. This agrees with Lu et al. (2010) suggesting bradykinin as a ligand stimulating glioma migration.
Downstream of B2R activation is intracellular Ca2+ mobilization. Rat glioma C6 cells are sensitive to low dose of BK that selectively increases intracellular Ca2+ concentration (Wang and Liu, 2009). Similarly, we showed, based on the intracellular calcium change after BK treatment that human glioma cells also rapidly respond to a low dose of BK, and longer exposure to BK resulted in characteristic Ca2+ oscillations shown to be an underlying pattern for migration of cerebellar granule cells. As previously mentioned, the significance of calcium-dependent migration of astrocytoma (Rondé et al., 2000; Giannone et al., 2002) and neurons (Komuro and Rakic, 1996) has been reported by several groups. Interestingly, our data suggest a surprising, privileged role for BK-mediated Ca2+ signals in cell migration since other effectors, namely ACh and ATP, which both enhanced intracellular Ca2+ failed to influence cell migration. Most likely, signals downstream from Ca2+ are differentially activated and warrant further study. However, these data does not exclude the possibility that glioma cells could be sensitive to all of these ligands in situ.
Since BK is present in physiological conditions in the normal brain, its effects on normal glia have previously been studied and multiple effects of BK on glial cells have been described. For example, BK induces glutamate release (Parpura et al., 1994), MMP-9 expression and cell migration in normal astrocytes (Hsieh et al., 2008). Similar effects of BK were demonstrated on microglial migration (Ifuku et al., 2007). These studies together with our findings suggest that BK acts broadly as a stimulator of migration in normal and malignant glia. The here described effects of BK on glioma invasion acting as chemotactic ligand attracting glioma cells to blood vessels had been previously unknown. Importantly, even in this system, BK appears to have multiple effects since our data also suggests an activation of MMPs in the presence of BK. Proteolysis is a crucial part of the invasion process, since tissue remodeling is necessary as cells invade through brain tissue. Both effects may work synergistically to enhance a more effective invasion. In addition, as bradykinin enhances glioma cells motility, cells can become more prone and exposed to other chemotactic clues in their environment.
Invasion is a complex process that involves several coordinated phases: detachment from the primary tumor tissue, establishment new contacts with the environment, degradation and remodeling the extracellular matrix (ECM) and migration into healthy tissue (Rao, 2003). Once detached, glioma cells are exposed to the same signaling molecules as any other normal cell in the brain. They disperse along myelinated nerve fibers, subependymal layers and vasculature (Zagzag et al., 2008). However, the signals that attract them to and keep them on along these “highways” are not well understood. Therefore, the most interesting finding of our studies came from our slice invasion experiments. Our data suggest an important role for BK signaling in assuring that glioma cells find blood vessels to associate with. The number of cells attached to the blood vessels in the presence of BK dramatically increased when compared with control. Moreover, glioma cells invade deeper into the brain tissue when exposed to BK. These data imply that endothelial cells, by initiating BK production may provide an important cue for glioma cells to find blood vessels which is crucial for the cells to obtain sufficient nutrients to develop satellite tumors. This is clearly not the only signaling mechanism as even in the presence of a B2R antagonist some glioma cells still associate with blood vessels. Interestingly, we observed the reduction in the number of glioma cells attached to blood vessels below control level when slices were bathed either in the presence of BK with the antagonist, or the antagonist alone suggesting a disruption of endogenous BK signaling. This may involve interaction with normal brain cells as they also express B2R. For example, BK induces release of a number of signaling molecules from astrocytes such are glutamate, d-serine, ATP to name a few (Parpura et al., 1994; Verderio and Matteoli, 2001; Montana et al., 2004; Martineau et al., 2008). Any and/or all of these compounds can stimulate glioma migration (Lyons et al., 2007). If HOE 140 blocks B2R on astrocytes, the release would be blocked as well and the effect would be significantly reduced. While in vitro data suggest a direct effect of BK on glioma, the slice experiments imply that more complex signaling and cross talk between normal brain cells and glioma may be involved. We cannot distinguish between direct and indirect effects involving other brain cells in this study, but this question may warrant future studies.
Despite improvements in the diagnosis and treatment of patients with glial tumors, they remain the most common and least curable brain cancer in adults. The ability of glioma cells to infiltrate surrounding brain tissue, and ultimately escape current therapeutic interventions, could potentially be minimized using anti-invasive therapies. This study discloses a hitherto unknown effect of BK on glioma cells. Considering the strong effect of BK on glioma invasion and the prominent expression B2R that correlates with the grade of glioma, B2R emerges as an attractive therapeutic target. Developments of pharmaceutical approaches that target B2R, though for different condition, are well under way. In July 2008, icatibant (Firazyr; Jerini AG), a B2R antagonist, was granted market authorization by the European Commission for the symptomatic treatment of acute attacks of hereditary angioedema. (Bork et al., 2008). As a single therapeutic approach is proven to be ineffective in curing neoplasms, it is necessary to develop combined strategies to fight uncontrollable growth and dissemination. It is conceivable that B2R arises as one of the targets.
Footnotes
This work has been supported by National Institutes of Health Grants RO1-NS036692, RO1-NS052634, and RO1-NS031234. V.M. is supported by an American Brain Tumor Association Basic Research Fellowship.
References
- Bordey A, Sontheimer H, Trouslard J. Muscarinic activation of BK channels induces membrane oscillations in glioma cells and leads to inhibition of cell migration. J Membr Biol. 2000;176:31–40. doi: 10.1007/s00232001073. [DOI] [PubMed] [Google Scholar]
- Bork K, Yaosothan U, Kirckpatrick P. Icatibant. Nat Rev Drug Discovery. 2008;7:801–802. [Google Scholar]
- Coller KE, Berger KL, Heaton NS, Cooper JD, Yoon R, Randall G. RNA interference and single particle tracking analysis of hepatitis C virus endocytosis. PLoS Pathog. 2009;5:e1000702. doi: 10.1371/journal.ppat.1000702. [DOI] [PMC free article] [PubMed] [Google Scholar]
- Côté J, Savard M, Bovenzi V, Dubuc C, Tremblay L, Tsanaclis AM, Fortin D, Lepage M, Gobeil F., Jr Selective tumor blood-brain barrier opening with the kinin B2 receptor agonist [Phe(8)psi(CH(2)NH)Arg(9)]-BK in a F98 glioma rat model: an MRI study. Neuropeptides. 2010;44:177–185. doi: 10.1016/j.npep.2009.12.009. [DOI] [PubMed] [Google Scholar]
- Deshane J, Garner CC, Sontheimer H. Chlorotoxin inhibits glioma cell invasion via matrix metalloproteinase-2. J Biol Chem. 2003;278:4135–4144. doi: 10.1074/jbc.M205662200. [DOI] [PubMed] [Google Scholar]
- Ewert S, Johansson B, Holm M, Helander HF, Fandriks L. The bradykinin BK2 receptor mediates angiotensin II receptor type 2 stimulated rat duodenal mucosal alkaline secretion. BMC Physiol. 2003;3:1. doi: 10.1186/1472-6793-3-1. [DOI] [PMC free article] [PubMed] [Google Scholar]
- Fabian A, Fortmann T, Bulk E, Bomben VC, Sontheimer H, Schwab A. Chemotaxis of MDCK-F cells toward fibroblast growth factor-2 depends on transient receptor potential canonical channel. Pflugers Arch. 2011;461:295–306. doi: 10.1007/s00424-010-0901-6. [DOI] [PubMed] [Google Scholar]
- Friedberg MH, Glantz MJ, Klempner MS, Cole BF, Perides G. Specific matrix metalloproteinase profiles in the cerebrospinal fluid correlated with the presence of malignant astrocytomas, brain metastases, and carcinomatous meningitis. Cancer. 1998;82:923–930. doi: 10.1002/(sici)1097-0142(19980301)82:5<923::aid-cncr18>3.0.co;2-2. [DOI] [PubMed] [Google Scholar]
- Giannone G, Rondé P, Gaire M, Haiech J, Takeda K. Calcium oscillations trigger focal adhesion disassembly in human U87 astrocytoma cells. J Biol Chem. 2002;277:26364–26371. doi: 10.1074/jbc.M203952200. [DOI] [PubMed] [Google Scholar]
- Habela CW, Ernest NJ, Swindall AF, Sontheimer H. Chloride accumulation drives volume dynamics underlying cell proliferation and migration. J Neurophysiol. 2009;101:750–757. doi: 10.1152/jn.90840.2008. [DOI] [PMC free article] [PubMed] [Google Scholar]
- Higashida H, Yokoyama S, Hoshi N, Hashii M, Egorova A, Zhong ZG, Noda M, Shahidullah M, Taketo M, Knijnik R, Kimura Y, Takahashi H, Chen XL, Shin Y, Zhang JS. Signal transduction from bradykinin, angiotensin, adrenergic and muscarinic receptors to effector enzymes, including ADP-ribosyl cyclase. Biol Chem. 2001;382:23–30. doi: 10.1515/BC.2001.004. [DOI] [PubMed] [Google Scholar]
- Hsieh HL, Wu CY, Yang CM. Bradykinin induces matrix metalloproteinase-9 expression and cell migration through a PKC-delta-dependent ERK/Elk-1 pathway in astrocytes. Glia. 2008;56:619–632. doi: 10.1002/glia.20637. [DOI] [PubMed] [Google Scholar]
- Ifuku M, Färber K, Okuno Y, Yamakawa Y, Miyamoto T, Nolte C, Merrino VF, Kita S, Iwamoto T, Komuro I, Wang B, Cheung G, Ishikawa E, Ooboshi H, Bader M, Wada K, Kettenmann H, Noda M. Bradykinin-induced microglial migration mediated by B1-bradykinin receptors depends on Ca2+ influx via reverse-mode activity of the Na+/Ca2+ exchanger. J Neurosci. 2007;27:13065–13073. doi: 10.1523/JNEUROSCI.3467-07.2007. [DOI] [PMC free article] [PubMed] [Google Scholar]
- Ishiuchi S, Tsuzuki K, Yoshida Y, Yamada N, Hagimura N, Okado H, Miwa A, Kurihara H, Nakazato Y, Tamura M, Sasaki T, Ozawa S. Blockage of Ca(2+)-permeable AMPA receptors suppresses migration and induces apoptosis in human glioblastoma cells. Nat Med. 2002;8:971–978. doi: 10.1038/nm746. [DOI] [PubMed] [Google Scholar]
- Jacobelli J, Bennett FC, Pandurangi P, Tooley AJ, Krummel MF. MF Myosin-IIA and ICAM-1 regulate the interchange between two distinct modes of T cell migration. J Immunol. 2009;182:2041–2050. doi: 10.4049/jimmunol.0803267. [DOI] [PubMed] [Google Scholar]
- Joseph K, Kaplan AP. Formation of bradykinin: a major contributor to the innate inflammatory response. Adv Immunol. 2005;86:159–208. doi: 10.1016/S0065-2776(04)86005-X. [DOI] [PubMed] [Google Scholar]
- Kaba SE, Kyritsis AP. Recognition and management of gliomas. Drugs. 1997;53:235–244. doi: 10.2165/00003495-199753020-00004. [DOI] [PubMed] [Google Scholar]
- Komuro H, Rakic P. Intracellular Ca2+ fluctuations modulate the rate of neuronal migration. Neuron. 1996;17:275–285. doi: 10.1016/s0896-6273(00)80159-2. [DOI] [PubMed] [Google Scholar]
- Kronlage M, Song J, Sorokin L, Isfort K, Schwerdtle T, Leipziger J, Robaye B, Conley PB, Kim HC, Sargin S, Schön P, Schwab A, Hanley PJ. Autocrine purinergic receptor signaling is essential for macrophage chemotaxis. Sci Signal. 2010;3:ra55. doi: 10.1126/scisignal.2000588. [DOI] [PubMed] [Google Scholar]
- Laerum OD, Bjerkvig R, Steinsvåg SK, de Ridder L. Invasiveness of primary brain tumors. Cancer Metastasis Rev. 1984;3:223–236. doi: 10.1007/BF00048386. [DOI] [PubMed] [Google Scholar]
- Lu DY, Leung YM, Huang SM, Wong KL. Bradykinin-induced cell migration and COX-2 production mediated by the bradykinin B1 receptor in glioma cells. J Cell Biochem. 2010;110:141–150. doi: 10.1002/jcb.22520. [DOI] [PubMed] [Google Scholar]
- Lyons SA, Chung WJ, Weaver AK, Ogunrinu T, Sontheimer H. Autocrine glutamate signaling promotes glioma cell invasion. Cancer Res. 2007;67:9463–9471. doi: 10.1158/0008-5472.CAN-07-2034. [DOI] [PMC free article] [PubMed] [Google Scholar]
- Martineau M, Galli T, Baux G, Mothet JP. Confocal imaging and tracking of the exocytotic routes for d-serine-mediated gliotransmission. Glia. 2008;56:1271–1284. doi: 10.1002/glia.20696. [DOI] [PubMed] [Google Scholar]
- Martins AH, Alves JM, Trujillo CA, Schwindt TT, Barnabé GF, Motta FL, Guimaraes AO, Casarini DE, Mello LE, Pesquero JB, Ulrich H. Kinin-B2 receptor expression and activity during differentiation of embryonic rat neurospheres. Cytometry A. 2008;73:361–368. doi: 10.1002/cyto.a.20519. [DOI] [PubMed] [Google Scholar]
- Montana V, Ni Y, Sunjara V, Hua X, Parpura V. Vesicular glutamate transporter-dependent glutamate release from astrocytes. J Neurosci. 2004;24:2633–2642. doi: 10.1523/JNEUROSCI.3770-03.2004. [DOI] [PMC free article] [PubMed] [Google Scholar]
- Moreau ME, Garbacki N, Molinaro G, Brown NJ, Marceau F, Adam A. The kallikrein-kinin system: current and future pharmacological targets. J Pharmacol Sci. 2005;99:6–38. doi: 10.1254/jphs.srj05001x. [DOI] [PubMed] [Google Scholar]
- Parpura V, Basarsky TA, Liu F, Jeftinija K, Jeftinija S, Haydon PG. Glutamate-mediated astrocyte-neuron signalling. Nature. 1994;369:744–747. doi: 10.1038/369744a0. [DOI] [PubMed] [Google Scholar]
- Raidoo DM, Sawant S, Mahabeer R, Bhoola KD. Kinin receptors are expressed in human astrocytic tumour cells. Immunopharmacology. 1999;43:255–263. doi: 10.1016/s0162-3109(99)00097-1. [DOI] [PubMed] [Google Scholar]
- Rao JS. Molecular mechanisms of glioma invasiveness: the role of proteases. Nat Rev Cancer. 2003;3:489–501. doi: 10.1038/nrc1121. [DOI] [PubMed] [Google Scholar]
- Ratajczak MZ, Zuba-Surma E, Kucia M, Reca R, Wojakowski W, Ratajczak J. The pleiotropic effects of the SDF-1-CXCR4 axis in organogenesis, regeneration and tumorigenesis. Leukemia. 2006;20:1915–1924. doi: 10.1038/sj.leu.2404357. [DOI] [PubMed] [Google Scholar]
- Reetz G, Reiser G. [Ca2+]i oscillations induced by bradykinin in rat glioma cells associated with Ca2+ store-dependent Ca2+ influx are controlled by cell volume and by membrane potential. Cell Calcium. 1996;19:143–156. doi: 10.1016/s0143-4160(96)90083-4. [DOI] [PubMed] [Google Scholar]
- Rondé P, Giannone G, Gerasymova I, Stoeckel H, Takeda K, Haiech J. Mechanism of calcium oscillations in migrating human astrocytoma cells. Biochim Biophys Acta. 2000;1498:273–280. doi: 10.1016/s0167-4889(00)00102-6. [DOI] [PubMed] [Google Scholar]
- Sarin H, Kanevsky AS, Fung SH, Butman JA, Cox RW, Glen D, Reynolds R, Auh S. Metabolically stable bradykinin B2 receptor agonists enhance transvascular drug delivery into malignant brain tumors by increasing drug half-life. J Transl Med. 2009;7:33. doi: 10.1186/1479-5876-7-33. [DOI] [PMC free article] [PubMed] [Google Scholar]
- Uchida M, Chen Z, Liu Y, Black KL. Overexpression of bradykinin type 2 receptors on glioma cells enhances bradykinin-mediated blood-brain tumor barrier permeability increase. Neurol Res. 2002;24:739–746. doi: 10.1179/016164102101200753. [DOI] [PubMed] [Google Scholar]
- Verderio C, Matteoli M. ATP mediates calcium signaling between astrocytes and microglial cells: modulation by IFN-gamma. J Immunol. 2001;166:6383–6391. doi: 10.4049/jimmunol.166.10.6383. [DOI] [PubMed] [Google Scholar]
- Wang YB, Liu YH. Bradykinin selectively modulates the blood-tumor barrier via calcium-induced calcium release. J Neurosci Res. 2009;87:660–667. doi: 10.1002/jnr.21896. [DOI] [PubMed] [Google Scholar]
- Wang YB, Peng C, Liu YH. Low dose of bradykinin selectively increases intracellular calcium in glioma cells. J Neurol Sci. 2007;258:44–51. doi: 10.1016/j.jns.2007.02.031. [DOI] [PubMed] [Google Scholar]
- Weaver AK, Bomben VC, Sontheimer H. Expression and function of calcium-activated potassium channels in human glioma cells. Glia. 2006;54:223–233. doi: 10.1002/glia.20364. [DOI] [PMC free article] [PubMed] [Google Scholar]
- Xia CY, Zhang Z, Xue YX, Wang P, Liu YH. Mechanisms of the increase in the permeability of the blood-tumor barrier obtained by combining low-frequency ultrasound irradiation with small-dose bradykinin. J Neurooncol. 2009;94:41–50. doi: 10.1007/s11060-009-9812-9. [DOI] [PubMed] [Google Scholar]
- Yang WH, Chang JT, Hsu SF, Li TM, Cho DY, Huang CY, Fong YC, Tang CH. Bradykinin enhances cell migration in human chondrosarcoma cells through BK receptor signaling pathways. J Cell Biochem. 2010;109:82–92. doi: 10.1002/jcb.22383. [DOI] [PubMed] [Google Scholar]
- Zagzag D, Esencay M, Mendez O, Yee H, Smirnova I, Huang Y, Chiriboga L, Lukyanov E, Liu M, Newcomb EW. Hypoxia- and vascular endothelial growth factor-induced stromal cell-derived factor-1alpha/CXCR4 expression in glioblastomas: one plausible explanation of Scherer's structures. Am J Pathol. 2008;173:545–560. doi: 10.2353/ajpath.2008.071197. [DOI] [PMC free article] [PubMed] [Google Scholar]
- Zhang Z, Xia C, Xue Y, Liu Y. Synergistic effect of low-frequency ultrasound and low-dose bradykinin on increasing permeability of the blood-tumor barrier by opening tight junction. J Neurosci Res. 2009;87:2282–2289. doi: 10.1002/jnr.22061. [DOI] [PubMed] [Google Scholar]
- Zhao Y, Xue Y, Liu Y, Fu W, Jiang N, An P, Wang P, Yang Z, Wang Y. Study of correlation between expression of bradykinin B2 receptor and pathological grade in human gliomas. Br J Neurosurg. 2005;19:322–326. doi: 10.1080/02688690500305555. [DOI] [PubMed] [Google Scholar]