

Abstract
Following phosphorylation, nuclear translocation of the mitogen-activated protein kinases (MAPKs), ERK1 and ERK2, is critical for both gene expression and DNA replication induced by growth factors. ERK nuclear translocation has therefore been studied extensively, but many details remain unresolved, including whether or not ERK dimerization is required for translocation. Here, we simulate ERK nuclear translocation with a compartmental computational model that includes systematic sensitivity analysis. The governing ordinary differential equations are solved with the backward differentiation formula and decoupled direct methods. To better understand the regulation of ERK nuclear translocation, we use this model in conjunction with a previously published model of the ERK pathway that does not include an ERK dimer species and with experimental measurements of nuclear translocation of wild-type ERK and a mutant form, ERK1-Δ4, which is unable to dimerize. Sensitivity analysis reveals that the delayed nuclear uptake of ERK1-Δ4 compared to that of wild-type ERK1 can be explained by the altered interaction of ERK1-Δ4 with phosphorylated MEK (MAPK/ERK kinase), and so may be independent of dimerization. Our study also identifies biological experiments that can verify this explanation.
1 Introduction
The mitogen-activated protein kinase (MAPK) pathway, present in all eukaryotes from yeast to human, has been described as a paradigm for cell signal transduction, and is one of the most intensively studied cell signal transduction pathways [1–3]. Many extracellular signals, including cytokines, growth factors, neurotransmitters and stress, activate the small GTPase Ras (Rat sarcoma). Activated Ras in turn initiates the sequential phosphorylation and activation of three protein kinases, MAP kinase kinase kinase (MAPKKK, whose family members include Raf (Ras-associated factor)), MAP kinase kinase (MAPKK, whose family members include MEK (mitogen-activated protein kinase/extracellular signal-regulated kinase kinase)) and MAPK (whose family members include ERK1 and ERK2). The phosphorylation of these three kinases, and subsequent translocation of phosphorylated MAPK to the nucleus and activation of transcription factors, mediates myriad cellular activities, including growth, proliferation, survival, differentiation and embryonic and postnatal development [4–6]. Abnormalities in this pathway are seen in various diseases, including obesity, diabetes, inflammatory diseases, cardiovascular disease and cancer [7, 8]. This pathway is also the target of many drugs [9, 10].
The Ras/Raf/MEK/ERK MAPK pathway has been extensively investigated clinically, experimentally and by mathematical modeling [2, 3, 8, 10–26]. In addition to the biochemical modifications associated with signaling, the nuclear translocation mechanisms of activated ERK1 and ERK2 have been studied in depth, because this movement is required for correct control of gene expression and of the linkage of altered localization to disease [12–15, 17, 20, 21, 24–26]. Nonetheless, many of the details of nuclear translocation are unknown [24]. In particular, it has been proposed that ERK exists in a monomer/dimer equilibrium that is shifted toward the dimer when phosphorylated [13]. However, it is unclear if ERK dimerization is [13, 20, 27] or is not [15, 21] required for nuclear translocation. In fact, Burack & Shaw [21] could not detect evidence of ERK dimerization by FRET (fluorescence resonance energy transfer) methods.
In this paper we study the ERK signal transduction pathway with a two-compartment (cytosol and nucleus) mathematical model. The ordinary differential equations (ODE’s) governing time rate of change of species’ concentrations in the different compartments due to chemical reaction and intercompartmental species translocation are solved by using the backward differentiation formula (BDF) method as implemented in the packaged code LSODE [28, 29]. The utility of mathematical modeling is enhanced by use of systematic sensitivity analysis [30–32], which provides basic methods to study parameter sensitivities, that is, changes in model behavior due to parameter variation [33]. Systematic sensitivity analysis generates automatically the first-order sensitivity coefficients of species concentrations with respect to problem parameters, such as initial conditions and rate constants. The ODE’s for sensitivity coefficients are solved with the decoupled direct method (DDM), using the same BDF method used to compute species’ concentrations [34–37].
We use our models to simulate real-time experimental measurements of ERK nuclear translocation (data kindly provided by the T. Jovin lab, Gottingen, Germany; Lidke et al., manuscript in preparation) in both wild-type ERK1 and a mutant form, ERK1-Δ4, which is unable to dimerize due to deletion of histidine 176 and 3 adjacent amino acids (i.e., deletion of amino acids 174–177) in the ERK dimerization domain [13, 20, 38]. The experimental results showed that although the mutant ERK accumulated in the nucleus at a slower rate than the wild-type ERK, the maximal level was approximately the same in the two types (Figure 1).
Figure 1.

Real-time measurements of relative total nuclear concentration of ERK as a function of time for wild-type ERK (solid circles and solid line) and a mutant form (solid squares and long-dashed line) unable to dimerize and simulation results. Our “wild-type model” (short-dashed line) and “mutant model” (dash-dot-dot-dashed line) were constructed from the model of Fujioka et al [25] (dotted line). (Experimental data from Lidke DS et al, manuscript in preparation.)
We use a previously published model of the Ras/MAPK pathway that does not include an ERK dimer species [25], together with systematic sensitivity analysis, to provide plausible biological explanations for the experimentally observed differences in nuclear translocation between the two ERK types. Significantly, sensitivity analyses of the cellular concentration of phosphorylated ERK (pERK) and its net rate of formation (i.e., time derivative of concentration) reveal that the observed differences in nuclear translocation of ERK between wild type and mutant can be explained by the slower phosphorylation kinetics of ERK by phosphorylated MEK (pMEK) and possibly also by delayed release of the phosphorylated ERK from the pMEK-pERK complex. It is not necessary to invoke the dimerization of ERK. The mathematical modeling also suggests biological experiments that can promote further understanding of the nuclear translocation of ERK.
2 Methods
2.1 Governing Ordinary Differential Equations
The complex biochemical pathways describing cellular signaling and other metabolic phenomena consist of large numbers of simultaneous elementary chemical reactions (i.e., real molecular events) among numerous species. Mathematical descriptions of the chemical kinetics of these pathways constitute sets of nonlinear, first order ordinary differential equations (ODE’s). The ODE describing the time rate of change of concentration of species i (yi) can be written as
| (1) |
for a reaction mechanism involving NR elementary reactions among NS chemical species. In equation (1), kj and k−j are the forward and reverse rate constants of reaction j.
The initial value problem is to solve the NS ordinary differential equations, equation (1), for the solution vector y (= yi, i = 1,…,NS) at one or more time points in a prescribed integration interval [t0, tend], where the value of y (= y0) at the initial time (t = t0) is given, as are the reaction mechanism and rate coefficient parameters, and tend is the endpoint of the integration interval.
2.2 Numerical Solution
To solve the ODE’s arising in signal transduction, equation (1), we used the backward differentiation formula (BDF) method built into the packaged code LSODE [28, 29], because it was shown to be the most efficient and accurate of several methods examined for solving the stiff ODE’s arising in combustion chemistry [36, 37, 39–42]. In this variable-step, variable-order, step by step method, starting with the known initial conditions at time t0, numerical approximations Yn (= Yi,n, i = 1,…,NS) to the exact solution y(tn) (= yi(tn), i = 1,…,NS) of the ODE’s are generated at discrete time points tn (n = 1,2,…). At each time step [tn−1, tn] the BDF method advances the solution by using the linear multistep formula
| (2) |
where qn and hn (= tn − tn−1) are, respectively, the order of numerical approximation and step size for the current step; the coefficients {αj} and β0 depend on qn; Yn−j is the numerical solution vector at tn−j (j = 1,…,qn); and Ẏn is the approximation to ẏ(tn), the exact derivative vector of y at tn. Equation (2) is solved by using a modified form of the Newton-Raphson predictor-corrector procedure [29, 37], because for chemical kinetics applications it has been shown to be the most efficient of the different iteration techniques built into LSODE [36, 37, 39, 40].
2.3 Sensitivity Analysis
The solution of the ODE’s describing chemical pathways depends on a number of parameters that are often not known exactly, such as the initial conditions and rate constants. The development of a reaction mechanism is both facilitated and made more accurate by systematic sensitivity analysis, which provides the basic methods to study parameter sensitivities; that is, changes in model behavior due to parameter variation [33]. Sensitivity analysis establishes relationships between the predictions of a kinetics model (i.e., the reaction mechanism) and the input parameters of the problem: initial condition values and rate constants. It helps to determine the effects of uncertainties in rate constants or errors in initial condition values on the model predictions, which ultimately are compared with experimental observations to assess adequacy of the model. The proposed kinetics model can also be fine-tuned by adjusting rate constants identified to be important, to match experimental data, as shown in the present work.
A method that is commonly used to study the effects of a small change in a parameter about its nominal value is to compute the first-order sensitivity coefficients Sj (= ∂y/∂ηj j = 1,…,NP) evaluated at the generally accepted nominal values {η̂k} [37]. Here y is the NS-dimensional solution vector, ηj a rate constant or an initial condition value, NP the total number of independent parameters, and Sj the sensitivity coefficient vector of length NS, whose element Si,,j = ∂yi/∂ηj (i = 1,…,NS).
We solve for the sensitivity coefficients by integrating their ODE’s, which can be obtained by differentiating equation (1) with respect to ηj. The result is
| (3) |
where J (= ∂f/∂y) is the NS×NS Jacobian matrix, with element Ji,j given by
| (4) |
In equation (3), the first term on the right-hand side accounts for the implicit dependence of f on ηj through y, and the second term takes into account any explicit dependence of f on ηj. The initial value of Sj, that is, Sj(t0), is equal to the jth column of the NS×NS identity matrix if ηj is the jth element of y0; if, however, ηj is a rate coefficient parameter, Sj(t0) = 0.
Several methods have been developed for solving equation (3) [34, 36, 37]. For chemical kinetics applications, the decoupled direct method (DDM) has shown greater efficiency and stability, with equal or better accuracy than the other methods [34, 36, 37], and was therefore adopted in the present work. The necessary FORTRAN subprograms were adapted from the general chemical kinetics and sensitivity analysis code LSENS [37, 43, 44].
In the DDM the same integration method, in particular the BDF method, is used to solve both the model and sensitivity differential equations, because the two systems of ODE’s have the same Jacobian [36]. If the BDF method of order qn, equation (2), is used to solve the ODE for Sj over the time step [tn−1,tn], the resulting formula is:
| (5) |
where Sj,n−ℓ [= Sj (tn−ℓ)] is the sensitivity coefficient vector at tn−ℓ(ℓ= 0,1,…,qn) and the NS×NS matrix P is given by
| (6) |
Here I is the NS×NS identity matrix and J is given by equation (4).
The sensitivity equations are solved in tandem with the model equations: at each time step, the solution to the model problem is first advanced, and then the sensitivity coefficients updated. For any time step [tn−1,tn], the solution Y to the model equations is advanced from tn−1 to tn by using LSODE; Yn is then used in equation (5) to update the sensitivity coefficients with respect to all required parameters. This process of advancing Y and then the {Sj} by the same time step, using the same method order, is repeated until the end of the integration interval.
2.3.1 Normalization of Sensitivity Coefficients
The sensitivity coefficients {Si,j = ∂Yi/∂ηj} may display artificial variation because of the differences in the magnitudes of the {Yi} and {ηj}. To remove this variation and enable meaningful comparisons for the different {Yi} and with respect to the different {ηj}, the {Si,j} are usually presented in normalized form. In this work we use the normalization procedure given by
| (7) |
where < Si,j > is the normalized sensitivity coefficient Si,j. The < Si,j > can then be interpreted as the percent change in Yi due to an uncertainty or change of 1 percent in ηj. Other procedures have also been developed when equation (7) cannot be used, for example, ηj = 0 [37].
2.4 Real-time measurement of ERK nuclear translocation
To improve understanding of the mechanism of cytosol-to-nuclear translocation of ERK, including the role of ERK dimerization, Lidke et al [manuscript in preparation] used green fluorescent protein (GFP)-ERK1 constructs in live ERK1-knockout mouse embryonic fibroblasts. The cells were starved for 12 hours, with subsequent addition of fetal calf serum providing the stimulus that activates the MAPK pathway, resulting in ERK translocation from the cytosol to the nucleus and activation of transcription factors. By using real-time imaging to measure GFP intensity, the total ERK in the two compartments could be followed accurately, as a function of time [20]. In addition to wild-type ERK1, the studies of Lidke et al measured the translocation behavior of a mutant ERK, ERK1-Δ4, which is incapable of dimerization because of deletion of amino acids 174–177 in the ERK dimerization domain [13, 20, 38].
3 Results and Discussion
Representative nuclear ERK concentration profiles obtained by Lidke et al [manuscript in preparation] by using green fluorescent protein and real-time imaging are shown in Figure 1 for the wild-type (solid circles and solid line) and mutant (solid squares and long-dashed line) ERK1. In this figure, the measured total nuclear concentration of ERK is normalized by its initial concentration (i.e., at time t = 0, when the stimulus is applied). We refer to this ratio as the relative total [ERKn]. Here total [ERKn] denotes the total nuclear concentration of ERK and the suffix “n” the nucleus. It is clear from Figure 1 that although the rate of nuclear accumulation of ERK is much slower for the mutant than for the wild-type ERK, the maximal relative amount is approximately the same for both types.
3.1 Simulating cytosol-to-nucleus ERK translocation
In an attempt to elucidate the experimentally observed differences in the relative total nuclear [ERK]-versus-time behavior of wild-type and mutant ERKs (Figure 1), we used the numerical methods described previously and a two-compartment (nucleus and cytosol) model of the Ras/Raf/MEK/ERK cascade to study the cytosol-to-nucleus ERK translocation process. The reaction mechanism used in our study was developed recently by Fujioka et al [25] and consists of 29 species and 29 reactions. Their reaction cascade starts with activation of the GEF-GAP pathway and of Ras, followed by binding and activation at the plasma membrane of Raf by Ras. The Ras-Raf complex then binds and activates MEK, which in turn binds and activates ERK. In addition, both phosphorylated MEK (pMEK) and unphosphorylated MEK bind ERK in both compartments. The essential features of the Ras/ERK MAPK reaction cascade are illustrated schematically in Figure 2; additional details are provided in the supplementary material [45] of Fujioka et al [25].
Figure 2.
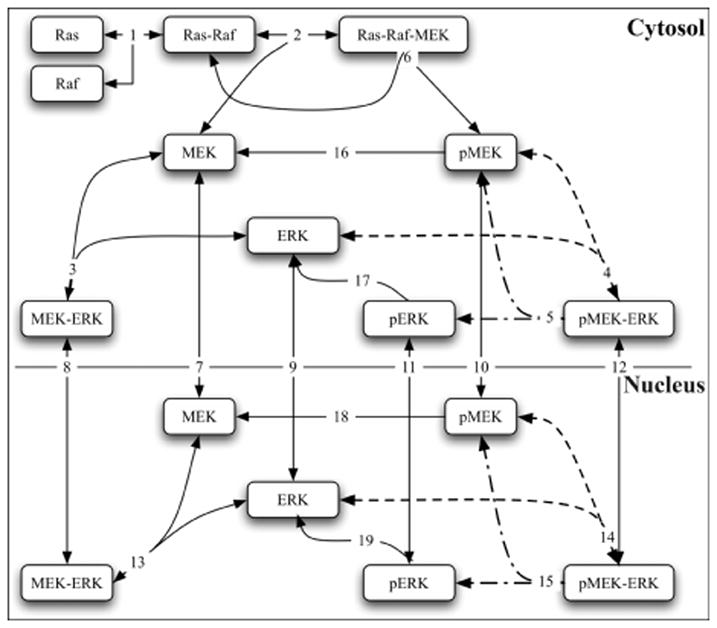
Essential features of the Ras/ERK MAPK reaction mechanism of Fujioka et al [25]. Reactions (4 and 14) whose forward rate constants were adjusted to derive our wild-type model are indicated by dashed lines. The additional reactions (5 and 15) whose forward rate constants were adjusted to derive our mutant model from the wild-type model are indicated by dash-dot-dashed lines.
The reaction mechanism includes reactions describing nuclear-to-cytosolic translocation of several species, including ERK and its phosphorylated state (pERK). It does not include an ERK dimer species and therefore provides an opportunity to explore for mechanisms other than the mutant’s inability to dimerize, to explain the experimentally observed differences in nuclear translocation of wild-type and mutant ERK. We used Fujioka et al’s model of the HeLa cell and their mass action chemical kinetics rate parameters for all reactions [25, 45]. Because 12 of the reactions are irreversible, the number of independent rate constants is 46 in our implementation of this reaction scheme. The reaction mechanism, rate constants and initial conditions are given in the Appendix and in the supplementary material [45] of Fujioka et al [25].
The initial concentration of nuclear ERK is zero in Fujioka et al’s model. However, even in quiescent cells, although ERK localization is mainly cytosolic, the species is present in the nucleus, albeit at low concentration [15, 17, 21, 24, 25]. We therefore first performed calculations without any stimulus for a period of 1000 seconds, in order to reach steady state and establish a nonzero initial [ERKn], the nuclear concentration of ERK. We then applied the stimulus to activate the GEF-GAP pathway and Ras, and studied the effect on relative total [ERKn].
The total nuclear ERK concentration normalized by its initial value, that is, the relative total [ERKn], calculated with this model is given in Figure 1 (dotted line), together with the experimentally measured profile for the wild-type ERK (solid circles and solid line). The total [ERKn] was computed by summing up the nuclear concentrations of all ERK-containing species, which in Fujioka et al’s model [25] include ERK, pERK, MEK-ERK, and pMEK-ERK. It is clear from Figure 1 that their model consistently under-predicts the measured relative total [ERKn]. Also, Figure 4A (which reproduces Fujioka et al’s [25] experimental profile for nuclear [ERK], given in their Figure 3) shows that their measured maximal relative total [ERKn] is approximately 1.8, in agreement with the experimental results given in Figure 1; thus their model under-predicts their measured relative total [ERKn].
Figure 4.

Comparisons of Fujioka et al’s [25] experimental results (solid and dash-dot-dot-dashed lines) with our wild-type model calculations (dashed line) and their model results (dotted line) for (A) relative total nuclear concentration of ERK and (B) cellular concentration of phosphorylated ERK. (WB: Western blotting; probe: FRET Imaging.)
Figure 3.

Root-mean-square (rms) error in the computed relative total nuclear concentration of ERK for the wild-type ERK is shown as a function of the factor multiplying the nominal value for k4 and k14, the forward rate constants for the reversible reaction describing the binding of ERK by phosphorylated-MEK in the cytosol and nucleus, respectively.
3.2 Improving the reaction mechanism to match wild-type ERK translocation data: Development of “wild-type model”
According to Fujioka et al [25], their model also predicts lower maximal [pERK] and slower kinetics than their experimental observations. Increasing the rate of the phosphorylation step pMEK-ERK → pMEK + pERK (reactions 5 in the cytosol and 15 in the nucleus; see Figure 2) accelerated ERK phosphorylation. However, a 16-fold increase in the rate of this reaction resulted in less than doubling of the maximal [pERK] [45; supplementary Figure 7]. It is also clear from Figure 4B (which reproduces Fujioka et al’s [25] experimental and theoretical profiles for cellular [pERK], given in their Figure 7) that the phosphorylation kinetics of ERK predicted by their model is significantly slower than their measured [pERK]-versus-time profile indicates, especially at early times. In addition, it has been shown experimentally that phosphorylation of ERK promotes its nuclear translocation, and may even be necessary for its nuclear retention [12–14, 17, 20, 24, 26]. For example, Horgan and Stork [20] observed that ERK2 mutated at the phosphorylation sites did not translocate to the nucleus following growth factor stimulation.
We therefore investigated if increasing [pERK] is the key to obtaining better agreement between the measured and predicted relative total [ERKn]. We first performed systematic sensitivity analyses of cellular [pERK] and its temporal derivative (i.e., d(cellular [pERK])/dt) with respect to rate constants, with provision made in the calculation procedure for the different volumes of the two compartments. The goal of this numerical “experiment” was two-fold: (1) to identify the most important rate constant to [pERK] and d([pERK])/dt and (2) to determine if the identified rate constant could be modified so as to adequately reproduce the experimental relative total [ERKn]-versus-time profile for the wild type. We focused attention on the time interval [0,120s], because this is the time period when the experimental relative total [ERKn] increases much more rapidly than the calculated relative total [ERKn] (Figure 1).
Sensitivity analysis with respect to rate constants showed that k4 (the forward rate constant of reaction 4) is the most important rate constant for cellular [pERK] and, for t ≤ 60 s, for d(cellular [pERK])/dt. The corresponding reaction describes the rate at which the kinase pMEK binds ERK in the cytosol:
which is reaction 4 in Fujioka et al’s [25] mechanism (see Figure 2 and Appendix). It is noteworthy that binding of ERK by pMEK is more important than the phosphorylation of ERK by pMEK (k5 and k15 of reactions 5 and 15 in the cytosol and nucleus, respectively; see below). This finding may explain why increasing the phosphorylation rate of ERK by Fujioka et al [25] did not result in significantly improved agreement of their computed [pERK] with their experimental measurements.
To investigate the effect of the rate of ERK binding by pMEK on relative total [ERKn] we progressively increased k4, as well as equally the rate of the corresponding nuclear reaction (k14), and examined the root-mean-square (rms) error in the computed relative total [ERKn] compared to the experimental relative total nuclear [ERKn]. Shown in Figure 3 is the rms error in the computed solution as a function of the factor multiplying k̂4 and k̂14, where the carets denotes nominal values determined by Fujioka et al [25]. The rms error is a minimum (of approximately 2 percent) for a factor of 13.
For this multiplicative factor (= 13) for k4 and k14, the predicted relative total [ERKn]-versus-time profile is shown in Figure 1 (short-dashed line). It is clear that the agreement between the computed results and the wild-type experimental data is excellent. For clarity in presentation, we will define the mechanism as revised above (i.e., with the modified k4 and k14) to be the “wild-type model.” The reactions whose forward rate constants were adjusted to derive our wild-type model are illustrated by dashed lines in Figure 2.
3.3 Revised mechanism improves agreement with Fujioka et al’s measured profiles of nuclear [ERK] and cellular [pERK]
Our wild-type model also produced better agreement with the experimental results of Fujioka et al [25] for both nuclear [ERK] and cellular [pERK] than the original model, especially at early times (see Figure 4, which reproduces Fujioka et al’s [25] experimental profile for nuclear [ERK] and experimental and theoretical profiles for cellular [pERK], given in their Figures 3 and 7). Indeed, for t ≤ 10 min the wild-type model (dashed line) essentially reproduces Fujioka et al’s experimental profile (solid line) for the relative total [ERKn], Figure 4A. Our model also agrees with their peak value of approximately 1.8. At later times our model predicts higher relative total [ERKn] than measured by Fujioka et al.1
We examined whether this behavior was caused by differences in the predicted versus measured cellular [pERK], because of the acceleration of net ERK nuclear import upon phosphorylation, as discussed above. It has also been proposed that return of ERK to the cytosol can be explained by ERK dephosphorylation and reforming of the MEK-ERK complex [21]. Given in Figure 4B are the cellular [pERK]-versus-time results computed with our wild-type model (dashed line) and Fujioka et al’s experimental measurements of cellular [pERK] using two different techniques (solid line and dash-dot-dot-dashed line). Up to and including the peak of approximately 0.56 μM, our modeling results show excellent agreement with the experimental results of Fujioka et al [25]. Their calculation (dotted line in Figure 4B) displays a peak value of only approximately 0.25 μM. After the peak our results show a slower decrease in [pERK] than observed experimentally. Thus the higher calculated than measured [ERKn] may be due to overpredicting [pERK].
Fujioka et al’s calculation of [pERK] also shows this behavior, as do five other rate coefficient parameter sets used in their study [25; Figure 8]. The reason for the relatively slow decline shown by the modeling results is not known. Fujioka et al [25] ascribe the lack of rapid decrease in the computed [pERK] after peaking to lack of feedback loops in their model and to underestimation of rate constants for phosphatase reactions.
Our goal was to examine whether differences in nuclear entry of wild-type ERK and of a mutant form that does not dimerize could be explained without invoking the dimerization hypothesis. Net entry of ERK into the nucleus occurs approximately in the first 10 minutes after stimulation (Figure 4), which is therefore the time period of interest in this study. During this time period our wild-type model reproduces the experimental results obtained in two different laboratories (Figures 1 and 4). Thereafter, dephosphorylation of pERK occurs and net transport of ERK is export from the nucleus, which may involve additional reactions. Studying the behavior during this time period was not an objective of this study and therefore we did not investigate it in detail.
3.4 Mechanism modification to match mutant ERK translocation data: Building the “mutant model”
Having established the required modification to Fujioka et al’s mechanism [25] to match the experimental data for wild-type ERK, we addressed the question of whether differences in ERK phosphorylation alone could explain the different ERK nuclear accumulation profiles for the wild type and mutant, Figure 1. For example, decreased phosphorylation has previously been observed experimentally in other ERK mutants [11]. And, as discussed above, phosphorylation of ERK promotes its nuclear translocation, and may even be necessary for its nuclear retention. Further evidence to support our hypothesis is provided by the experimental studies of Burack and Shaw [21] and Yazicioglu et al [26] with another dimer-deficient ERK2 mutant, L4A/H176E, which involves mutation of histidine 176 and four other amino acids [13, 21, 26]. Live cell imaging showed that the mutant and wild-type ERKs translocated into the nucleus at the same rate [21]. There was also no significant difference in the lag time to entry or maximal relative nuclear concentration of ERK. In addition, for this mutant the nuclear import of ERK and its phosphorylated state were the same as for the wild-type [26].
To elucidate the reason for the different ERK nuclear translocation profiles for the two ERK types, we therefore again performed systematic sensitivity analyses of both cellular [pERK] and d(cellular [pERK])/dt, this time using our wild-type model; that is, with the new rate constants, k4 and k14, for the binding of ERK by pMEK in the two compartments. Again, because the differences in the wild-type and mutant ERK are most pronounced at early times (Figure 1), attention was focused on t ≤ 120 s. Sensitivity analysis of our wild-type model with respect to rate constants showed that reaction 5 in Fujioka et al’s mechanism [25]:
that is, the irreversible phosphorylation of ERK by pMEK and release of the phosphorylated ERK from the pMEK-pERK complex in the cytosol (Figure 2), was now the most important reaction for both cellular [pERK] and d(cellular [pERK])/dt.
Because the relative total [ERKn] of the mutant is significantly less than that of the wild type at early times (Figure 1), k5 (and the rate constant, k15, of the corresponding nuclear reaction) has to be decreased to produce the observed behavior. We progressively decreased these two rate constants by the same amount until the difference in the calculated and measured relative total [ERKn] was minimized. The rms error in the computed solution as a function of the factor (≤1) multiplying the k̂5 and k̂15 values determined by Fujioka et al [25] is presented in Figure 5. The rms error is a minimum (of approximately 3 percent) for a factor of 0.33.
Figure 5.

Root-mean-square (rms) error in the computed relative total nuclear concentration of ERK for the mutant ERK is shown as a function of the factor multiplying the nominal value for k5 and k15, the forward rate constants for the irreversible reaction describing the phosphorylation of ERK bound to phosphorylated-MEK in the cytosol and nucleus, respectively.
The computed relative total [ERKn] using these new values for k5 and k15 is shown in Figure 1 (dash-dot-dot-dashed line), along with the experimental results for the ERK mutant (solid squares and long-dashed line). The agreement between the calculated and measured profiles is very good. The new mechanism that best fits the mutant data (i.e., with the revised rate constants k4, k14, k5 and k15) is defined to be the “mutant model.” The additional reactions (5 and 15) whose forward rate constants were adjusted to derive our mutant model from the wild-type model are indicated by dash-dot-dashed lines in Figure 2.
3.5 Sensitivity analysis suggests biological mechanisms for differences in nuclear translocation of wild-type and mutant ERK, without invoking ERK dimerization
The reaction mechanism constructed by Fujioka et al [25] does not include an ERK dimer. Our modeling results therefore suggest that a possible explanation for the observed differences in nuclear translocation between wild-type and mutant ERK that does not require invocation of a dimer hypothesis lies in the slower phosphorylation kinetics of ERK by the kinase pMEK and possibly also in delayed release of the phosphorylated ERK from the pMEK-pERK complex. Dramatically decreased phosphorylation of ERK has previously been reported in other ERK1 mutants [11]. Also, the release of ERK from the ERK/MEK complex has been hypothesized as probably being the rate-limiting step for ERK translocation and dimerization of ERK is not necessary for nuclear import [21].
To examine the effects of these modifications to k5 and k15 on cellular [pERK] we compare in Figure 6 the cellular [pERK] computed with the mutant model (dash-dot-dot-dashed line) and the wild-type model (solid line). Compared to the wild-type model, the mutant model displays not only the expected slower phosphorylation kinetics of ERK, but also much lower maximal cellular [pERK]. Now, delayed release of pERK from the cytosolic pMEK-pERK complex can also contribute to the delay in nuclear entry of mutant ERK. The rate and level of ERK phosphorylation in both mutant and wild type are required to estimate the relative contributions of phosphorylation kinetics and pMEK-pERK stability to the delay in nuclear entry of mutant ERK. For example, deletion of amino acids 174–177 in the mutant ERK2-Δ4 had little effect on the concentration of pERK after incubation with active MEK for 90 minutes [38]. Also, nuclear import of phosphorylated ERK2-L4A/H176E was the same as for the wild type [26].
Figure 6.

Computed cellular concentration of phosphorylated ERK, [pERK], versus reaction time for the wild-type model (solid line) compared with cellular [pERK] (dash-dot-dot-dashed line) and cellular ([pERK] + [pMEK-ERK]) (dashed line) versus time profiles for the mutant model.
To investigate whether the difference in the computed maximal [pERK] levels in wild-type and mutant ERK was due to delayed release of the phosphorylated ERK from the pMEK-pERK complex in the mutant, we computed the cellular ([pERK] + [pMEK-ERK]), where [pMEK-ERK] equals the concentration of phosphorylated ERK still associated with pMEK. This total cellular concentration, given in Figure 6 (dashed line), is seen to correspond more closely with the wild-type model results than just cellular [pERK]. Thus the modeling results indicate that if the maximal cellular [pERK] is the same for both wild-type and mutant ERKs, the rate at which phosphorylated ERK is released from the pMEK-pERK complex is also decreased. That is, compared to the wild type, not only is the phosphorylation kinetics of ERK by the kinase pMEK significantly slower for the mutant, but also the binding of pERK by pMEK is stronger for the mutant.
Our finding that the possibly increased stability of the pMEK-pERK complex in the ERK1-Δ4 mutant may also account for its delayed nuclear uptake compared to wild type is consistent with the model of Burack and Shaw [21], who demonstrated that the interaction between ERK and MEK is largely responsible for cytosolic localization of ERK, and have hypothesized that the rate-limiting step for ERK nuclear translocation is release of ERK from the MEK-ERK complex. Deletion of the four amino acids 174–177 may alter the interaction of pERK with pMEK, delaying release of pERK from the pMEK-pERK complex. For example, Robinson et al [38] suggest that this deletion in ERK2 may alter the conformation of the activation loop and impair the interaction of the ERK2-Δ4 mutant with underlying structures. Also, Wolf et al [46] found that the dissociation of ERK2 from MEK1 upon stimulation depends on amino acid residues 176–181. Deletion of the three amino acids 176–178 appeared to prevent this stimulation-induced dissociation.
3.6 Sensitivity analysis suggests experiments to investigate mechanisms of delayed mutant nuclear translocation
Our modeling studies also suggest biological experiments that can help verify our results. Measurements by western blotting of the time-course of ERK phosphorylation induced by stimulus in the wild-type and mutant ERKs will determine if there is delayed phosphorylation of the mutant relative to the wild type. These experiments will also reveal any difference in the maximal levels of [pERK] for the wild-type and mutant ERKs during the initial period of rapid entry of ERK into the nucleus. Additionally, measurements of the stability of the pMEK-pERK complex (by co-immunoprecipitation and biochemical analyses or by use of contemporary imaging techniques such as FRET or fluorescence correlation microscopy) will establish whether there is delay in release of pERK from the pMEK-pERK complex in the mutant relative to the wild-type ERK. These experiments may also help elucidate the relative contributions of decreased phosphorylation kinetics of ERK and delayed release of pERK from pMEK-pERK to the delay in nuclear translocation of the mutant ERK.
4 Conclusions
An existing model of the Ras/ERK MAPK pathway, which does not include dimerized ERK, was used to study ERK nuclear translocation. We investigated whether experimentally observed differences in nuclear translocation of wild-type ERK and a mutant form unable to dimerize could be explained without having to appeal to dimerization of the wild type. The model had to be modified to match the experimental nuclear ERK concentration profile for the wild type. With this modification, the model also reproduced the experimentally measured maximal cellular phosphorylated ERK. Further, by decreasing the phosphorylation kinetics of ERK by phosphorylated MEK we were able to match the experimental nuclear ERK concentration profile for the mutant ERK. Therefore we conclude that a plausible biological explanation lies in the decreased phosphorylation kinetics for the mutant ERK. In addition, if the maximal phosphorylated ERK levels are the same for the two ERK types, we conclude that the release of pERK from the pMEK-pERK complex after phosphorylation of ERK is also delayed for the mutant, compared to the wild type.
Acknowledgments
We thank Drs. D. Bruna, D. Jacqmin, P. Parsons-Wingerter, J-C. Tsao and S. Yungster of NASA Glenn Research Center for helpful discussions, Dr. M. Matsuda of Osaka University for providing us with the ERK mechanism and the reviewers for helpful comments. This work was supported in part by NIH Grant P20 GM067594, supporting the New Mexico Center for Spatiotemporal Modeling of Cell Signaling. DSL was the recipient of a postdoctoral fellowship from the EU FP5 Grant QLG2-CT-2000-02278 awarded to TMJ.
7 Appendix
Species, reactions and nominal rate coefficient parameter values, compartmental volumes and initial conditions used to simulate ERK nuclear translocation (from Fujioka, A. et al. “Dynamics of the Ras/ERK MAPK Cascade as Monitored by Fluorescent Probes,” J. Biol. Chem., 281:8917–8926, 2006).
| Species | |||
| No. | Species Name | Abbreviation | Compartment |
| 1 | Ras-GTP | Rasy | Cytosol |
| 2 | Raf | Rafy | Cytosol |
| 3 | Ras-Raf | Ras-Rafy | Cytosol |
| 4 | Ras-Raf-MEK | Ras-Raf-MEKy | Cytosol |
| 5 | MEK | MEKy | Cytosol |
| 6 | ERK | ERKy | Cytosol |
| 7 | MEK-ERK | MEK-ERKy | Cytosol |
| 8 | phosphorylated MEK | pMEKy | Cytosol |
| 9 | phosphorylated ERK | pERKy | Cytosol |
| 10 | phosphorylated MEK-ERK | pMEK-ERKy | Cytosol |
| 11 | MEK | MEKn | Nucleus |
| 12 | ERK | ERKn | Nucleus |
| 13 | MEK-ERK | MEK-ERKn | Nucleus |
| 14 | phosphorylated MEK | pMEKn | Nucleus |
| 15 | phosphorlylated ERK | pERKn | Nucleus |
| 16 | phosphorylated MEK-ERK | pMEK-ERKn | Nucleus |
| 17 | “kinase” | kinasey | Cytosol |
| 18 | GEF | GEFy | Cytosol |
| 19 | GEF-kinase | GEF-kiny | Cytosol |
| 20 | phosphorylated GEF | pGEFy | Cytosol |
| 21 | p120-GAP | p120GAPy | Cytosol |
| 22 | p120-GAP-kinase | p120GAPk | Cytosol |
| 23 | pp120-GAP | pp120GAP | Cytosol |
| 24 | Ras-GDP | RasGDPy | Cytosol |
| 25 | Ras-GDP-pGEF | RDpGEFy | Cytosol |
| 26 | Ras-GTP-pp120-GAP | RTpp120G | Cytosol |
| 27 | GEFdegraded | GEFdegy | Cytosol |
| 28 | Effectors | Effecty | Cytosol |
| 29 | Ras-Effectors | RasEffy | Cytosol |
| Reactions and rate constants (units: micromolar and seconds) | |||
| No., | Reaction | Rate | constants |
| j | (kj and, for a reversible reaction, k−j) | ||
| 1 | Rasy + Rafy <=> Ras-Rafy | 0.49 | 0.049 |
| 2 | Ras-Rafy + MEKy <=> Ras-Raf-MEKy | 0.65 | 0.065 |
| 3 | MEKy + ERKy <=> MEK-ERKy | 0.88 | 0.088 |
| 4 | pMEKy + ERKy <=> pMEK-ERKy | 0.88 | 0.088 |
| 5 | pMEK-ERKy -> pMEKy + pERKy | 0.22 | |
| 6 | Ras-Raf-MEKy -> Ras-Rafy + pMEKy | 0.18 | |
| 7 | MEKn <=> MEKy N>C | 0.61 | 0.046 |
| 8 | MEK-ERKn <=> MEK-ERKy N>C | 0.26 | 0.035 |
| 9 | ERKn <=> ERKy N>C | 0.018 | 0.012 |
| 10 | pMEKn <=> pMEKy N>C | 0.54 | 0.04 |
| 11 | pERKn <=> pERKy N>C | 0.013 | 0.012 |
| 12 | pMEK-ERKn <=> pMEK-ERKy N>C | 0.26 | 0.035 |
| 13 | MEKn + ERKn <=> MEK-ERKn | 0.88 | 0.088 |
| 14 | pMEKn + ERKn <=> pMEK-ERKn | 0.88 | 0.088 |
| 15 | pMEK-ERKn -> pMEKn + pERKn | 0.22 | |
| 16 | pMEKy -> MEKy0.01 | ||
| 17 | pERKy -> ERKy0.014 | ||
| 18 | pMEKn -> MEKn0.01 | ||
| 19 | pERKn -> ERKn0.014 | ||
| 20 | GEFy + kinasey <=> GEF-kiny | 1.0 | 1.0 |
| 21 | GEF-kiny -> pGEFy + kinasey | 0.1 | |
| 22 | p120GAPy + kinasey <=> p120GAPk | 0.0125 | 0.002 |
| 23 | p120GAPk -> pp120GAP + kinasey | 5.0D-04 | |
| 24 | RasGDPy + pGEFy <=> RDpGEFy | 1.0 | 0.4 |
| 25 | RDpGEFy -> Rasy + pGEFy | 0.1 | |
| 26 | Rasy + pp120GAP <=> RTpp120GAP | 10.0 | 4.0 |
| 27 | RTpp120GAP -> RasGDPy + pp120GAP | 1.0 | |
| 28 | pGEFy -> GEFdegy0.003 | ||
| 29 | Rasy + Effecty <=> RasEffy | 10.0 | 1.0 |
In the above reactions:
The symbol “<=>” denotes a reversible reaction.
The symbol “->” denotes an irreversible reaction.
The symbol “N>C” denotes that the forward reaction is a nucleus-to-cytosol species translocation or “shuttling” reaction. The reverse reaction describes cytosol-to-nucleus species translocation.
Compartment Volumes
| Compartment | Volume (pL) |
| Cytosol | 0.94 |
| Nucleus | 0.22 |
Initial Conditions (micromolar)
| Rasy | 0.01 |
| Rafy | 0.013 |
| MEKy | 1.4 |
| ERKy | 0.96 |
| GEFy | 1.0 |
| p120GAPy | 0.5 |
| RasGDPy | 0.39 |
| Effecty | 2.0 |
| kinasey | 0.0 before stimulation |
| kinasey | 1.0 at time of stimulation |
Footnotes
However, a different, independent experimental relative total [ERKn]-versus-time profile given in Fujioka et al’s supplementary Figure 3 [45] displays significantly slower decrease after the peak and resembles more closely our wild-type model results.
References
- 1.Widmann C, Gibson S, Jarpe MB, Johnson GL. Mitogen-activated protein kinase: conservation of a three-kinase module from yeast to human. Physiological Rev. 1999;79:143–179. doi: 10.1152/physrev.1999.79.1.143. [DOI] [PubMed] [Google Scholar]
- 2.Wiley HS, Shvartsman SY, Lauffenburger DA. Computational modeling of the EGF-receptor system: a paradigm for systems biology. Trends Cell Biol. 2003;13:43–50. doi: 10.1016/s0962-8924(02)00009-0. [DOI] [PubMed] [Google Scholar]
- 3.Orton RJ, Sturm OE, Vyshemirsky V, Calder M, Gilbert DR, Kolch W. Computational modeling of the receptor-tyrosine-kinase activated MAPK pathway. Biochem J. 2005;392:249–261. doi: 10.1042/BJ20050908. [DOI] [PMC free article] [PubMed] [Google Scholar]
- 4.McKay MM, Morrison DK. Integrating signals from RTKs to ERK/MAPK. Oncogene. 2007;26:3113–3121. doi: 10.1038/sj.onc.1210394. [DOI] [PubMed] [Google Scholar]
- 5.Raman M, Chen W, Cobb MH. Differential regulation and properties of MAPKs. Oncogene. 2007;26:3100–3112. doi: 10.1038/sj.onc.1210392. [DOI] [PubMed] [Google Scholar]
- 6.Zhang Y, Dong C. Regulatory mechanisms of mitogen-activated kinase signaling. Cell Mol Life Sci. 2007;64:2771–2789. doi: 10.1007/s00018-007-7012-3. [DOI] [PMC free article] [PubMed] [Google Scholar]
- 7.Chien KR, Hoshijima M. Unravelling Ras signals in cardiovascular disease. Nature Cell Biol. 2004;6:807–808. doi: 10.1038/ncb0904-807. [DOI] [PubMed] [Google Scholar]
- 8.Lawrence MC, Jivan A, Shao C, Duan L, Goad D, Zaganjor E, Osborne J, McGlynn K, Stippec S, Earnest S, Chen W, Cobb MH. The roles of MAPKs in disease. Cell Res. 2008;18:436–442. doi: 10.1038/cr.2008.37. [DOI] [PubMed] [Google Scholar]
- 9.Force T, Kuida K, Namchuk M, Parang K, Kyriakis JM. Inhibitors of protein kinase signaling pathways. Emerging therapies for cardiovascular disease. Circulation. 2004;109:1196–1205. doi: 10.1161/01.CIR.0000118538.21306.A9. [DOI] [PubMed] [Google Scholar]
- 10.Friday BB, Adjei AA. Advances in targeting the Ras/Raf/MEK/Erk mitogen-activated protein kinase cascade with MEK inhibitors for cancer therapy. Clin Cancer Res. 2008;14:342–346. doi: 10.1158/1078-0432.CCR-07-4790. [DOI] [PubMed] [Google Scholar]
- 11.Butch ER, Guan K-L. Characterization of ERK1 activation site mutants and the effect on recognition by MEK1 and MEK2. J Biol Chem. 1996;271:4230–4235. doi: 10.1074/jbc.271.8.4230. [DOI] [PubMed] [Google Scholar]
- 12.Fukuda M, Gotoh Y, Nishida E. Interaction of MAP kinase with MAP kinase kinase: its possible role in the control of nucleocytoplasmic transport of MAP kinase. The EMBO J. 1997;16:1901–1908. doi: 10.1093/emboj/16.8.1901. [DOI] [PMC free article] [PubMed] [Google Scholar]
- 13.Khokhlatchev AV, Canagarajah B, Wilsbacher J, Robinson M, Atkinson M, Goldsmith E, Cobb MH. Phosphorylation of the MAP kinase ERK2 promotes its homodimerization and nuclear translocation. Cell. 1998;93:605–615. doi: 10.1016/s0092-8674(00)81189-7. [DOI] [PubMed] [Google Scholar]
- 14.Lenormand P, Brondello J-M, Brunet A, Pouysségur J. Growth factor-induced p42/p44 MAPK nuclear translocation and retention requires both MAPK activation and neosynthesis of nuclear anchoring proteins. J Cell Biol. 1998;142:625–633. doi: 10.1083/jcb.142.3.625. [DOI] [PMC free article] [PubMed] [Google Scholar]
- 15.Adachi M, Fukuda M, Nishida E. Two co-existing mechanisms for nuclear import of MAP kinase: passive diffusion of a monomer and active transport of a dimer. The EMBO J. 1999;18:5347–5358. doi: 10.1093/emboj/18.19.5347. [DOI] [PMC free article] [PubMed] [Google Scholar]
- 16.Kholodenko BN, Demin OV, Moehren G, Hoek JB. Quantification of short term signaling by the epidermal growth factor receptor. J Biol Chem. 1999;274:30169–30181. doi: 10.1074/jbc.274.42.30169. [DOI] [PubMed] [Google Scholar]
- 17.Furuno T, Hirashima N, Onizawa S, Sagiya N, Nakanishi M. Nuclear shuttling of mitogen-activated protein (MAP) kinase (extracellular signal-related kinase (ERK) 2) was dynamically controlled by MAP/ERK kinase after antigen stimulation in RBL-2H3 cells. J Immun. 2001;166:4416–4421. doi: 10.4049/jimmunol.166.7.4416. [DOI] [PubMed] [Google Scholar]
- 18.Schoeberl B, Eichler-Jonsson C, Gilles ED, Müller G. Computational modeling of the dynamics of the MAP kinase cascade activated by surface and internalized EGF receptors. Nature Biotech. 2002;20:370–375. doi: 10.1038/nbt0402-370. [DOI] [PubMed] [Google Scholar]
- 19.Hatakeyama M, Kimura S, Naka T, Kawasaki T, Yumoto N, Ichikawa M, Kim JH, Saito K, Saeki M, Shirozu M, Yokoyama S, Konagaya A. A computational model on the modulation of mitogen-activated protein kinase (MAPK) and Akt pathways in heregulin-induced ErbB signalling. Biochem J. 2003;373:451–463. doi: 10.1042/BJ20021824. [DOI] [PMC free article] [PubMed] [Google Scholar]
- 20.Horgan AM, Stork JS. Examining the mechanism of ERK nuclear translocation using green fluorescent protein. Expt Cell Research. 2003;285:208–220. doi: 10.1016/s0014-4827(03)00037-5. [DOI] [PubMed] [Google Scholar]
- 21.Burack WR, Shaw AS. Live cell imaging of ERK and MEK. Simple binding equilibrium explains the regulated nucleocytoplasmic distribution of ERK. J Biol Chem. 2005;280:3832–3837. doi: 10.1074/jbc.M410031200. [DOI] [PubMed] [Google Scholar]
- 22.Hornberg J, Bernd B, Bruggeman FJ, Schoeberl B, Heinrich R, Westerhoff HV. Control of MAPK signaling: from complexity to what really matters. Oncogene. 2005;20:5533–5542. doi: 10.1038/sj.onc.1208817. [DOI] [PubMed] [Google Scholar]
- 23.Sasagawa S, Ozaki Y-I, Fujita K, Kuroda S. Prediction and validation of the distinct dynamics of transient and sustained ERK activation. Nature Cell Biol. 2005;7:365–373. doi: 10.1038/ncb1233. [DOI] [PubMed] [Google Scholar]
- 24.Costa M, Marchi M, Cardarelli F, Roy A, Beltram F, Maffei L, Ratto GM. Dynamic regulation of ERK2 nuclear translocation and mobility in living cells. J Cell Sci. 2006;119:4952–4963. doi: 10.1242/jcs.03272. [DOI] [PubMed] [Google Scholar]
- 25.Fujioka A, Terai K, Itoh RE, Aoki J, Nakamura T, Kuroda S, Nishida E, Matsuda M. Dynamics of the Ras/ERK MAPK cascade as monitored by fluorescent probes. J Biol Chem. 2006;281:8917–8926 . doi: 10.1074/jbc.M509344200. http://www.jbc.org/cgi/content/full/281/13/8917. [DOI] [PubMed]
- 26.Yazicioglu MN, Goad DL, Ranganathan A, Whitehurst AW, Goldsmith EJ, Cobb MH. Mutations in ERK2 binding sites affect nuclear entry. J Biol Chem. 2007;282:28759–28767. doi: 10.1074/jbc.M703460200. [DOI] [PubMed] [Google Scholar]
- 27.Philipova R, Whitaker M. Active ERK1 is dimerized in vivo: bisphosphodimers generate peak kinase activity and monophosphodimers maintain basal ERK1 activitiy. J Cell Sci. 2005;118:5767–5776. doi: 10.1242/jcs.02683. [DOI] [PMC free article] [PubMed] [Google Scholar]
- 28.Hindmarsh AC. LSODE and LSODI, two new initial value ordinary differential equation solvers. ACM SIGNUM Newsletter. 1980;15:10–11. [Google Scholar]
- 29.Radhakrishnan K, Hindmarsh AC. NASA Reference Publication. Vol. 1327. National Aeronautics & Space Administration, NTIS; Washington, DC: 1993. Description and use of LSODE, the Livermore solver for ordinary differential equations. http://gltrs.grc.nasa.gov/reports/1993/RP-1327.pdf. [Google Scholar]
- 30.Radhakrishnan K, LaManna JC, Cabrera ME. A quantitative study of oxygen as a metabolic regulator. Applied Cardiopulmonary Pathophysiology. 2000;9:363–367. [Google Scholar]
- 31.Puchowicz MA, Radhakrishnan K, Xu K, Magness DL, LaManna JC. Computational study on use of single-point analysis method for quantitating local cerebral blood flow in mice. Adv Exp Med Biol. 2005;566:99–104. doi: 10.1007/0-387-26206-7_14. [DOI] [PubMed] [Google Scholar]
- 32.Liu G, Swihart MT, Neelameghan S. Sensitivity, principal component and flux analysis applied to signal transduction: the case of epidermal growth factor mediated signaling. Bioinformatics. 2005;21:1194–1202. doi: 10.1093/bioinformatics/bti118. [DOI] [PubMed] [Google Scholar]
- 33.Frank PM. Introduction to system sensitivity theory. Academic Press; New York, NY: 1978. [Google Scholar]
- 34.Dunker AM. The decoupled direct method for calculating sensitivity coefficients in chemical kinetics. J Chem Phys. 1984;81:2385–2393. [Google Scholar]
- 35.Radhakrishnan K. Decoupled direct method for sensitivity analysis in combustion kinetics. In: Vichnevetsky R, Stepleman RS, editors. Advances in Computer Methods for Partial Differential Equations – VI. IMACS; New Brunswick, NJ: 1987. pp. 479–486. Also, NASA Contractor Report 179636, National Aeronautics & Space Administration, 1987, Washington, DC http://ntrs.nasa.gov/archive/nasa/casi.ntrs.nasa.gov/19870015116_1987015116.pdf. [Google Scholar]
- 36.Radhakrishnan K. Combustion kinetics and sensitivity analysis computations. In: Oran ES, Boris JP, editors. Numerical approaches to combustion modeling. AIAA; Washington, DC: 1991. pp. 83–128. [Google Scholar]
- 37.Radhakrishnan K. NASA Reference Publication. Vol. 1328. National Aeronautics & Space Administration, NTIS; Washington, DC: 1994. LSENS–A general chemical kinetics and sensitivity analysis code for homogeneous gas-phase reactions. I. Theory and numerical solution procedures. http://gltrs.grc.nasa.gov/reports/1994/RP-1328.pdf http://www.openchannelfoundation.org/projects/LSENS/ http://www.techbriefs.com/component/content/article/443. [Google Scholar]
- 38.Robinson MJ, Cheng M, Khokhlatchev A, Ebert D, Ahn N, Guan K-L, Stein B, Goldsmith E, Cobb MH. Contributions of the mitogen-activated protein (MAP) kinase backbone and phosphorylation loop to MEK specificity. J Biol Chem. 1996;271:29734–29739. doi: 10.1074/jbc.271.47.29734. [DOI] [PubMed] [Google Scholar]
- 39.Radhakrishnan K. NASA Technical Paper. Vol. 2372. National Aeronautics & Space Administration; Washington, DC: 1984. Comparison of numerical techniques for integration of stiff ordinary differential equations arising in combustion. http://gltrs.grc.nasa.gov/reports/1984/TP-2372.pdf. [Google Scholar]
- 40.Radhakrishnan K. New integration techniques for chemical kinetic rate equations. I. Efficiency comparison. Combust Sci & Tech. 1986;46:59–82. [Google Scholar]
- 41.Radhakrishnan K. New integration techniques for chemical kinetic rate equations. II. Accuracy comparison. J Eng for Gas Turbines and Power. 1986;108:348–353. [Google Scholar]
- 42.Radhakrishnan K. NASA Technical Paper. Vol. 3315. National Aeronautics & Space Administration; Washington, DC: 1993. A critical analysis of the accuracy of several numerical techniques for combustion kinetic rate equations. http://gltrs.grc.nasa.gov/reports/1993/TP-3315.pdf. [Google Scholar]
- 43.Radhakrishnan K. LSENS: multipurpose kinetics and sensitivity analysis code. AIAA J. 2003;41:848–855. [Google Scholar]
- 44.Radhakrishnan K, Bittker DA. NASA Reference Publication. Vol. 1329. National Aeronautics & Space Administration, NTIS; Washington, DC: 1994. LSENS–A general chemical kinetics and sensitivity analysis code for homogeneous gas-phase reactions. II. Code description and usage. http://gltrs.grc.nasa.gov/reports/1994/RP-1329/RP-1329.pdf. [Google Scholar]
- 45.http://www.jbc.org/cgi/content/full/M509344200/DC1
- 46.Wolf I, Rubinfeld H, Yoon S, Marmor G, Hanoch T, Seger R. Involvement of the activation loop of ERK in the detachment from cytosolic anchoring. J Biol Chem. 2001:24490–24497. doi: 10.1074/jbc.M103352200. [DOI] [PubMed] [Google Scholar]