

Abstract
Asparaginase is an important component of treatment for childhood acute lymphoblastic leukemia (ALL). The basis for interindividual differences in asparaginase sensitivity remains unclear. To comprehensively identify genetic variants important in the cytotoxicity of asparaginase, we employed a genome-wide association approach using the HapMap lymphoblastoid cell lines (87 CEU trio members) and 54 primary ALL leukemic blast samples at diagnosis. Asparaginase sensitivity was assessed as the drug concentration necessary to inhibit 50% of growth (IC50). In CEU lines, we tested 2,390,203 SNP genotypes at the individual SNP (p < 0.001) and the gene level (p < 0.05) and identified 329 SNPs representing 94 genes that were associated with asparaginase IC50. The aspartate metabolism pathway was the most over-represented among 199 pathways evaluated (p = 8.1 × 10⁻³), with primary involvement of ADSL and DARS genes. We validated that SNPs in the aspartate metabolism pathway were also associated with asparaginase sensitivity in primary ALL leukemic blast samples (p = 5.5 × 10⁻⁵). Our genome-wide interrogation of CEU cell lines and primary ALL blasts revealed that inherited genomic interindividual variation in a plausible candidate pathway can contribute to asparaginase sensitivity.
Keywords: asparaginase, leukemia, drug sensitivity, pharmacogenomics, genome-wide
Introduction
Asparaginase is an effective agent in treating childhood acute lymphoblastic leukemia (ALL). There is substantial interpatient variability in the inherent sensitivity of ALL to asparaginase.1–4 Both the ex vivo sensitivity of primary ALL blasts to asparaginase and the early in vivo response to a single dose of asparaginase have been linked to prognosis in childhood ALL.5–9
Asparaginase exerts its antileukemic activity by converting asparagine to aspartic acid in extracellular fluid.10 Most normal cells can synthesize asparagine, but leukemic lymphoblasts are sensitive to the depletion of extracellular asparagine, putatively because they express low levels of asparagine synthetase (ASNS)11–13 or they lack the ability to up regulate the expression of ASNS when exposed to asparaginase.14, 15 The relative inability of leukemic lymphoblasts to produce their own asparagine to compensate for the shortage of extracellular asparagine reduces asparagine-dependent protein synthesis, resulting in leukemic cell death.16 However, some recent studies have reported conflicting data on the relationship between the levels of ASNS and the resistance to asparaginase.17–24 Resistance to asparaginase can also be caused by the development of antibodies against asparaginase,25 altered expression of genes involved in apoptosis26 and protein synthesis,24 and secretion of asparagine by bone marrow mesenchymal cells.19 However, the basis for interindividual differences in asparaginase sensitivity remains unclear, and a genome-wide approach has not yet been used to interrogate the effect of inherited genomic variation on asparaginase sensitivity.
In this study, we used a genome-wide approach to investigate genomic determinants of asparaginase sensitivity in lymphoblastoid HapMap cell lines and in leukemic cells from patients with ALL.
Materials and Methods
Cell lines
Epstein-Barr virus–transformed B lymphoblastoid cell lines derived from 30 Center d’Etude du Polymorphism Humain family trios (CEU) and from 30 trios collected from Yoruba in Ibadan, Nigeria (YRI) were obtained from the Coriell Institute of Medicine, Camden, NJ (http://www.ccr.coriell.org). Cell lines were maintained in log phase in RPMI-1640 media (BioWhittaker, Walkersfield, MD) with 15% fetal bovine serum (Hyclone, Logan, UT) and 20 mM L-glutamine (Invitrogen, Carlsbad, CA) and maintained in culture in a humidified 5% CO2 incubator at 37°C.
Samples from patients with ALL
Primary bone marrow samples were obtained from 54 children with newly diagnosed ALL who were treated on protocol Total XV27, after obtaining informed consent from them or their parents/guardians, with assent from the patients, as appropriate. All patients were treated at St. Jude Children's Research Hospital. This study and use of these samples was approved by the institutional review board at St. Jude.
Genotypes and gene expression
Single nucleotide polymorphism (SNP) genotypes for CEU and YRI cell lines were downloaded from release22 on the International HapMap project Web Site (http://www.HapMap.org). Gene expression data using the Affymetrix GeneChip® Human Exon 1.0 ST Array was downloaded from the website (http://www.ncbi.nlm.nih.gov/geo/query/acc.cgi?acc=GSE7761). High-quality germline DNA was extracted by using a blood and cell culture DNA kit (Qiagen, Valencia, CA) from normal blood leukocytes from patients after they achieved complete remission. Patient samples were genotyped using the Affymetrix GeneChip® Human Mapping 500K set (Affymetrix, Santa Clara, CA), as described previously.28 SNPs with minor allele frequencies less than 1% were excluded from all analyses.
To verify genotypes of interest, we genotyped 5 ASDL and DARS SNPs in 19 CEU cell lines that cover all three variant genotypes, using ABI SNPlex technology. We observed 99% concordance between genotype data downloaded from HapMap and the experimentally determined genotypes. In addition, we have genotyped 168 SNPs using the Sequenom iPLEX technology (as implemented by Dr. Soma Das, University of Chicago Department of Human Genetics) in over 400 patients with ALL that had been typed using the Affymetrix GeneChip® Human Mapping 500K set arrays; we observed an average genotyping concordance of greater than 99% between the two genotyping methods. This indicates that the genotype data obtained from the Affymetrix SNP arrays were of high accuracy.
In vitro Sensitivity (MTT) Assay
In vitro drug sensitivity was determined using the 3-[4,5-dimethylthiazol-2-yl]-2,5-diphenyl-tetrazoliumbromide (MTT) assay described previously with slight modifications.24, 29, 30 For CEU cell lines, cells were plated at a density of 2.5 × 10⁵ cells/ml on day 0 and incubated for 24 hours. Cells were then exposed to asparaginase (Elspar, Merck & Co, Inc.) (treated) at 6 different concentrations (0.003, 0.024, 0.195, 1.56, 12.5, and 100 IU/ml) or culture media (untreated) in 96-well plate format. After a 48-h incubation, 5 mg/ml of MTT (Sigma, St. Louis, MO) was added, and cells were incubated for an additional 4 hours at 37°C. Acidified (0.04 N HCl) isopropanol was added to dissolve formazan crystals produced by viable cells and the resultant solution was subjected to absorbance measurement at 570 nm (and 720 nm for subtracting background signals). Viability at each tested concentration was computed as a percentage of the viability measured in paired untreated cells, thereby accounting for inherent differences in viability among cell lines and primary cells. The IC50 value (drug concentration lethal for 50% of treated cells) was estimated from nonlinear curve fitting by the ADAPT5 Beta program for concentration vs. viability (Supplemental Figure S1).31 The MTT assay was performed at least twice at different passages and final IC50 values represented the median of 2–8 separate experiments per cell line. For ALL patient samples, cells were plated at 2 × 10⁶ cells/ml on day 0 and exposed to 6 serial dilutions of asparaginase (0.003, 0.016, 0.08, 0.4, 2, and 10 IU/ml) on the same day. After a 96-h incubation, MTT was added and cell viability was measured 6 hrs later using the procedure described above. It has previously been demonstrated that 96 hours of drug incubation is necessary to achieve cytotoxic effect in primary ALL cells, and a plateau is reached for the optical density (OD) measurement after 4–8 hours of MTT incubation with primary ALL cells.32 A cytospin slide for untreated cells was prepared on day 0 and day 4. The percentage of leukemic blasts in each sample was determined by Geimsa stain. Those with 90% or more leukemic cells on day 0, with 70% or more leukemic cells in the untreated wells after 4 days of culture, and with an OD greater than 0.05 arbitrary units were considered suitable for evaluation. For samples in which 50% cytotoxicity was not achieved even at the highest tested concentration (i.e., complete resistance), the IC50 value was assigned as twice the highest concentration tested.33 For cells with viabilities less than 50% at all tested concentrations (i.e., high sensitivity), the IC50 value was assigned as half of the lowest concentration tested.
Data analysis in CEU cell lines
Association analysis for genotypes at the single SNP level
For the association analysis at the single SNP level, we ranked all the cell lines by IC50 values because IC50 was not normally distributed and outliers were present. Linear mixed-effect models were used to test the association between IC50 rank and each single SNP genotype, one SNP at a time. AA, AB, and BB genotypes were coded as 0, as 1, and 2, respectively
Association analysis for genotypes at the gene level
Most genes are represented by many SNPs. To complement the single SNP analysis, we assessed the contribution of germline variation on a per-gene basis by performing a gene level analysis. SNPs were annotated to genes if they were within 5 kb of the transcription start site and transcription 3’ end. We built multiple linear regression models using SNPs within each gene and computed the R2 test statistic for each gene. The R2 represented the percentage of variation in IC50 ranks explained by the genotype of SNPs in the given gene. We then performed 5000 permutations to generate the P-value comparing the permuted R2 and the observed R2. The proportion of permutations with R2 values higher than or equal to the observed value was assigned as the significance of the gene.
Pathway analysis
We ranked genes on the basis of their SNPs’ associations with asparaginase IC50. We then queried the KEGG database to determine which pathways comprised genes that were over-represented with respect to their association with asparaginase sensitivity Specifically, for each of the 199 KEGG pathways with genes containing interrogated SNPs, we calculated the proportion of genes in that pathway with SNPs associated with asparaginase IC50 and compared it with the proportion of genes with SNPs associated with IC50 among all interrogated genes that were not in that pathway; we tested for differences in the proportions using Fisher’s exact test.
Multivariate model to assess association of asparaginase IC50 with variation in genes in highest ranked pathway
After identifying the pathway for which genomic variation relating to asparaginase sensitivity was most overrepresented, we applied a random forest model by using all typed SNPs in the given pathway to compute a predicted IC50 value for each CEU cell line.34 Pathway analyses are subject to the criticism that there is inherent bias in estimating regression error; Random forests is an ensemble tree-based regression algorithm for performing regressions in pathway-based analysis that allows for an unbiased estimate of the regression error (details in Supplement). Pearson’s correlation was used to estimate the correlation between the predicted IC50 and observed IC50 values.
Association analyses of asparaginase IC50 with other phenotypes
The association between IC50 and gene expression in CEU lines was evaluated based on a linear mixed effect model by adjusting for relatedness within the trios. The structure of relatedness within a trio was modeled using a Toeplitz structure with two diagonal bands.35 We determined the extent of correlation between asparaginase IC50s that we determined experimentally to the IC50s to daunorubicin, cisplatin, and etoposide that we downloaded from the PharmGKB website (http://www.pharmgkb.org/) using Spearman correlation analysis We compared the intra-trio (child to parents) variability in asparaginase IC50 with that expected in unrelated trios (see Supplement for details).
Results
Genome-wide association analyses for CEU cell lines
Of 88 cell lines tested, one displayed erratic growth characteristics and we were unable to accurately estimate IC50. For the remaining 87 CEU cell lines with available IC50 values, the median IC50 value was 0.39 IU/ml (range 0.16–4.52 IU/ml) (Figure 1). There was a 28-fold interindividual variation in the IC50. Of the 2,390,203 SNP genotypes tested for their association with asparaginase IC50 in 87 CEU cell lines, the top ranked SNP was rs12609807 (p = 4.9 × 10⁻⁶). There were 84,859 SNP genotypes associated with asparaginase IC50 at the p < 0.05 level (Supplemental Figure S2). At the gene level, SNPs representing 939 genes were identified at p < 0.05. The overlap of all the evaluable SNP genotypes (at a p-value threshold of p < 1.0 × 10⁻³) and genes (at p < 0.05) yielded 329 SNPs representing 94 genes (Figure 2A).
Figure 1.
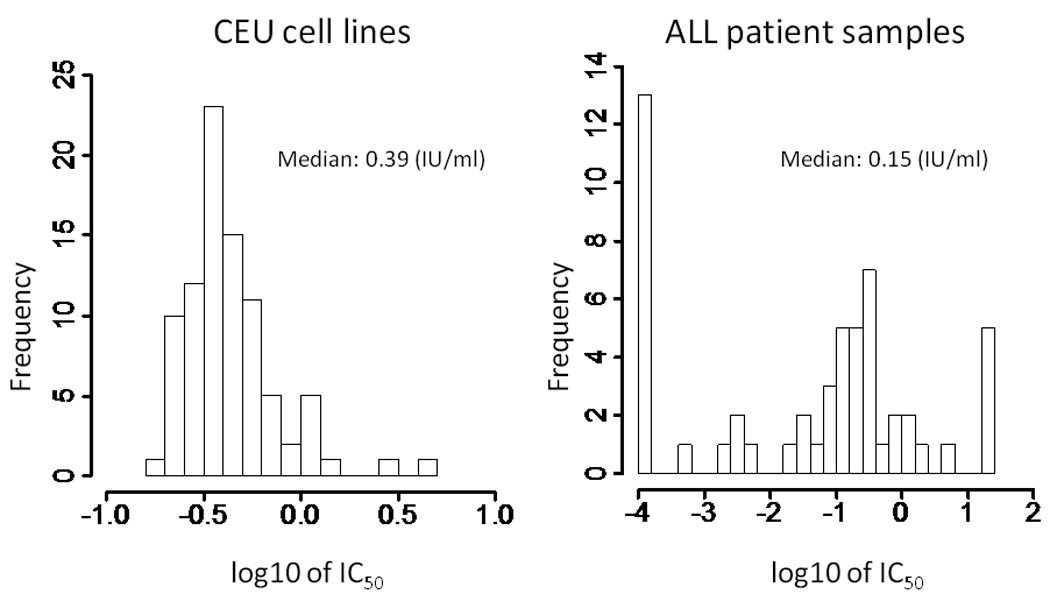
Histograms of IC50 values in CEU cell lines (n = 87) and ALL patient samples (n = 54). IC50 data were not normally distributed and outliers were present. IC50 values ranged widely in ALL patient samples. ALL patient samples were significantly more sensitive than CEU cell lines to asparaginase. The p-value (Wilcoxon test) was 2.87 × 10⁻⁷.
Figure 2.
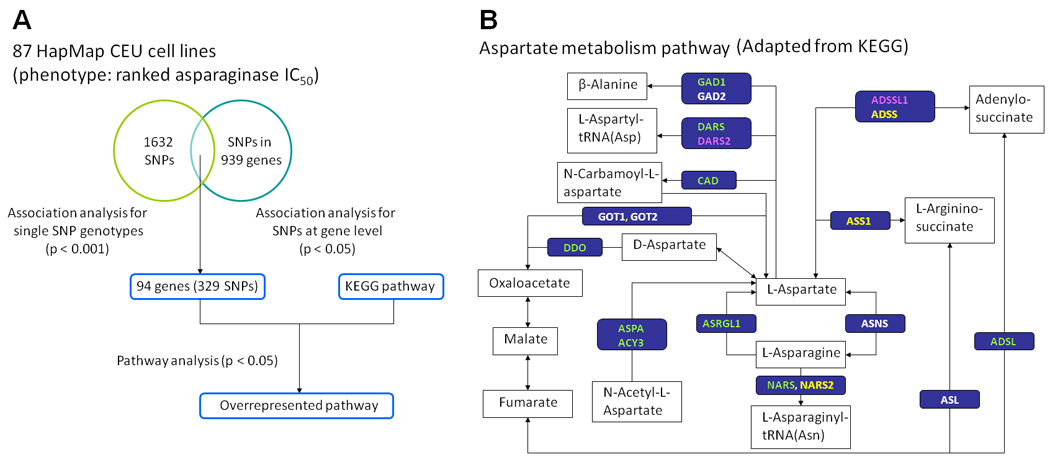
A. Flow chart describing the approach of genome-wide analysis used in CEU cell lines. The overlap between SNP genotypes association analysis at the single SNP level (p < 1.0 × 10⁻³) and at the gene level (p < 0.05) yielded 329 SNPs representing 94 genes. The KEGG pathway was queried by the 94 genes to identify overrepresented pathways (Supplemental Table S1). B. The most overrepresented pathway based on the genome-wide analysis of CEU lines was the aspartate metabolism pathway (retrieval from KEGG hsa00252). Genes in green, pink, and yellow indicate those hosting SNPs at the p < 0.05 level in CEU lines, ALL patient samples, and both groups, respectively.
Pathway analysis in CEU cell lines
We conducted a pathway analysis of these top ranked 94 genes by querying the KEGG database (Figure 2A). These 94 genes could be annotated to 27 pathways (Supplemental Table S1). The top-ranked KEGG pathway that was overrepresented by the 94 genes (p = 0.009) was the alanine/aspartate metabolism pathway. There were 2 highly ranked genes in this pathway: adenylosuccinate lyase (ADSL) and aspartyl-tRNA synthetase (DARS). The genotypes of 2 SNPs (rs8135371 and rs17001863) annotated to ADSL and 5 SNPs (rs3768998, rs2278683, rs11893318, rs2322725, and rs7587285) annotated to DARS were significantly associated with asparaginase IC50 at the p < 0.001 level (Table 1). Interestingly, these 2 genes, ADSL and DARS, were directly involved in aspartate metabolism rather than alanine metabolism (Figure 2B).
Table 1.
SNPs in ADSL and DARS, annotated to the alanine and aspartate metabolism pathway, that were associated with asparaginase IC50 in CEU cell lines
| Gene symbol |
SNP ID | Chr |
p-value1 (CEU) (SNP level) |
p-value 2 (CEU) (gene level) |
p-value3 (CEU) (gene expression) |
p-value4 (primary ALL) (SNP level) |
Direction of risk alleles in CEU and primary ALL |
Allele (A/B) |
|---|---|---|---|---|---|---|---|---|
| ADSL | rs8135371 | 22 | 6.93×10⁻⁴ | 3.00×10⁻³ | 7.40×10⁻⁴ | 0.46 | Consistent | A/C* |
| ADSL | rs17001863 | 22 | 9.05×10⁻⁴ | 3.00×10⁻³ | 1.86×10⁻³ | 0.46 | Consistent | A/G* |
| DARS | rs3768998 | 2 | 5.82×10⁻⁴ | 5.80×10⁻³ | 0.67 | 0.59 | Consistent | G*/T |
| DARS | rs7587285 | 2 | 9.08×10⁻⁴ | 5.80×10⁻³ | 0.92 | 0.19 | Consistent | T*/C |
| DARS | rs11893318 | 2 | 9.08×10⁻⁴ | 5.80×10⁻³ | 0.92 | 0.19 | Consistent | T*/C |
| DARS | rs2278683 | 2 | 9.08×10⁻⁴ | 5.80×10⁻³ | 0.92 | 0.19 | Consistent | A*/C |
| DARS | rs2322725 | 2 | 9.08×10⁻⁴ | 5.80×10⁻³ | 0.92 | 0.19 | Consistent | T*/C |
Chr, chromosome; A/B, major/minor allele;
allele with higher IC50
p value relating SNP genotype to IC50
p value relating SNP genotypes on a per-gene basis to IC50
p value relating SNP genotypes to gene expression
p value relating SNP genotype to IC50 in primary ALL cells
Multivariate model to predict asparaginase IC50 in CEU cell lines based on genotypes in highest ranked pathway
Among genes identified in the alanine/aspartate metabolism pathway, 19 genes were directly involved in aspartate metabolism, and we therefore focused on SNPs annotated to these 19 genes (Figure 2B); the remainder were involved in alanine metabolism. To examine the overall contributions of SNPs in the aspartate metabolism pathway to asparaginase IC50, we applied a random forests model to compute a predicted IC50 value for each CEU cell line (Figure 3). The genotypes of 1600 SNPs represented in the aspartate metabolism pathway were available in HapMap phase 2 data for the CEU lines. After applying quality-control filters, 935 SNPs were evaluated in the Random forests model. Of genotypes at these 935 SNPs, the predicted IC50 values significantly correlated with the observed IC50 values (p = 1.1 × 10⁻³), with 73 SNPs associated with asparaginase IC50 at p < 0.05 (Supplemental Table S2, Figure 4). Interestingly, none of the SNPs annotated to ASNS showed a strong association with asparaginase IC50. For comparison, we created 500 randomly composed gene sets, with 19 genes in each set, and applied the Random Forest model for each gene set. None of the 500 gene sets had a p-value less than 1.1 × 10⁻³, the p-value observed for the SNPs constituting the aspartate metabolism pathway (Supplemental Table S3). This demonstrated that the association between SNPs in the aspartate metabolism pathway and asparaginase IC50 was unlikely to have been observed by chance, because no other similarly constructed random forests gave as good a prediction.
Figure 3.
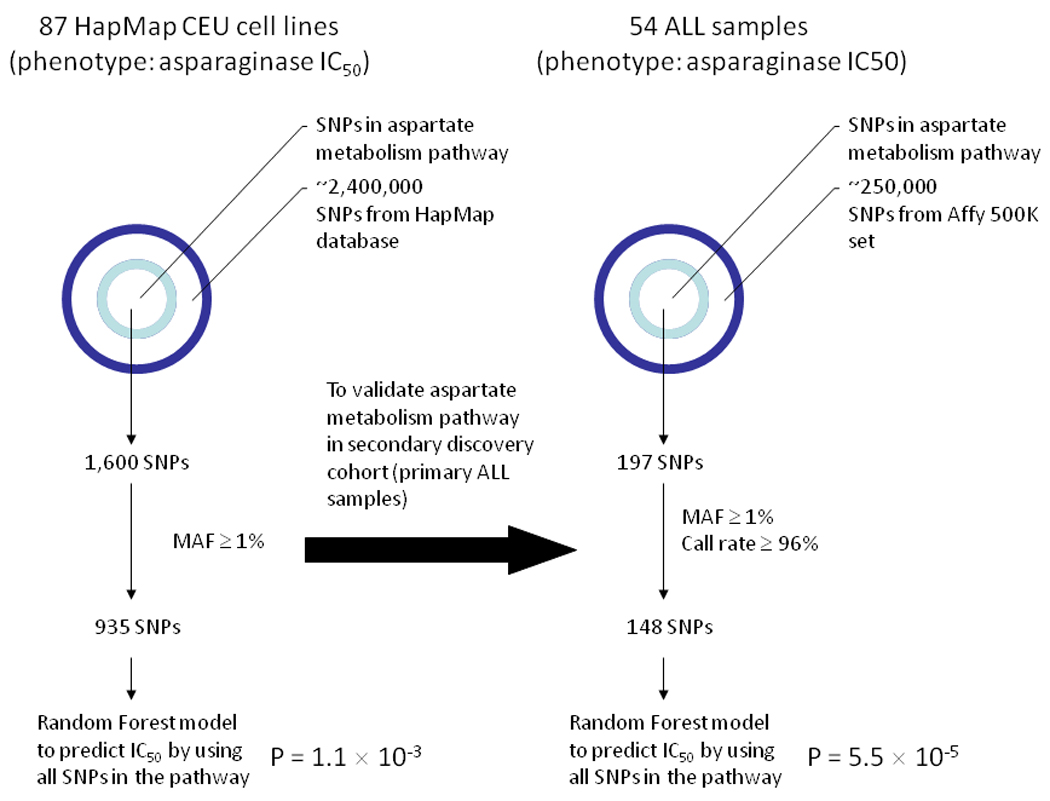
Approach using the Random Forest model analysis in CEU cell lines and in ALL patient samples. SNPs representing the aspartate metabolism pathway from the Exon array or Affymetrix array were selected. After applying filter criteria, the random forest model was applied on the remaining SNPs to predict asparaginase IC50 in each sample.
Figure 4.
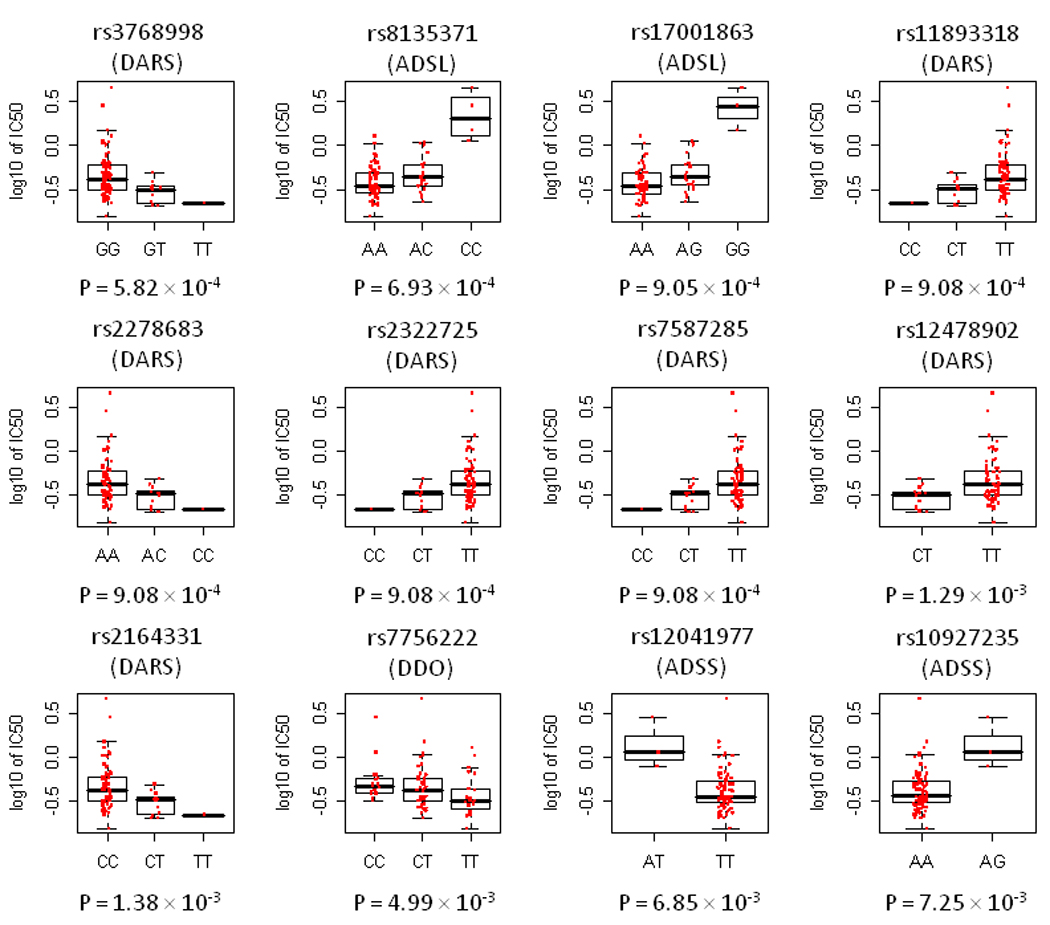
The distribution of asparaginase IC50 vs. genotype for the top 12 SNPs annotated to genes in the aspartate metabolism pathway in CEU cell lines. Boxes include data between the 25th and 75th percentiles, and whiskers indicate the minimal and maximal values excluding outliers.
Of the top 7 SNPs in the top ranked pathway of aspartate metabolism in CEU cell lines, one (rs3768998 in DARS, p = 5.82 × 10⁻⁴ in CEU) was also associated with asparaginase IC50 in YRI cell lines (p = 0.04 in YRI) (Supplemental Table S5). The G allele at this genotype was associated with higher IC50 in both CEU and YRI cell lines.
Relationship between sensitivity to asparaginase and to other drugs in CEU cell lines
The Spearman's rho estimates for the association between asparaginase IC50 and that of other antileukemic drugs were 0.21 (p =0.052) for daunorubicin, 0.41 (p =.00017 for cisplatin, and 0.32 (p=.0036) for etoposide. A small percentage of SNPs associated with IC50 to asparaginase were overlapping with sensitivity to the other three drugs (Supplemental Table S4), and no SNPs were significantly associated with sensitivity to all four drugs at p < 0.001 level.
The association between the top 7 SNPs and gene expression
We tested the association between the genotypes for the top 7 SNPs in the aspartate metabolism pathway and gene expression levels in CEU cell lines (Table 1). The genotypes of rs8135371 and rs17001863 in ADSL significantly correlated with ADSL gene expression. The number of copies of the C allele for rs8135371 and the G allele of rs17001863 were associated with increased expression of ADSL and also with higher IC50 (Supplemental Figure S3). In a concordant fashion, cells with higher ADSL expression tended to have higher IC50 (Supplemental Figure S3).
Testing the aspartate metabolism pathway in clinical ALL blast samples
The median IC50 in 54 primary leukemic samples was 0.15 IU/ml (range 1.0 × 10⁻⁴ – 20.0 IU/ml) (Figure 1). We did not observe significant differences (p = 0.58, Kruskal Wallis test) in IC50 values by ALL subtype (Supplemental Figure S4), although the number of samples in each subgroup was small (Supplemental Table S6). Compared to CEU cell lines, primary ALL blast samples were significantly more sensitive to asparaginase (Wilcox test: p = 2.87 × 10⁻⁷), although there were 5 individual patient samples that demonstrated resistance (IC50 > 20 IU/ml) (Figure 1).
We did not find that the germline SNPs that were most associated with IC50 in CEU cell lines were associated with IC50 in primary leukemic samples (Table 1). To assess whether the same pathway important for asparaginase sensitivity in CEU cell lines is also important in primary patient samples, we applied the Random forests model to the 148 evaluable SNPs representing the 19 genes involved in aspartate metabolism that were evaluable and interrogated on the Affy 500K SNP chip (Figure 3). The predicted IC50 values were significantly correlated with the observed IC50 values (p = 5.5 × 10⁻⁵) in this set of 54 primary patient samples, indicating that the variation in the aspartate metabolic pathway was also important for primary ALL. Of the 148 SNPs in the aspartate pathway, 11 were associated with IC50 at the p < 0.05 level (Table 2, Figure 5). Although none of these 11 SNPs were the exact SNPs that were significantly associated with asparaginase IC50 in CEU cell lines, 2 genes in this pathway– argininosuccinate synthetase 1 (ASS1) and asparaginyl-tRNA synthetase 2 (NARS2) – had polymorphisms that associated with asparaginase sensitivity in both ALL patient samples and CEU cell lines (Supplemental Table S2). The highest-ranked SNP (rs3102475) in patient samples was in the adenylosuccinate synthetase (ADSS) gene.
Table 2.
The 11 SNPs from aspartate metabolism pathways significantly associated with asparaginase IC50 in primary patient ALL samples
| SNP# | Chr | SNP ID | Gene |
p-value1 (ALL) |
p-value2 (CEU) |
Direction of risk allele in ALL and CEU |
Allele (A/B) |
|---|---|---|---|---|---|---|---|
| SNP_A.2274111 | 1 | rs3102475 | ADSS | 4.46×10⁻³ | 0.47 | Different | C*/T |
| SNP_A.2080927 | 9 | rs553696 | ASS1 | 6.48×10⁻³ | 0.89 | Consistent | A/G* |
| SNP_A.4198760 | 1 | rs2068871 | DARS2 | 6.55×10⁻³ | 0.85 | Consistent | A/G* |
| SNP_A.1790218 | 9 | rs544701 | ASS1 | 2.45×10⁻² | 0.75 | Different | A/G* |
| SNP_A.1790970 | 9 | rs4740158 | ASS1 | 3.88×10⁻² | 0.41 | Different | C/T* |
| SNP_A.2232252 | 14 | rs2494731 | ADSSL1 | 3.94×10⁻² | 0.42 | Different | G*/C |
| SNP_A.4289619 | 11 | rs11237537 | NARS2 | 4.25×10⁻² | 0.85 | Different | G/A* |
| SNP_A.2092517 | 1 | rs2759328 | DARS2 | 4.92×10⁻² | 0.85 | Consistent | C/T* |
| SNP_A.2030296 | 1 | rs941988 | DARS2 | 4.92×10⁻² | 0.87 | Consistent | C/T* |
| SNP_A.2098491 | 1 | rs2227589 | DARS2 | 4.92×10⁻² | 0.85 | Consistent | C/T* |
| SNP_A.2179898 | 1 | rs16846526 | DARS2 | 4.92×10⁻² | 0.85 | Consistent | A*/G |
Chr, chromosome; A/B, major/minor allele;
Affymetrix SNP marker ID;
allele with higher IC50
p value relating SNP genotype to IC50 in primary ALL samples
p value relating SNP genotypes to IC50 in CEU cell lines
Figure 5.
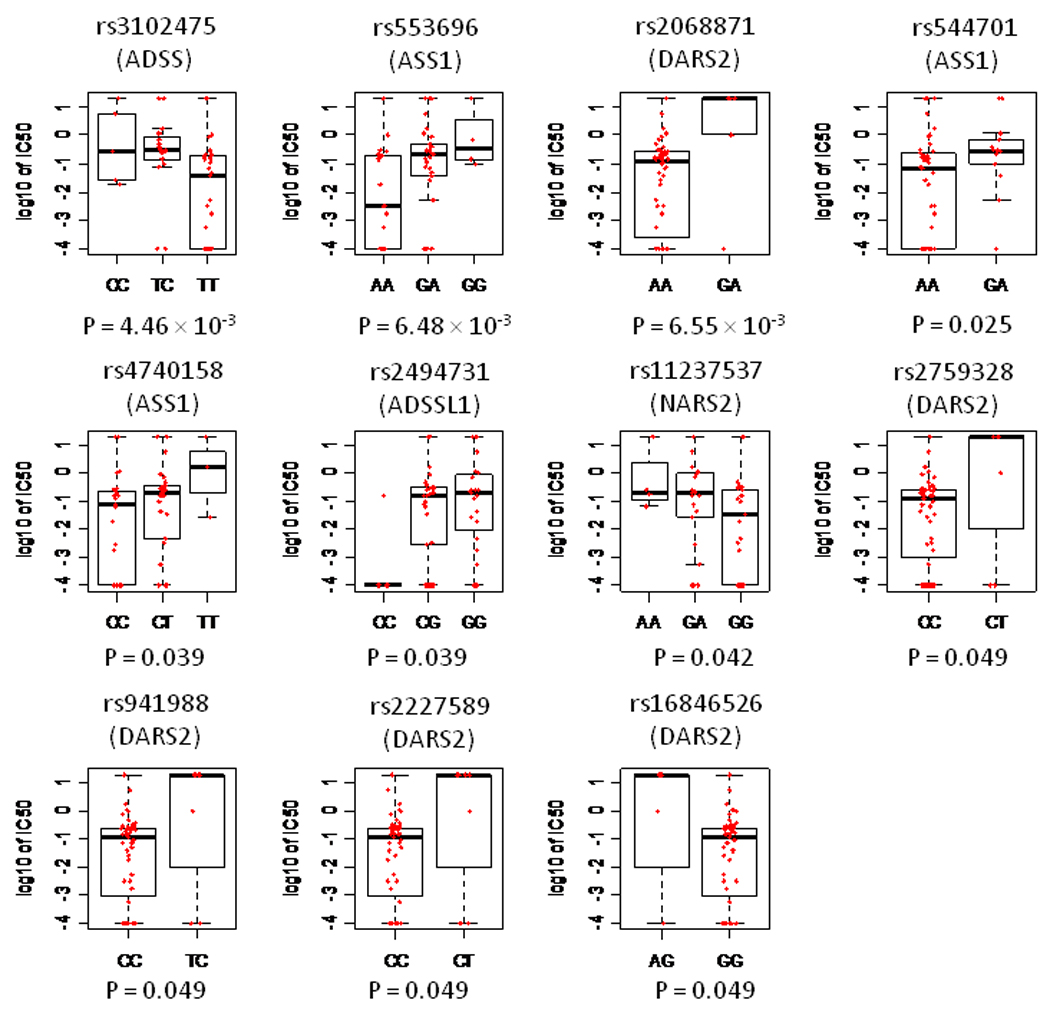
The distribution of asparaginase IC50 vs. genotypes for 11 SNPs annotated to genes in aspartate metabolism pathway at the p < 0.05 level in ALL patient samples. Boxes include data between the 25th and 75th percentiles, and whiskers indicate the minimal and maximal values excluding outliers.
Discussion
We used an agnostic genome-wide approach to identify inherited genomic variants that may contribute to interindividual variation in asparaginase sensitivity. Of all annotated biological pathways, the aspartate metabolism pathway was the most over-represented among the 94 genes hosting the SNPs associated with asparaginase sensitivity. Remarkably, aspartate homeostasis lies at the heart of the putative mechanism of action of asparaginase.
Our genome-wide approach has identified genotypes of SNPs in the aspartate metabolism pathway which contribute significantly to asparaginase sensitivity, including polymorphisms in ADSL, DARS, ASS1, DARS2, NARS2, and ADSSL1. Two of these genes, ASS1 and NARS2, harbored additional SNPs that were associated with asparaginase sensitivity in primary ALL samples, and several of these gene products have been reported by others to be directly related to asparaginase resistance in leukemic cells.17 The urea cycle enzyme argininosuccinate synthetase (ASS1) is involved in the synthesis of arginine,36 and increased arginine synthesis may help promote the propagation of leukemic cells.37 Up regulation of ASS1 conferred resistance in leukemic cells, whereas suppression of ASS1 by RNA interference restored asparaginase sensitivity.17
ALL cells have a relatively high rate of de novo purine synthesis,38, 39 and several enzymes involved in the purine metabolism pathway are important targets for antimetabolites (e.g., mercaptopurine and methotrexate) that are the cornerstone of continuation therapy for childhood ALL.40 The biosynthesis of adenosine monophosphate from inosine monophosphate involves 2 steps, the first step being catalyzed by adenylosuccinate synthetase (ADSS) and the second by ADSL. In a recent genome-wide analysis of genes whose expression differed at relapse compared to at diagnosis of ALL, ADSL was over expressed in samples obtained at relapse compared to samples obtained at diagnosis from the same individual.41 Moreover, ADSL expression was marginally higher at diagnosis in patients who subsequently relapsed.42 Consistent with these findings, our data showed that ADSL expression was related to asparaginase resistance, and that two common germline polymorphisms in this gene might be the basis for both increased ADSL expression and increased resistance (Supplemental Figure S3). ADSL has been reported to be elevated in some malignancies such as colorectal, breast and prostate cancer, and gliomas.43–45
DARS, DARS2, and NARS2 are a clinically important family of cytoplasmic enzymes that play a crucial role in protein synthesis. Our previous findings have shown that asparaginase-resistant and -sensitive leukemic cells differ significantly in the expression levels of genes involved in protein synthesis.24 It is possible that an altered intracellular amino acid metabolism, particularly that involving aspartate or asparagine, might rescue cells from the effects of asparaginase.
The presence of primary or acquired elevated levels of asparagine synthetase (ASNS) has been considered as a main cause of asparaginase resistance.11–14 However, data from some recent studies (Supplemental Table S6) on the importance of ASNS are conflicting.17–23, 26, 46 Herein, we found no associations between germline polymorphisms in ASNS and asparaginase resistance.
Ex vivo sensitivity of ALL blasts to asparaginase has also been associated with ALL subtypes,47–49 with sensitive subtypes tending to be those with better event-free survival rates. The fact that we did not demonstrate that asparaginase sensitivity differed significantly among subtypes likely relates to the relatively small number of samples in each subtype. Ex vivo sensitivity to asparaginase has been associated with in vivo clinical response to asparaginase after up-front window exposures9 as well as for long-term event-free survival,5–8 and thus ex vivo drug sensitivity may be an important phenotypic characteristic of primary ALL cells.
We focused on inherited genomic variations in DNA as possible determinants of asparaginase sensitivity, whereas previous studies18, 24 focused on variation in gene expression levels. One reason to focus on germline genomic variation is that predictive testing is more likely to be useful using germline DNA than using gene expression, which varies among tissue types and over time. Moreover, genomic variation can be associated with phenotypes such as drug sensitivity and not be reflected in differences in gene expression.50–52 Nonetheless, we did observe that two SNPs in ADSL, that were associated with higher IC50 were also associated with higher ADSL expression, and high ADSL expression was associated with higher IC50.
We acknowledge that in vitro tests of drug sensitivity in lymphoblastoid cell lines will not be perfect models for in vivo sensitivity of leukemic cells, nor of other host toxicities to asparaginase such as pancreatitis or thrombosis.53 Nonetheless, these HapMap cell lines have been used to identify genomic variation associated with susceptibility to other anticancer agents, and that variation has been shown to be highly heritable.35, 54 The lack of overlap in SNPs associated with drug sensitivity in CEU compared to YRI cell lines can be partially explained by a difference in allele frequency and by different penetrance of SNPs in the two distinct populations.54 Moreover, although it is possible that some germline variation that affects anticancer drug sensitivity may be related to non-specific mechanisms that apply to all pro-apoptotic stimuli, we found relatively modest overlap (Supplemental Table S4) among SNP genotypes associated with sensitivity to asparaginase versus to other unrelated antileukemic agents, suggesting that the majority of the top-ranked SNPs were asparaginase-specific. In addition, we and others have shown some genotype/phenotype associations in lymphoblastoid cell lines that replicate those that have been observed clinically, and in other primary tissue types.54–56 In this work, we showed overlap in that the primary pathway (aspartate metabolism) associated with sensitivity in the HapMap cell lines was also associated in primary ALL cells. Therefore, HapMap resources are a useful adjunctive tool for pharmacogenetic discovery.
In the present study, there was evidence for validation that the top ranked pathway in CEU cell lines (i.e. the aspartate metabolism pathway) was also relevant in ALL samples. Given the high degree of heterogeneity among ALL subtypes, and the somatically acquired genomic variants that distinguish ALL subtypes from each other and from normal cells, it is not surprising that some determinants of asparaginase sensitivity in ALL are likely due to genomic factors other than inherited genomic variation, consistent with prior findings that genomic determinants of drug effects differ in cell lines and primary ALL samples.18, 57
In summary, our genome-wide interrogation of HapMap cell lines and primary ALL blasts has revealed that inherited genomic variation in a plausible candidate pathway (aspartate metabolism) contributes to interindividual variation in asparaginase sensitivity in both normal cells and in primary ALL cells.
Supplementary Material
Acknowledgements
We thank the patients and their families, and our research faculty and staff for participating. We also thank Nancy Kornegay and Mark Wilkinson for database and computer expertise; and Yaqin Chu, May Chung, Natalya Lenchik, Margaret Needham, Emily Melton and Siamac Salehy for outstanding technical assistance. This work was also supported by the Phelan Foundation and by the American Lebanese Syrian Associated Charities (ALSAC).
This work was supported by NCI CA78224, CA36401, and the NIH/NIGMS Pharmacogenetics Research Network and Database [U01GM61393, U01 GM92666, UO1GM61374 (www.pharmgkb.org PS207998 and PS207999)] from the National Institutes of Health and by the American Lebanese Syrian Associated Charities (ALSAC).
Footnotes
Conflict-of-interest disclosure: The authors declare no competing financial interests.
Supplementary information is available at Leukemia’s website (http://www.nature.com/leu)
References
- 1.Pui CH, Evans WE. Treatment of acute lymphoblastic leukemia. N Engl J Med. 2006;354:166–178. doi: 10.1056/NEJMra052603. [DOI] [PubMed] [Google Scholar]
- 2.Pui CH, Jeha S. New therapeutic strategies for the treatment of acute lymphoblastic leukaemia. Nat Rev Drug Discov. 2007;6:149–165. doi: 10.1038/nrd2240. [DOI] [PubMed] [Google Scholar]
- 3.Schrappe M, Reiter A, Ludwig WD, Harbott J, Zimmermann M, Hiddemann W, et al. Improved outcome in childhood acute lymphoblastic leukemia despite reduced use of anthracyclines and cranial radiotherapy: results of trial ALL-BFM 90. German-Austrian-Swiss ALL-BFM Study Group. Blood. 2000;95:3310–3322. [PubMed] [Google Scholar]
- 4.Silverman LB, Gelber RD, Dalton VK, Asselin BL, Barr RD, Clavell LA, et al. Improved outcome for children with acute lymphoblastic leukemia: results of Dana-Farber Consortium Protocol 91-01. Blood. 2001;97:1211–1218. doi: 10.1182/blood.v97.5.1211. [DOI] [PubMed] [Google Scholar]
- 5.Hongo T, Yajima S, Sakurai M, Horikoshi Y, Hanada R. In vitro drug sensitivity testing can predict induction failure and early relapse of childhood acute lymphoblastic leukemia. Blood. 1997;89:2959–2965. [PubMed] [Google Scholar]
- 6.Kaspers GJ, Veerman AJ, Pieters R, Van Zantwijk CH, Smets LA, Van Wering ER, et al. In vitro cellular drug resistance and prognosis in newly diagnosed childhood acute lymphoblastic leukemia. Blood. 1997;90:2723–2729. [PubMed] [Google Scholar]
- 7.Pieters R, Huismans DR, Loonen AH, Hahlen K, van der Does-van den Berg A, van Wering ER, et al. Relation of cellular drug resistance to long-term clinical outcome in childhood acute lymphoblastic leukaemia. Lancet. 1991;338:399–403. doi: 10.1016/0140-6736(91)91029-t. [DOI] [PubMed] [Google Scholar]
- 8.Asselin BL, Kreissman S, Coppola DJ, Bernal SD, Leavitt PR, Gelber RD, et al. Prognostic significance of early response to a single dose of asparaginase in childhood acute lymphoblastic leukemia. J Pediatr Hematol Oncol. 1999;21:6–12. doi: 10.1097/00043426-199901000-00003. [DOI] [PubMed] [Google Scholar]
- 9.Appel IM, Kazemier KM, Boos J, Lanvers C, Huijmans J, Veerman AJ, et al. Pharmacokinetic, pharmacodynamic and intracellular effects of PEG-asparaginase in newly diagnosed childhood acute lymphoblastic leukemia: results from a single agent window study. Leukemia. 2008;22:1665–1679. doi: 10.1038/leu.2008.165. [DOI] [PubMed] [Google Scholar]
- 10.Capizzi RL, Bertino JR, Skeel RT, Creasey WA, Zanes R, Olayon C, et al. L-asparaginase: clinical, biochemical, pharmacological, and immunological studies. Ann Intern Med. 1971;74:893–901. doi: 10.7326/0003-4819-74-6-893. [DOI] [PubMed] [Google Scholar]
- 11.Haskell CM, Canellos GP. l-asparaginase resistance in human leukemia--asparagine synthetase. Biochem Pharmacol. 1969;18:2578–2580. doi: 10.1016/0006-2952(69)90375-x. [DOI] [PubMed] [Google Scholar]
- 12.Horowitz B, Madras BK, Meister A, Old LJ, Boyes EA, Stockert E. Asparagine synthetase activity of mouse leukemias. Science. 1968;160:533–535. doi: 10.1126/science.160.3827.533. [DOI] [PubMed] [Google Scholar]
- 13.Kiriyama Y, Kubota M, Takimoto T, Kitoh T, Tanizawa A, Akiyama Y, et al. Biochemical characterization of U937 cells resistant to L-asparaginase: the role of asparagine synthetase. Leukemia. 1989;3:294–297. [PubMed] [Google Scholar]
- 14.Aslanian AM, Fletcher BS, Kilberg MS. Asparagine synthetase expression alone is sufficient to induce l-asparaginase resistance in MOLT-4 human leukaemia cells. Biochem J. 2001;357:321–328. doi: 10.1042/0264-6021:3570321. [DOI] [PMC free article] [PubMed] [Google Scholar]
- 15.Hutson RG, Kitoh T, Moraga Amador DA, Cosic S, Schuster SM, Kilberg MS. Amino acid control of asparagine synthetase: relation to asparaginase resistance in human leukemia cells. Am J Physiol. 1997;272:C1691–C1699. doi: 10.1152/ajpcell.1997.272.5.C1691. [DOI] [PubMed] [Google Scholar]
- 16.Asselin BL, Ryan D, Frantz CN, Bernal SD, Leavitt P, Sallan SE, et al. In vitro and in vivo killing of acute lymphoblastic leukemia cells by L-asparaginase. Cancer Res. 1989;49:4363–4368. [PubMed] [Google Scholar]
- 17.Estes DA, Lovato DM, Khawaja HM, Winter SS, Larson RS. Genetic alterations determine chemotherapy resistance in childhood T-ALL: modelling in stage-specific cell lines and correlation with diagnostic patient samples. Br J Haematol. 2007;139:20–30. doi: 10.1111/j.1365-2141.2007.06763.x. [DOI] [PubMed] [Google Scholar]
- 18.Fine BM, Kaspers GJ, Ho M, Loonen AH, Boxer LM. A genome-wide view of the in vitro response to l-asparaginase in acute lymphoblastic leukemia. Cancer Res. 2005;65:291–299. [PubMed] [Google Scholar]
- 19.Iwamoto S, Mihara K, Downing JR, Pui CH, Campana D. Mesenchymal cells regulate the response of acute lymphoblastic leukemia cells to asparaginase15. J Clin Invest. 2007;117:1049–1057. doi: 10.1172/JCI30235. [DOI] [PMC free article] [PubMed] [Google Scholar]
- 20.Krejci O, Starkova J, Otova B, Madzo J, Kalinova M, Hrusak O, et al. Upregulation of asparagine synthetase fails to avert cell cycle arrest induced by L-asparaginase in TEL/AML1-positive leukaemic cells. Leukemia. 2004;18:434–441. doi: 10.1038/sj.leu.2403259. [DOI] [PubMed] [Google Scholar]
- 21.Scherf U, Ross DT, Waltham M, Smith LH, Lee JK, Tanabe L, et al. A gene expression database for the molecular pharmacology of cancer. Nat Genet. 2000;24:236–244. doi: 10.1038/73439. [DOI] [PubMed] [Google Scholar]
- 22.Stams WA, den Boer ML, Beverloo HB, Meijerink JP, Stigter RL, van Wering ER, et al. Sensitivity to L-asparaginase is not associated with expression levels of asparagine synthetase in t(12;21)+ pediatric ALL. Blood. 2003;101:2743–2747. doi: 10.1182/blood-2002-08-2446. [DOI] [PubMed] [Google Scholar]
- 23.Stams WA, den Boer ML, Holleman A, Appel IM, Beverloo HB, van Wering ER, et al. Asparagine synthetase expression is linked with L-asparaginase resistance in TEL-AML1-negative but not TEL-AML1-positive pediatric acute lymphoblastic leukemia. Blood. 2005;105:4223–4225. doi: 10.1182/blood-2004-10-3892. [DOI] [PubMed] [Google Scholar]
- 24.Holleman A, Cheok MH, den Boer ML, Yang W, Veerman AJ, Kazemier KM, et al. Gene-expression patterns in drug-resistant acute lymphoblastic leukemia cells and response to treatment. N Engl J Med. 2004;351:533–542. doi: 10.1056/NEJMoa033513. [DOI] [PubMed] [Google Scholar]
- 25.Abshire TC, Pollock BH, Billett AL, Bradley P, Buchanan GR. Weekly polyethylene glycol conjugated L-asparaginase compared with biweekly dosing produces superior induction remission rates in childhood relapsed acute lymphoblastic leukemia: a Pediatric Oncology Group Study. Blood. 2000;96:1709–1715. [PubMed] [Google Scholar]
- 26.Holleman A, den Boer ML, de Menezes RX, Cheok MH, Cheng C, Kazemier KM, et al. The expression of 70 apoptosis genes in relation to lineage, genetic subtype, cellular drug resistance, and outcome in childhood acute lymphoblastic leukemia. Blood. 2006;107:769–776. doi: 10.1182/blood-2005-07-2930. [DOI] [PMC free article] [PubMed] [Google Scholar]
- 27.Pui CH, Campana D, Pei D, Bowman WP, Sandlund JT, Kaste SC, et al. Treating childhood acute lymphoblastic leukemia without cranial irradiation. N Engl J Med. 2009;360:2730–2741. doi: 10.1056/NEJMoa0900386. [DOI] [PMC free article] [PubMed] [Google Scholar]
- 28.French D, Yang W, Hamilton LH, Neale G, Fan Y, Downing JR, et al. Concordant gene expression in leukemia cells and normal leukocytes is associated with germline cis-SNPs. PLoS ONE. 2008;3:e2144. doi: 10.1371/journal.pone.0002144. [DOI] [PMC free article] [PubMed] [Google Scholar]
- 29.Pieters R, Loonen AH, Huismans DR, Broekema GJ, Dirven MW, Heyenbrok MW, et al. In vitro drug sensitivity of cells from children with leukemia using the MTT assay with improved culture conditions. Blood. 1990;76:2327–2336. [PubMed] [Google Scholar]
- 30.Pottier N, Cheok MH, Yang W, Assem M, Tracey L, Obenauer JC, et al. Expression of SMARCB1 modulates steroid sensitivity in human lymphoblastoid cells: identification of a promoter SNP that alters PARP1 binding and SMARCB1 expression. Hum Mol Genet. 2007;16:2261–2271. doi: 10.1093/hmg/ddm178. [DOI] [PubMed] [Google Scholar]
- 31.D'Argenio DZ, Schumitzky A. Adapt II User's Guide: Pharmacokinetic/Pharmacodynamic Systems Analysis Software. Los Angeles: Biomedical Simulations Resource; 1997. [Google Scholar]
- 32.Pieters R, Huismans DR, Leyva A, Veerman AJ. Adaptation of the rapid automated tetrazolium dye based (MTT) assay for chemosensitivity testing in childhood leukemia. Cancer Lett. 1988;41:323–332. doi: 10.1016/0304-3835(88)90294-7. [DOI] [PubMed] [Google Scholar]
- 33.Beesley AH, Palmer ML, Ford J, Weller RE, Cummings AJ, Freitas JR, et al. Authenticity and drug resistance in a panel of acute lymphoblastic leukaemia cell lines. Br J Cancer. 2006;95:1537–1544. doi: 10.1038/sj.bjc.6603447. [DOI] [PMC free article] [PubMed] [Google Scholar]
- 34.Breiman L. Random Forests. Mach Learn. 2001;45:5–32. [Google Scholar]
- 35.Huang RS, Duan S, Shukla SJ, Kistner EO, Clark TA, Chen TX, et al. Identification of genetic variants contributing to cisplatin-induced cytotoxicity by use of a genomewide approach. Am J Hum Genet. 2007;81:427–437. doi: 10.1086/519850. [DOI] [PMC free article] [PubMed] [Google Scholar]
- 36.Engel K, Hohne W, Haberle J. Mutations and polymorphisms in the human argininosuccinate synthetase (ASS1) gene. Hum Mutat. 2009;30:300–307. doi: 10.1002/humu.20847. [DOI] [PubMed] [Google Scholar]
- 37.Ohno T, Kimura Y, Sakurada K, Sugimura K, Fujiyoshi T, Saheki T, et al. Argininosuccinate synthetase gene expression in leukemias: potential diagnostic marker for blastic crisis of chronic myelocytic leukemia. Leuk Res. 1992;16:475–483. doi: 10.1016/0145-2126(92)90173-5. [DOI] [PubMed] [Google Scholar]
- 38.Piga A, Sylwestrowicz T, Ganeshaguru K, Breatnach F, Amos R, Prentice HG, et al. Nucleoside incorporation into DNA and RNA in acute leukaemia: differences between the various leukaemia sub-types. Br J Haematol. 1982;52:195–204. doi: 10.1111/j.1365-2141.1982.tb03881.x. [DOI] [PubMed] [Google Scholar]
- 39.Scholar EM, Calabresi P. Identification of the enzymatic pathways of nucleotide metabolism in human lymphocytes and leukemia cells. Cancer Res. 1973;33:94–103. [PubMed] [Google Scholar]
- 40.Pui CH, Evans WE. Acute lymphoblastic leukemia. N Engl J Med. 1998;339:605–615. doi: 10.1056/NEJM199808273390907. [DOI] [PubMed] [Google Scholar]
- 41.Bhojwani D, Kang H, Moskowitz NP, Min DJ, Lee H, Potter JW, et al. Biologic pathways associated with relapse in childhood acute lymphoblastic leukemia: a Children's Oncology Group study. Blood. 2006;108:711–717. doi: 10.1182/blood-2006-02-002824. [DOI] [PMC free article] [PubMed] [Google Scholar]
- 42.Bhojwani D, Kang H, Menezes RX, Yang W, Sather H, Moskowitz NP, et al. Gene expression signatures predictive of early response and outcome in high-risk childhood acute lymphoblastic leukemia: A Children's Oncology Group Study [corrected] J Clin Oncol. 2008;26:4376–4384. doi: 10.1200/JCO.2007.14.4519. [DOI] [PMC free article] [PubMed] [Google Scholar]
- 43.Bardot V, Dutrillaux AM, Delattre JY, Vega F, Poisson M, Dutrillaux B, et al. Purine and pyrimidine metabolism in human gliomas: relation to chromosomal aberrations. Br J Cancer. 1994;70:212–218. doi: 10.1038/bjc.1994.282. [DOI] [PMC free article] [PubMed] [Google Scholar]
- 44.Reed VL, Mack DO, Smith LD. Adenylosuccinate lyase as an indicator of breast and prostate malignancies: a preliminary report. Clin Biochem. 1987;20:349–351. doi: 10.1016/s0009-9120(87)80085-1. [DOI] [PubMed] [Google Scholar]
- 45.Weber G. Enzymes of purine metabolism in cancer. Clin Biochem. 1983;16:57–63. doi: 10.1016/s0009-9120(83)94432-6. [DOI] [PubMed] [Google Scholar]
- 46.Su N, Pan YX, Zhou M, Harvey RC, Hunger SP, Kilberg MS. Correlation between asparaginase sensitivity and asparagine synthetase protein content, but not mRNA, in acute lymphoblastic leukemia cell lines. Pediatr Blood Cancer. 2008;50:274–279. doi: 10.1002/pbc.21213. [DOI] [PMC free article] [PubMed] [Google Scholar]
- 47.Kaspers GJ, Smets LA, Pieters R, Van Zantwijk CH, Van Wering ER, Veerman AJ. Favorable prognosis of hyperdiploid common acute lymphoblastic leukemia may be explained by sensitivity to antimetabolites and other drugs: results of an in vitro study. Blood. 1995;85:751–756. [PubMed] [Google Scholar]
- 48.Ramakers-van Woerden NL, Pieters R, Loonen AH, Hubeek I, van Drunen E, Beverloo HB, et al. TEL/AML1 gene fusion is related to in vitro drug sensitivity for L-asparaginase in childhood acute lymphoblastic leukemia. Blood. 2000;96:1094–1099. [PubMed] [Google Scholar]
- 49.Pieters R, den Boer ML, Durian M, Janka G, Schmiegelow, Kaspers GJ, et al. Relation between age, immunophenotype and in vitro drug resistance in 395 children with acute lymphoblastic leukemia--implications for treatment of infants. Leukemia. 1998;12:1344–1348. doi: 10.1038/sj.leu.2401129. [DOI] [PubMed] [Google Scholar]
- 50.Tai HL, Krynetski EY, Schuetz EG, Yanishevski Y, Evans WE. Enhanced proteolysis of thiopurine S-methyltransferase (TPMT) encoded by mutant alleles in humans (TPMT*3A, TPMT*2): mechanisms for the genetic polymorphism of TPMT activity. Proc Natl Acad Sci USA. 1997;94:6444–6449. doi: 10.1073/pnas.94.12.6444. [DOI] [PMC free article] [PubMed] [Google Scholar]
- 51.Loennechen T, Yates CR, Fessing MY, Relling MV, Krynetski EY, Evans WE. Isolation of a human thiopurine S-methyltransferase (TPMT) complementary DNA with a single nucleotide transition A719G (TPMT*3C) and its association with loss of TPMT protein and catalytic activity in humans. Clin Pharmacol Ther. 1998;64:46–51. doi: 10.1016/S0009-9236(98)90021-2. [DOI] [PubMed] [Google Scholar]
- 52.Cao A, Galanello R. Beta-thalassemia. Genet Med. 2010;12:61–76. doi: 10.1097/GIM.0b013e3181cd68ed. [DOI] [PubMed] [Google Scholar]
- 53.Choy E, Yelensky R, Bonakdar S, Plenge RM, Saxena R, De Jager PL, et al. Genetic analysis of human traits in vitro: drug response and gene expression in lymphoblastoid cell lines. PLoS Genet. 2008;4:e1000287. doi: 10.1371/journal.pgen.1000287. [DOI] [PMC free article] [PubMed] [Google Scholar]
- 54.Hartford CM, Duan S, Delaney SM, Mi S, Kistner EO, Lamba JK, et al. Population-specific genetic variants important in susceptibility to cytarabine arabinoside cytotoxicity. Blood. 2009;113:2145–2153. doi: 10.1182/blood-2008-05-154302. [DOI] [PMC free article] [PubMed] [Google Scholar]
- 55.Jones TS, Yang W, Evans WE, Relling MV. Using HapMap tools in pharmacogenomic discovery: the thiopurine methyltransferase polymorphism. Clin Pharmacol Ther. 2007;81:729–734. doi: 10.1038/sj.clpt.6100135. [DOI] [PubMed] [Google Scholar]
- 56.Welsh M, Mangravite L, Medina MW, Tantisira K, Zhang W, Huang RS, et al. Pharmacogenomic discovery using cell-based models. Pharmacol Rev. 2009;61:413–429. doi: 10.1124/pr.109.001461. [DOI] [PMC free article] [PubMed] [Google Scholar]
- 57.French D, Yang W, Cheng C, Raimondi SC, Mullighan CG, Downing JR, et al. Acquired variation outweighs inherited variation in whole genome analysis of methotrexate polyglutamate accumulation in leukemia. Blood. 2009;113:4512–4520. doi: 10.1182/blood-2008-07-172106. [DOI] [PMC free article] [PubMed] [Google Scholar]
Associated Data
This section collects any data citations, data availability statements, or supplementary materials included in this article.