

Comparative analysis of Erk phosphorylation suggests a mixed strategy for measuring phospho-form distributions. Four methods were compared for quantifying the proportion of Erk2 ‘phospho-forms’ in differentially phosphorylated samples, revealing excellent agreement between mass spectrometry and nuclear magnetic resonance, but significant discrepancies with western blots.
Keywords: mass spectrometry, multisite phosphorylation; NMR; phospho-form distribution; phospho-specific antibodies
Abstract
The functional impact of multisite protein phosphorylation can depend on both the numbers and the positions of phosphorylated sites—the global pattern of phosphorylation or ‘phospho-form’—giving biological systems profound capabilities for dynamic information processing. A central problem in quantitative systems biology, therefore, is to measure the ‘phospho-form distribution’: the relative amount of each of the 2n phospho-forms of a protein with n-phosphorylation sites. We compared four potential methods—western blots with phospho-specific antibodies, peptide-based liquid chromatography (LC) and mass spectrometry (MS; pepMS), protein-based LC/MS (proMS) and nuclear magnetic resonance spectroscopy (NMR)—on differentially phosphorylated samples of the well-studied mitogen-activated protein kinase Erk2, with two phosphorylation sites. The MS methods were quantitatively consistent with each other and with NMR to within 10%, but western blots, while highly sensitive, showed significant discrepancies with MS. NMR also uncovered two additional phosphorylations, for which a combination of pepMS and proMS yielded an estimate of the 16-member phospho-form distribution. This combined MS strategy provides an optimal mixture of accuracy and coverage for quantifying distributions, but positional isomers remain a challenging problem.
Introduction
Phosphorylation on serine (S), threonine (T) and tyrosine (Y) residues is the most widely studied post-translational modification (PTM) on eukaryotic proteins (Marks, 1996; Cohen, 2001). Its dynamic, energy-intensive maintenance by protein kinases and phosphoprotein phosphatases, collectively encoded by 3% of the human genome, testifies to its importance as a regulatory mechanism. Many phosphoproteins are multiply phosphorylated, and a protein molecule with n-phosphorylation sites may have 2n global patterns of phosphorylation or ‘phospho-forms’. The significance of so many molecular states remains a fascinating problem (Cohen, 2000; Holmberg et al, 2002; Thomson and Gunawardena, 2009). Cartoon diagrams give the doubly misleading impression that a multiply phosphorylated protein has only a single phospho-form and that this remains static. In reality, there is a population of molecules present, each molecule has its own phospho-form and these phospho-forms are being dynamically modified by the opposing actions of the cognate kinases and phosphatases.
This viewpoint is important because different phospho-forms may have different biological effects—both the numbers and the positions of phosphorylations may be significant—as observed for signalling proteins (Cha and Shapiro, 2001), transcription factors (Pufall et al, 2005), transcriptional co-activators (Wu et al, 2004), ion channels (Park et al, 2006) and circadian clock components (Baker et al, 2009). The realisation of substantial cross-talk between phosphorylation and other PTMs (Hunter, 2007), as found in the histone ‘code’ (Pesavento et al, 2008; Phanstiel et al, 2008), reinforces the same point in a broader context, while theoretical studies suggest that global patterns of modification can encode substantial amounts of information (Thomson and Gunawardena, 2009). In the light of such evidence, we suggest that it is the phospho-form distribution—the relative amount of each of the 2n phospho-forms—that is essential for a deeper understanding of multisite phosphorylation. While not all phospho-forms may be present, those that are may be crucial for interpreting the downstream response to phosphorylation.
We focus on phosphorylation, but this message is equally valid for all dynamic PTMs. It is the ‘mod-form distribution’—the relative amounts of each global modification state—that carries the most information about protein function and which is regulated by the collective actions of the modifying and demodifying enzymes.
This study has three aims: to bring this conceptual viewpoint to a broader audience; to compare current methods for measuring phospho-form distributions; and to discuss the challenges in developing a general strategy. We contrasted four methods: western blots with phospho-specific antibodies; peptide-based liquid chromatography and mass spectrometry (LC/MS), in which proteins are first digested into peptides (pepMS); protein-based LC/MS with intact proteins (proMS); and nuclear magnetic resonance spectroscopy (NMR). While the last method remains specialised, it offers the possibility of time-resolved measurements in cells or extracts (Selenko and Wagner, 2007). With each method, our concern was quantification, not merely detection.
We chose to analyse in detail the 42 kDa mitogen-activated protein (MAP) kinase Erk2 (Erk) in multiple phosphorylation states. Erk is phosphorylated on T and Y residues in a TEY motif within its activation loop (Figure 1A and B). Because these sites are so close together, a quantitative comparison between western blots, MS and NMR becomes feasible. The MAP kinase cascade is also a reiterated motif found in numerous signalling networks (Lewis et al, 1998), Erk is widely studied as a paradigmatic signalling protein (Yao and Seger, 2009) and evidence suggests that different Erk phospho-forms have different biological effects (Cha and Shapiro, 2001). Despite its apparent simplicity with only two sites, the analysis of Erk illuminated the challenges in quantifying phospho-form distributions.
Figure 1.
Antibody analysis of Erk. (A) Primary sequence of the His6-tagged Erk2 from Xenopus laevis used in the paper, showing two tryptic peptides identified as being phosphorylated (underlined): the central peptide contains the two activating phosphorylation sites in the canonical TEY motif and the N-terminal peptide (omitting the N-terminal M, which is cleaved) contains the His6 tag and the two novel S-phosphorylation sites discussed in the text. The phospho-sites are marked in large, bold, blue font. (B) Ribbon diagram of Erk2 from Rattus norvegicus (PDB-2ERK) showing activating phosphorylations on T and Y (yellow). (C) Summary of amount/intensity relationship for each antibody. The measures R2 and α are explained in the text and derived from the data in Supplementary Figure 1. (D) Phospho-form measurements. Each vertical sub-panel shows the results from the antibody listed at the top of the sub-panel. Erk samples are listed horizontally at the bottom with X denoting sample Erk-X. Each bar gives the ratio of the fluorescence intensity of the corresponding antibody to the intensity of the anti-total Erk antibody. Both antibodies were multiplexed on the same gel. Each of the four Erk samples were run in triplicate on the same gel and each gel was repeated three times; error bars give the mean±s.d. of the nine data points. The underlying data are shown in Supplementary Figure 2. Note that there is no sum normalisation and it is coincidental that values lie between 0 and 1. The arrows show particular comparisons discussed in the text. Source data is available for this figure at www.nature.com/msb.

Results
Four samples of Erk in different states of phosphorylation were prepared as follows. Recombinant Erk was purified from E. coli and designated Erk-TY. Mek, the dual-specificity kinase that activates Erk in vivo, was used to phosphorylate Erk-TY in vitro and the resulting sample was designated Erk-pTpY. The tyrosine phosphatase PTP and the serine/threonine phosphatase PP2A were then separately used to dephosphorylate Erk-pTpY in vitro and the resulting samples were designated Erk-pTY and Erk-TpY, respectively. For each sample, the suffix indicates the phospho-form that was expected to be predominantly present following this procedure. However, it is important to appreciate that each sample may have some amount of each phospho-form. For instance, Erk-TY was always found to have some amount of the TEpY phospho-form, perhaps due to autophosphorylation or to stray phosphorylation by bacterial tyrosine kinases (Grangeasse et al, 2007). Determining how much of each of the four phospho-forms was actually present in each of the four samples was the point of the analysis. The samples were prepared once, isotopically labelled in preparation for NMR, and used for all four methods of analysis that follow. A second set of samples, differently prepared, was used to compare western blots and MS, and details of this are given in the relevant section below. Throughout the paper, samples are distinguished from phospho-forms by using bold font for the former, as just described, and italics for the latter, as in TY, pTY, TpY and pTpY .
Phospho-specific antibody analysis
Phospho-specific monoclonal antibodies against each Erk phospho-form were obtained from Sigma-Aldrich (Figure 1C). We used secondary antibodies with near-infrared fluorescence detection (Odyssey IR Imaging System, LI-COR Biosciences), in preference to chemiluminescence and CCD imaging, because the former shows substantially improved linearity and increased sensitivity (Schutz-Geschwender et al, 2004). The LI-COR system also permits antibody multiplexing in the same gel without the need for stripping, and we exploited this to simultaneously measure total Erk (i.e., irrespective of its phosphorylation state) using a rabbit polyclonal antibody raised against a distinct C-terminal epitope.
For each of these five antibodies, we undertook a dilution series using the corresponding sample (Erk-pTpY for anti-pTpY and so on, with Erk-TY for anti-total Erk). The relationship between sample amount, x, and measured fluorescence intensity, y, is expected to fit a power law, y=Axα (Schutz-Geschwender et al, 2004). The goodness of fit was assessed by two numbers (Figure 1C and Supplementary Figure 1). R2 is the correlation coefficient on a log–log plot; the closer it is to 1, the closer the data are a fit to a power law. The closer the exponent, α, is to 1, the closer the data are to a linear, proportional relationship between amount and intensity. A quantitatively ‘good’ antibody is generally expected to have R2≈1 and α≈1 (Mollica et al, 2009). Over sample loadings from 20 to 900 pg, the anti-total Erk and anti-TY antibodies show good linearity on a log–log plot; the anti-pTpY antibody shows reasonable linearity; however, both antibodies against singly phosphorylated states show substantially less linearity by both tests.
Our interest here is in quantifying the relative amount of each phospho-form present in each sample. Accordingly, for each phospho-form, the intensity of the corresponding phospho-specific antibody was divided by the intensity of the anti-total Erk antibody (Figure 1D and Supplementary Figure 2). The normalisation helps correct for loading errors and lane-to-lane and gel-to-gel variations, and the standard deviation between replicates was found to be no more than 6% of the mean. The effect of this normalisation is analysed further in the Discussion section.
Peptide-based MS
In pepMS, proteins are first digested into peptides. If the ‘protein’, SXXS, is cut between the two S's, the phospho-peptide (pS)X may have originated from either the phospho-protein (pS)XXS or (pS)XX(pS). Multiple digestions, using proteases that give different allocations of sites to peptides, still do not provide sufficient information to ‘deconvolute’ the phospho-proteins from the phospho-peptides. The deconvolution problem remains a major challenge.
Even if all sites occur on a single peptide, as they do for the TEY sites of Erk, positional isomers with the same number of phospho groups would be isobaric with the same m/z and would not be separated by MS. However, digested peptides are first run through a reversed-phase LC column prior to MS, which provides a complementary dimension of separation by hydrophobicity. For instance, after tryptic digestion of Erk, the isobaric phospho-peptide forms, TpY and pTY, eluted 3 min apart on a standard LC gradient, while TY and pTpY showed similar elution profiles (Figure 2A). Because of the wide range of solid phases, solvents and gradients that can be used in LC, there seems reasonable opportunity to use hydrophobicities to separate isobaric phospho-peptides (Kim et al, 2007).
Figure 2.
Peptide-based MS analysis of Erk. (A) Equal amounts of each of the synthetic internal standards were subjected to LC/MS. The left panel shows three superimposed extracted ion chromatograms for the m/z values expected for 0 (red), 1 (blue) and 2 (green) phosphorylations. Each individual chromatogram has been normalised to the intensity of its maximal peak. The singly phosphorylated peptides were identified by MS2. The right panels show the normalised MS2 spectra for the z=3 charge state (m/z=745.33) eluting around 24.2 min (top) and around 20.9 min (bottom). The top spectrum shows the neutral loss of phosphoric acid (m/z=712.7) that characterises pTY. Its absence in the bottom spectrum characterises TpY. (B) Phospho-form distributions of each of the four Erk samples. The peak area of the phospho-form was divided by the peak area of the corresponding internal standard, and the four ratios for each phospho-form were then sum normalised as proportions of the total. Data were pooled from experiments carried out on different days, with five replicates for Erk-TY and Erk-pTpY and three replicates for Erk-pTY and Erk-TpY; the error bars give the mean±s.d. of the corresponding normalised values. (C) The values in B have been rearranged for comparison with Figure 1D. Each vertical sub-panel shows the results for the phospho-form listed at the top of the sub-panel, for each of the four samples, as listed horizontally. The arrows show the corresponding comparisons with those in Figure 1D. Source data is available for this figure at www.nature.com/msb.

There remains the problem of quantification. Peak areas in the mass spectrometer do not correspond to sample amounts because different peptides, including different phospho-peptides, have different ionisation and detection efficiencies, or ‘flyabilities’ (Steen et al, 2005a). For instance, the two singly phosphorylated Erk peptides show a substantial difference in intensity (Figure 2A) despite equal amounts of sample. Some peptides may not be detected at all, resulting in incomplete sequence coverage after tryptic digestion; we typically obtained coverage of between 50 and 80% of the amino acids in Erk, depending on the run.
We used the AQUA method of absolute quantification (Kirkpatrick et al, 2005), in which identical amounts of stable-isotope-labelled peptide standards are introduced during digestion. The analytes and their respective standards are expected to fly with identical efficiencies, allowing the efficiencies to be cancelled. By targeting the MS scans to the expected phospho-peptides, we obtained in this way the phospho-form distributions—the relative amounts of each of the four phospho-forms—of all four Erk samples (Figure 2B), with a standard deviation between replicates of <3% of the mean. Normalising each value to the total of all four phospho-forms (‘sum normalisation’) has a significant role in increasing precision by controlling for variations in digestion efficiency and loading.
To enable comparison with Figure 1D, we rearranged these data by collecting together, for each phospho-form, the amounts found in all samples (Figure 2C). The relationship between Figures 2C and 1D is discussed in the next section.
PepMS also reveals information about the enzymes. A theoretical pY dephosphorylation can be carried out on the Erk-pTpY phospho-form distribution in Figure 2B and compared with the distribution for Erk-pTY. The sum of pTpY and pTY values for Erk-pTpY agrees to within 3% with the pTY value for Erk-pTY. So too does the sum of the TpY and TY values for Erk-pTpY compared with the TY value for Erk-pTY. This suggests that the tyrosine phosphatase was able to run to completion. In contrast, a similar calculation shows that the S/T phosphatase has been unable to fully dephosphorylate Erk-pTpY .
Comparison between pepMS and antibodies
To compare quantifications, the following terminology will be helpful. We say that a measurement is ‘semi-quantitative’ if, whenever the proportion of phospho-form in sample 1 is less than the proportion in sample 2, the measurement value on sample 1 is less than its value on sample 2. This is the least that can be expected from a measurement, but it already raises interesting issues upon which we focus here.
If pepMS is assumed to provide the more accurate estimate of phospho-form proportions, then a comparison of Figures 1D and 2C reveals numerous discrepancies marked by the arrows. The anti-TY antibody indicates that the proportion of the TY phospho-form in Erk-TpY is lower than in Erk-pTpY, while pepMS shows no statistically significant difference. The anti-pTY antibody indicates that the proportion of pTY in Erk-TY is more than that in Erk-pTpY, while pepMS indicates the reverse. The anti-pTpY antibody indicates that the proportion of pTpY in Erk-TY is less than in Erk-pTY, while pepMS indicates the reverse. The anti-TpY antibody is the only one that appears semi-quantitatively consistent on this data.
We were surprised by these discrepancies, so we repeated the comparison on a different set of non-isotopically labelled samples, prepared by a modified procedure. Erk-TY was prepared as before but without 15N-labelling. Erk-pTpY was prepared using a new plasmid incorporating both Erk and activated Mek, so that Erk phosphorylation took place in vivo. Erk-pTY and Erk-TpY were then prepared by dephosphorylation as before but with only half as much phosphatase in each case. The intention was to create a new set of biological samples with partially distinct phospho-form distributions. This enabled us to check the reproducibility of our procedures as well as the quantitative consistency of the antibodies.
The phospho-form distribution of the new Erk-TY (Supplementary Figure 3) agrees to within 10% with that of the old Erk-TY (Figure 2B). The only difference between these samples is that the former was not isotope labelled, so this shows excellent reproducibility of pepMS on biological replicates. However, the distributions of the new Erk-pTpY, Erk-pTY and Erk-TpY are less concentrated on the corresponding phospho-form as those of the old samples, suggesting that the in vivo phosphorylation was less efficient, as was the reduced extent of dephosphorylation. For comparison with the antibody data, the phospho-form distributions were rearranged by collecting together, for each phospho-form, the amounts found in all samples (Figure 3A).
Figure 3.
Comparison of pepMS and antibodies. (A) Rearrangement of the phospho-form distributions (Supplementary Figure 3) of the second, non-isotopically labelled sample set. For each phospho-form listed at the top of each sub-panel, the normalised values of the phospho-form for each sample are collected together. Samples are listed at the bottom of the figure. (B) Antibody data for the second sample set, as in Figure 1D. (C) Antibody data for the second sample set, after spiking with whole-cell lysate. The vertical scales for B and C lie between 0 and 1 only by coincidence; there is no sum-normalisation, as there is for A. The arrows show comparisons discussed in the text. Similar results were obtained using HRP-conjugated antibodies and CCD imaging (Supplementary Figure 4). Source data is available for this figure at www.nature.com/msb.

To test the antibodies for the influence of non-specific binding, the new samples were blotted as before (Figure 3B) and also after spiking with whole-cell lysate, at 250 pg of Erk to 10 μg of lysate in each well (Figure 3C). The levels obtained were nearly identical. This shows excellent reproducibility and confirms that, with this method, none of the antibodies are significantly distracted by a substantial excess of non-specific binding opportunities. As a further test, we repeated the western blots using HRP-conjugated secondary antibodies and CCD imaging. Here, we found differences between the measurements with and without whole-cell lysate (Supplementary Figure 4A and B) but the with-lysate data remains semi-quantitatively identical to that obtained by fluorescence detection (Supplementary Figure 4B and Figure 3B and C).
Figure 3A and B reveal semi-quantitative inconsistencies with all the antibodies, as marked by the arrows, similar to those found for the first set of samples. Some potential explanations for these inconsistencies are reviewed in the Discussion section.
Protein-based MS
The development of high-mass accuracy and high-resolution MSs has facilitated MS analysis of intact proteins (Breuker et al, 2008). The potential advantages over pepMS are 100% coverage and avoidance of the deconvolution problem. However, although the LC protocol was carefully optimised, all phospho-forms had a similar elution profile. The larger size of an intact protein compared to a peptide (370 amino acids for Erk versus 19 for the TEY tryptic peptide), means that a single phospho-group has less relative effect on the protein's physical properties (Kim et al, 2007).
In the absence of LC separation, MS can only separate the different groups of isobaric phospho-forms. Protein MS creates many more charge states than peptide MS (Figure 4A), but these can be computationally deconvoluted into a charge-neutral mass spectrum (Figure 4B). Neutral mass values of some of the major peaks agreed with the calculated masses of Erk phospho-forms to within 100 p.p.m. but we found four, not two, phosphorylations on Erk-pTpY and three on Erk-pTY (Figure 4B and C). We had undertaken an initial survey of Erk by pepMS, prior to the targeted scans of the TEY peptide discussed previously, but had not seen these modifications. In fact, they were first observed by NMR (see below). This illustrates the importance of methods that give an unbiased view of the potential modifications on the whole protein.
Figure 4.
Protein-based MS analysis of Erk. (A) Mass/charge spectrum of intact Erk-pTpY, showing multiple charge states. (B) Neutral mass spectrum of Erk-pTpY, after charge-state deconvolution. The calculated masses of 15N-labelled His6-tagged Erk2, with 0 to 4 phosphorylations are listed in the inset. Those for 2P, 3P and 4P agree to within 100 p.p.m. with the peaks marked in the spectrum. The positions that would have been occupied by the 0P and 1P states are shown by vertical arrows. Three of the remaining peaks correspond to oxidation products (+32Da, marked by asterisks). (C) Sum-normalised distributions of isobaric groups for each of the four samples, showing 0–4 phosphorylations. Only two phosphorylation sites were detected in the Erk-TY and Erk-TpY samples and the insets compare the proMS values with those calculated from the pepMS data in Figure 2B. Five replicates were used for Erk-TY and Erk-pTpY and the error bars show mean±s.d. Due to insufficient material, only two replicates were possible for Erk-pTY and Erk-TpY. The corresponding columns show the mean, with the two data points listed above to show the variation. Source data is available for this figure at www.nature.com/msb.

We attempted to distinguish the singly phosphorylated phospho-forms by MS2. Unlike proteolytic digestion, which destroys correlations between modifications on different peptides, MS fragmentation typically yields a ladder of fragments caused by breakage of the backbone bond in successive residues. For small proteins, such fragment ladders may yield sufficient information to distinguish isobaric modifications (Pesavento et al, 2006, 2008). However, for 42 kDa Erk, fragmentation by collision-induced dissociation (CID) produced only short fragment ladders from the N and C terminals. No fragments separated the T and Y in the TEY motif, as would be required to distinguish pTY and TpY.
Despite this, Figure 4C has two features that reveal more information. Erk-TY and Erk-TpY each show a maximum of two phosphorylations. If the proportions of Erk-TY and Erk-TpY with 0, 1 and 2 phosphorylations are calculated from the pepMS data in Figure 2C, they agree to within 7% with those obtained by proMS (Figure 4C, insets). We interpret this to mean that neither Erk-TY nor Erk-TpY have phosphorylations other than those on TEY and, moreover, that proMS shows good quantitative agreement with the results from pepMS, without the need for any internal standards. Indeed, intact proteins are less sensitive than peptides to modification-induced changes in flyabilities (Pesavento et al, 2008). The second feature is the similarity after shifting of the distributions of Erk-pTY and Erk-pTpY. This is exploited below.
NMR
The four Erk samples had been 15N-labelled in anticipation of doing two-dimensional 1H/15N HSQC NMR. Peak widths in NMR depend inversely on the relaxation time of the transient magnetisation induced by the NMR pulse sequence (Selenko and Wagner, 2007). Rapid tumbling lengthens the relaxation time, so that disordered proteins or peptide digests generally yield sharper spectra and higher signal-to-noise than their globular counterparts. We first set out to denature the Erk samples with 30% DMSO or 6 M urea, but neither method yielded interpretable HSQC spectra. It is possible that Erk still retains a molten globule structure under these conditions. We therefore used tryptic digestion, as with pepMS. The peptide mixture showed significantly reduced amide proton chemical shift dispersion and yielded an interpretable 1H/15N HSQC spectrum.
Phosphorylated residues show two characteristic identifying features. First, pS and pT resonances have a higher (‘downfield’) amide proton chemical shift and can be easily identified in the sparsely populated region above 8.8 p.p.m. δ 1H (Bienkiewicz and Lumb, 1999). Second, their average pKa value of 6.4 gives their chemical shift a strong pH dependence. These criteria provide unambiguous identification of pS and pT (Landrieu et al, 2006). The Erk-pTpY spectrum shows several novel peaks compared with Erk-TY that meet both criteria (Figure 5A and B). A three-dimensional HNCACB spectrum on a separately prepared 13C, 15N-labelled sample, confirmed that the major peak at 8.88 δ 1H, 119.0 δ 15N came from a pT residue, as it had 13C chemical shifts at 63.06 and 72.42 (Figure 5A, inset 1) that are compatible with the random coil chemical shift values of pT Cα and Cβ, respectively (Bienkiewicz and Lumb, 1999).
Figure 5.

NMR spectra of Erk. (A) Superimposed 1H/15N HSQC spectra of Erk-pTpY (black) and Erk-TY (red). Blue circles and arrows mark the C-terminal Y resonance used for normalisation (Supplementary Figure 8) and the additional A and T resonances used for quantifying pTpY (Supplementary Methods 1.1). The small box in the centre shows a major and a minor peak that are present in Erk-pTpY but not in Erk-TY, in the region above 8.8 δ 1H, where pS and pT are found. The box is enlarged in inset 2. Inset 1 shows a section of the 3D HNCACB spectrum, with the peaks corresponding to the Cα and Cβ of the major peak in Erk-pTpY (vertical black dashed line). This identifies the major peak as coming from pT. Inset 3 shows the region corresponding to inset 2 from the 1H/15N HSQC spectrum of Erk-pTY. Supplementary Figure 6 explains why the major peak of Erk-pTY and the minor peak of Erk-pTpY, linked by the vertical blue dashed line, represent pT(EY), while the major peak in the Erk-pTpY sample represents pT(EpY). Additional peaks below the small box do not titrate with pH and therefore do not correspond to phosphorylated residues. The horizontal scales on all three insets are the same (δ 1H in p.p.m.), but the vertical scale on inset 1 is δ 13C in p.p.m., while on insets 2 and 3 it is δ 15N in p.p.m. (B) Superimposition of three 1H/15N HSQC spectra, colour coded as described in the legend. Note that the horizontal and vertical ranges are different from the insets in part a. The minor peak in the Erk-pTpY spectrum falls on the same pH titration line as the major peaks in the Erk-pTY spectra, supporting the assignment in A. The resonances in the two pH titration lines at the top (arrows) show that there are at least two more pS or pT residues in addition to that on the canonical TEY motif, as discussed in the text. These additional peaks could not be assigned by NMR as their 3D HNCACB intensities were too low.
The minor peak at 8.92 δ 1H, 119.3 δ 15N, however, was too weak to be observed in the triple resonance spectrum. The Erk-pTY sample shows a major peak at the same position as this minor peak in Erk-pTpY (Figure 5A, insets 2, 3). Differences in pH and in salt concentration between the samples can cause peak positions to move. This is especially so for the pT resonance (Supplementary Figure 5). We therefore mixed equal amounts of the Erk-pTpY and Erk-pTY samples. The resulting HSQC spectrum shows two peaks of similar intensity at the respective positions of the major peaks in the two individual samples (Supplementary Figure 6). This indicates that the major peak in the Erk-pTpY spectrum corresponds to pT in the pTpY phospho-form—that is, to pT(EpY), where the immediate amino-acid context is given in parentheses—while the minor peak in the Erk-pTpY spectrum and the major peak in the Erk-pTY spectrum correspond to pT in the pTY phospho-form—that is, to pT(EY). The pT chemical shift senses the phosphorylation state of the +2 Y-residue.
We found that two other resonances were sensitive to the TEY phosphorylation state and could be exploited to measure pTpY (Figure 6A and Supplementary Method 1.1). While the pT resonances are found outside the crowded central region in Figure 5A, the pY resonances are not, nor do they shift with changes in pH or salt concentration (Supplementary Figure 7). The spectrum of the synthetic TpY peptide, when compared with that of Erk-TpY shows no peak that is sufficiently isolated for reliable integration, making quantification of TpY difficult. Similarly, no peak was found that unambiguously represents TY .
Figure 6.

NMR analysis and four-site phospho-form distribution. (A) Phospho-form distributions of each of the four Erk samples obtained by NMR. The pTpY phospho-form was determined from three resonances, as tabulated below with their normalised peak integral values. The additional A and T resonances could not be fully confirmed in the Erk-TY and Erk-TpY samples without 3D spectra and were therefore not measured, as indicated by a dash. The pTY phospho-form was determined by the single resonance pT(EY), as also tabulated. The TY and TpY phospho-forms were not detectable, indicated by the asterisks in the distributions. The bars show either a single data point or the mean±s.d. Measurements agree to within 10% with those found by pepMS (Figure 2B). (B) The four-site phospho-form distribution of Erk-pTpY. The 16 phospho-forms are listed horizontally, in the form (p)S(p)S(p)T(p)Y, with their corresponding proportions denoted by a1,L,a16. These values were calculated by combining information from pepMS and proMS for both Erk-pTpY and Erk-pTY, as explained in Supplementary Method 1.2. Grey columns indicate phospho-forms whose individual proportions can be determined or placed between upper and lower bounds. The dashed columns and the columns with a dotted outline indicate two sets of phospho-forms whose individual values could not be determined, but whose sums were limited as shown in the equations. The asterisks mark the phospho-forms on which most of the distribution is concentrated, whose relevance is discussed in the text.
Quantification requires an estimate of the total amount of sample. The (G)Y residue at the C terminal of Erk could be assigned (Figure 5A, Supplementary Figure 8). This peak is unaffected by tryptic cleavage efficiency and its intensity is also unaffected by small pH variations over the range used (6.5–7.5). It therefore provides a measurement that can be used for normalisation. The partial phospho-form distributions in Figure 6A are averages in which each of the resonances identified above has been quantified by the corresponding peak integral divided by the (G)Y peak integral. The three different NMR measurements of pTpY agree to within 4% in both Erk-pTpY and Erk-pTY. The NMR measurements for pTpY and TpY agree with those obtained by pepMS to within 10%.
Two other peaks found in the Erk-pTpY spectrum in the region above 8.8 p.p.m. δ 1H also show strong pH dependence (Figure 5B, arrows). As these were present in Erk-pTY but absent in both Erk-TY and Erk-TpY and were also absent in the spectra of all the synthetic phospho-peptides, they correspond to at least two pS or pT modifications on a tryptic peptide other than that containing the TEY motif. This was the first indication of additional phosphorylations and illustrates the unbiased coverage of Erk by NMR as compared to pepMS, despite both methods using peptide digests.
Extended phospho-site mapping
The additional phosphorylations are found on Erk-pTpY. ProMS shows that they are retained after treatment with a pY phosphatase, to form Erk-pTY, but not after treatment with a pS/pT phosphatase, to form Erk-TpY (Figure 4B). This accords with the NMR findings that the new modifications are on S/T, of which there are 32 sites in His6-tagged Xenopus Erk2. In contrast to pY, pS and pT may lose their phosphate moiety upon fragmentation by CID. We therefore re-evaluated Erk-pTpY by MS, using either neutral loss of phosphoric acid after MS2 to trigger MS3 or an alternative MS3 strategy known as multistage activation (MSA; Ulintz et al, 2009). The two additional sites were both localised to the N-terminal tryptic peptide containing the His6 tag (Du et al, 2005; Figure 1A). Monophosphorylated pS9 and diphosphorylated pS9pS15 (counting from after the initial M, which is cleaved) were the two significant phospho-forms. S9 is on the tag, while S15 is found in Xenopus but not in human Erk2.
Although the new phospho-peptides were not quantified by AQUA, considerable information about the 16=24 phospho-forms on Erk-pTpY can be extracted by combining proMS and pepMS data along with the effect of the tyrosine phosphatase (Supplementary Method 1.2). For instance, within the margin of measurement error, Y is always phosphorylated in each phospho-form present in Erk-pTpY (Figure 6B). Furthermore, most of the distribution is concentrated on those phospho-forms, in which both pT and pY are present.
This provides novel insights into the phosphorylation mechanism. As Erk-TY does not have the new modifications, they must arise in Erk-pTpY during in vitro biochemistry rather than in vivo recombinant protein production (Du et al, 2005). Of the two kinases present during preparation of Erk-pTpY, Mek is a dual-specificity kinase, whose only in vivo targets are believed to be MAP kinases, while Erk is a S/T kinase with multiple substrates. Suspicion falls more on the latter as the source of the new modifications. If an activated Erk molecule phosphorylated the N-terminal tail of another molecule in trans, the resulting S-phosphorylations would not be correlated with the TEY phosphorylations on that same molecule. Nor would this be expected if Mek were the kinase. On the other hand, if the activated Erk molecule phosphorylated its own N-terminal tail in cis, the S-phosphorylations would only occur in the presence of pT and pY. The phospho-form distribution in Figure 6B is more consistent with the latter scenario than the former, suggesting that the additional modifications arise from intra-molecular phosphorylation by Erk in cis. We see that the phospho-form distribution can reveal information about the enzymatic mechanisms that gave rise to it.
Discussion
In the absence of a recognised gold standard, we do not know a priori the phospho-form distributions of any of the four samples. The data obtained from pepMS, proMS and NMR are in excellent agreement, but those from western blotting show significant discrepancies with these data. It seems reasonable to consider MS as the most accurate and broadly usable method for estimating phospho-form distributions.
The discrepancies between western blots and MS are troubling. The antibodies against the singly phosphorylated phospho-forms, anti-pTY and anti-TpY are generally regarded as poor, as suggested by their reduced linearity (Figure 1C). However, the anti-pTpY antibody is considered a good antibody that has been widely used to detect Erk activation. We discuss here some potential explanations for the discrepancies.
The titration data (Figure 1C, Supplementary Figure 1) suggests that the intensity versus amount relationship for each antibody takes the form of a power law, y=Axα, where x is the amount of sample and y is the measured fluorescence intensity. Several caveats are in order. First, the amount of phospho-form against which the antibody is targeted may be substantially smaller than the amount of sample. There is still a power law between the phospho-form amount and the intensity with a different pre-factor, A, but the same exponent, α. However, the antibody may be used when the amount of phospho-form lies outside the range over which the sample titrations were undertaken. This range was determined in part by the dilution required for multiplexed antibodies in the LI-COR system. The measured exponent may change with different sample ranges, so the values in Figure 1C must be interpreted cautiously. Finally, a power law may not be an accurate description of the amount/intensity relationships for the anti-pTY and anti-TpY antibodies, as their R2-values are not high. Despite these issues, it is instructive to analyse the measurement process assuming a power law, y=Axα, relating phospho-form amount, x, to fluorescence intensity, y, for each antibody.
Suppose that samples 1 and 2 have total amounts T1 and T2 of Erk, respectively, and that P1 and P2 are the respective amounts of a particular phospho-form of Erk. Our concern is with the proportions of phospho-forms in each sample, so suppose that the proportion is greater in the second sample,
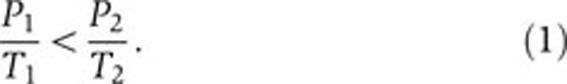 |
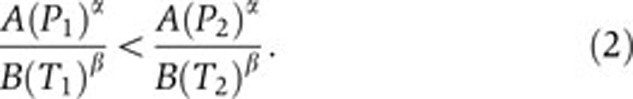
(To keep control of the signs below, we will also assume that the second sample is larger, so that T2>T1). If the phospho-specific antibody has the power law, y=Axα, and the anti-total Erk antibody has the power law, y=Bxβ, then the normalised measure of a sample will be (APα)/(BTβ). It is tacitly assumed here that amount/intensity relationship is context independent, so that it continues to hold no matter in which context the phospho-form is found. We take this for granted for the present, but will return to it below.
We assume that the measured values of the two samples satisfy
 |
The antibody will be semi-quantitative when Equation (2) implies Equation (1). We want to understand the conditions under which this occurs.
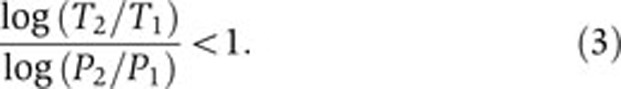
The term A/B can be cancelled from both sides of Equation (2) and these pre-factors have no further role in the analysis. Rearranging the terms in Equation and taking logarithms, we find the equivalent expression,
 |
Doing the same for Equation (2), we find,
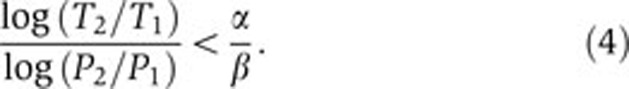 |
Comparing Equations (3) and (4), we see that if α⩽β, so that α/β⩽1, then Equation (4) implies Equation (3). The normalised measure is therefore semi-quantitative. However, if α>β, so that α/β>1, then the normalised measure may become inconsistent with Equation (1), depending on the amounts of the totals and the phospho-forms. It could sometimes be consistent and sometimes not, depending on the samples being measured. For instance, if α=0.9, β=0.5 and T1=1000, T2=1100, P1=500, P2=535, then the measured value of sample 1, (P1)α/(T1)β=8.49, is less than the measured value of sample 2, (P2)α/(T2)β=8.60, but the phospho-form proportion in sample 1, P1/T1=0.5, is greater than the proportion in sample 2, P2/T2=0.486. If the amount of phospho-form in sample 2 is increased to P2=540, then consistency is recovered.
According to Figure 1C, the anti-total Erk antibody has an exponent, β=0.94. The anti-TY antibody has a larger exponent, α=0.99, so on the basis of this analysis, it may not give a semi-quantitative measure. Indeed, that was the case with the data from both sets of samples. All the other phospho-specific antibodies have smaller exponents than β=0.94 and the analysis above suggests that they should be semi-quantitative. However, this is not what we found. All the antibodies show departures from semi-quantitative behaviour on one or the other, or both, sets of samples, including the widely used anti-pTpY antibody. This cannot be accounted for by the analysis above.
This analysis was based on a key assumption, that the intensity versus amount relationship depended only on the amount of epitope present and not on its context. This relationship is determined by titration of the same sample. The comparisons made here are against different samples that may not only differ in the amount of target phospho-epitope but also in the amounts of the other phospho-epitopes, against which the antibody may have a range of cross-reactivities. Protein epitopes are tertiary structures that may not be contiguous in the protein's primary sequence, and their shape may be influenced by structural changes outside the epitope region. Molecular recognition between antibody and antigen has therefore been considered an emergent property of the biological context (Regenmortel, 2009). Our assumption of context independence may be too strong and context dependency could potentially underlie the surprising discrepancies found for all the phospho-specific antibodies. Antibodies are unrivalled for their sensitivity and ability to detect proteins in complex backgrounds, but this may come at the expense of quantitative accuracy.
MS has emerged as the method of choice for measuring phospho-form distributions. However, tradeoffs must still be made to extract the most information. MS relies on chromatographic separation followed by separation according to m/z. The key difficulty is to separate positional isomers. For both separation modes, protein size is the crucial factor: the smaller the polypeptide, the better the separation. Proteolytic digestion may reduce polypeptide size, but if that places sites of interest on different fragments, the correlation between the separated sites is irretrievably lost. A ‘middle-down’ approach, using proteases such as ArgC or LysN, which yield larger peptides than trypsin, may result in a better tradeoff between site coverage and polypeptide size.
If the polypeptide is short enough, positional isomers may be separated by chromatographic elution time and pepMS (Figure 2A). This is not limited to mixed situations with both S/T and Y phosphorylations, as here, but works equally well for S/T phosphorylations alone (Steen et al, 2005a). Hydrophilic interaction chromatography is a related method that can be readily coupled to MS and which also provides an orthogonal separation dimension to m/z (Young et al, 2009).
Longer polypeptides can only be separated by multistage fragmentation, after either pepMS or proMS. A variety of multistage strategies are now available that have lessened concern for such issues as neutral loss of phosphorylation (Timm et al, 2010), although problems can still occur when several adjacent S/T residues are encountered.
Unlike proteolytic digestion, gas-phase fragmentation yields fragment ‘ladders’ that may retain correlations between remote sites. To what extent this information can be used to resolve all 2n phospho-forms has yet to be fully determined (Pesavento et al, 2006). However, considerable empirical success has been achieved for polypeptides below 20 kDa using tandem MS (Pesavento et al, 2008, 2008). These approaches rely on dissociation by electron capture (ECD) in FT-ICR spectrometers or by electron transfer (ETD) in ion traps. ECD and ETD break backbone bonds more uniformly than CID. The latter method may also remove the very modifications that are being sought for, as occurs with neutral loss of phosphorylation. As the polypeptide size increases beyond 20 kDa, the problem of limited fragmentation arises, as exhibited by Erk, and this compromises the resolution of positional isomers. Specialised techniques of ‘prefolding dissociation’ give improved fragmentation of proteins up to 200 kDa (Han et al, 2006), but we know of no studies that have resolved positional isomers by multistage MS on proteins of similar size to Erk. While fragmentation may improve resolution of positional isomers, it may adversely affect their quantification, particularly if multiple stages of MS are required. Increasing polypeptide size does bring one advantage: proMS does not need internal standards but still agrees closely with AQUA pepMS.
As mentioned above, separating positional isomers remains the key problem in quantifying phospho-form distributions by MS. We are currently working on new and improved separation strategies, such as ultra-performance liquid chromatography (Winter et al, 2009) and ion mobility separation (Shvartsburg et al, 2010).
NMR is a complementary method that shows excellent quantitative consistency with MS. The measurements were carried out at different sites with widely different instrumentation, yet agree to within 10%, providing strong support for MS as the gold standard for accurate estimation of phospho-form distributions. NMR has inherent limitations. If phospho-sites are 1 to 3 residues apart, resonances may be found that characterise particular local patterns, as with pTY and pTpY in Erk (Figure 5A). However, global patterns arising from correlations between sites further apart are not readily detected, nor can pY resonances be easily found. Sample requirements and acquisition times, both of which are substantial, are also a barrier to widespread use. The need to denature or digest samples may limit some applications, but considerable success has been achieved with smaller or intrinsically disordered proteins (Landrieu et al, 2006). NMR does offer the attractive possibility of obtaining quantitative information from time-resolved measurements in cells or cell extracts (Landrieu et al, 2006; Selenko et al, 2008), and can detect multiple types of modifications simultaneously (Liokatis et al, 2010).
NMR played a key role in this study by providing the first evidence for additional phosphorylations (Figure 5B). It has the great advantage of being unbiased, as does proMS, despite using a peptide digest. Modifications on unexpected peptides may be readily missed in pepMS data, while antibodies require sites to have been previously identified.
Our results suggest that the most appropriate protocol for multiply phosphorylated cellular proteins such as Erk, is, first, to undertake proMS on the intact protein to determine the distribution of isobaric groups (Figure 4). This has the important advantages of unbiased coverage that may reveal unexpected modifications, as well as providing accurate quantification without the need for internal standards. Second, to obtain by proteolytic digestion the smallest peptides that contain as many as possible of the interesting sites. Third, to undertake pepMS on these peptides to yield more detailed information on their particular clusters of sites. For accurate quantification, this may require as many internal standards as phospho-forms of interest. Finally, comparisons between pepMS and proMS data, together with use of specific phosphatases that reduce phospho-form complexity, may be able to constrain the relative amounts of many of the phospho-protein forms, as demonstrated in Figure 6B.
Measuring phospho-form distributions remains a challenging problem, but quantitative information is now becoming accessible for proteins such as Erk that are commonly encountered in cellular physiology.
Materials and methods
15N-labelled Erk
N-terminal His6-tagged p42 MAP kinase (Erk2) from Xenopus laevis, expressed on a pT-T7 plasmid (gift from Jim Ferrell), was 15N-labelled to enable 2D NMR and purified as follows. One gram of 15NH4Cl (Cambridge Isotope, #NLM-467-5), 20 ml of 20% glucose, 1 ml of 1 M MgSO4, 100 μl of 1 M CaCl2, 1 ml of 150 mg/ml ampicillin and 10 ml of 100 × MEM Vitamins (Sigma, #M6895) were added to the appropriate amount of M9 salt solution to make 1 litre of 15N-labelled minimal media, which was subsequently autoclaved. A quantity of 25 ml of E. coli bacterial culture (grown overnight in LB broth with ampicillin) was added to 1 litre of freshly prepared 15N-labelled minimal media and incubated with shaking at 37°C for at least 5 h. The culture was induced at an optimal OD600 of 0.5–0.7 with 400 μl of 1 M IPTG (to a final concentration of 0.4 mM IPTG) and incubated for a further 3 h at 30°C. The cells were harvested by spinning at 5000 r.p.m. for 15 min at 4°C, washed 2 × with PBS, snap-frozen in liquid nitrogen and stored at −80°C. Later, the pellet was resuspended in 50 ml of binding buffer (50 mM NaH2PO4, 0.5 M NaCl, 2 ml of 10% NP40, 10 ml of 10 mg/ml lysozyme and 20 mM imidazole, pH 8.0), incubated on ice for 10 min, snap-frozen in liquid nitrogen and stored at −20°C for 1 h. The pellet was then thawed in a water bath at 30°C and 500 μl of 100 mM PMSF (final 1 mM), 1 EDTA-free protease inhibitor cocktail tablet (Roche, #11873580001) and 5 EDTA-free phosphatase inhibitor tablets (Roche, #04906837001) were added. The cell suspension was sonicated at 50% duty cycle, 3 × for 30 s pulses, with 30–60 s on ice between pulses. The lysate was centrifuged at 15 000 g for 20 min at 4°C. The supernatant was transferred to 50 ml falcon tubes and 2-ml bed volume of Ni/NTA beads (4 ml of 50% slurry washed with binding buffer) were added and incubated on a rotator for 2 h at 4°C. The bead-lysate mixture was loaded on a 1 cm diameter column and washed 5 × with 10 ml wash buffer (50 mM NaH2PO4, 0.5 M NaCl and 20 mM imidazole, pH 8.0). Erk protein was eluted with elution buffer (50 mM NaH2PO4, 0.5 M NaCl and 250 mM imidazole, pH 8.0) and dialysed with storage buffer (50 mM Tris–HCl, 150 mM NaCl, 0.1 mM EGTA, 0.03% Brij-35, 50% glycerol, 1 mM benzamidine, 0.2 mM PMSF, 0.1% 2-β-mercaptoethanol, pH 7.5) and stored at −80°C. 13C, 15N-labelled Erk2 for 3D NMR was similarly prepared using Sigma #G5146 and Cambridge Isotope #NLM-467-5.
Erk samples in four phosphorylation states
The main set of isotopically labelled samples for Figures 1, 2, 4, 5 and 6 was prepared as follows. 15N-labelled Erk prepared as above was taken as Erk-TY. Other phosphorylation states were constructed as follows: 30 ml of prepared Erk (approximately 0.66 mg/ml) was first dialysed against 4 l of kinase reaction buffer (10 mM HEPES, 20 mM Mg(OAc)2, 100 mM NaCl and 2 mM DTT, pH 7.4) and 40 μg of GST-tagged activated Mek1 (Millipore, #14–429), and ATP to a final concentration of 1 mM were added and incubated overnight at 30°C with constant shaking. ATP was then removed by passing through a disposable PD-10 Desalting Column (GE, #17-0851-01) as per instructions; Mek1 was removed by adding GST beads and incubating at 4°C for 60 min with rotation. The mixture was then centrifuged at 500 g for 5 min at 4°C and the supernatant passed through PD-10 columns, separated into three fractions, each of ∼4 mg protein, and stored on ice. One fraction was taken as Erk-pTpY. A second fraction was dephosphorylated with 2 × 10 U vials of PP2A (Millipore, #14-111) for 3 h and taken as Erk-TpY. The third fraction was dephosphorylated with 2 × 200 U vials of T-cell PTP (New England BioLabs, #P0752S) for 3 h and taken as Erk-pTY. Some sample was lost owing to precipitation during the phosphatase reactions. All three phosphorylated samples were further purified to remove phosphatase by adding 800 μl bed volume of washed Ni/NTA agarose beads and shaking at 4°C for 40 min and were then column eluted into fractions of 2 ml each. Finally, all four samples were dialysed in storage buffer (above) and stored at −80°C. For further analysis, sample amounts were calibrated by Coomassie gel staining against a BSA dilution series. The 13C, 15N-labelled Erk2 for 3D NMR was only prepared as Erk-pTpY.
The second set of non-isotopically labelled samples for Figure 3 was prepared as follows: His6-tagged Erk2 expressed on a pT-T7 plasmid was grown, as above, but without isotope labelling and purified, as above, to give Erk-TY. A different plasmid, incorporating constitutively active Mek1 (Mek1R4F) upstream of His6-tagged Erk2, with an intermediate IRES site and an ampicillin selection marker, was obtained as a gift from Melanie Cobb. This was used to generate Erk phosphorylated in vivo, following a protocol from the Cobb laboratory. A quntity of 25 ml of plasmid-transformed E. coli culture (grown overnight with LB broth and ampicillin) was added to 1 litre of LB with 100 μg/ml ampicillin, shaken at 30°C to an OD600 of 0.3–0.4, induced with IPTG to a final concentration of 0.3 mM and grown overnight with shaking at 30°C. Cells were harvested by spinning at 4000 r.p.m. for 10 min at 4°C and then purified as described above. Washing removes untagged Mek1, leaving bacterially phosphorylated Erk, which was taken as Erk-pTpY. Erk-TpY and Erk-pTY were prepared as above, but with only 1 × 10 U vials of PP2A and 1 × 200 U of T-cell PTP, respectively.
Antibody analysis
Dilution series for each of the five antibodies in Figure 1C were obtained using the Erk-X sample with the anti-X antibody (and Erk-TY with anti-total Erk) over a sample range from 20 to 900 pg (Supplementary Figure 1). Western blots were obtained as described below and log-fluorescence intensity was plotted against log protein amount. The data were regressed onto a straight line with R2 giving the square of the Pearson's correlation coefficient. A straight line in a log–log plot corresponds to a power law, y=Axα between fluorescence intensity, y, and sample amount x. If α≈1, this implies a linear, proportional relationship, so that k times the intensity corresponds, approximately, to k times the sample amount, as required for a good quantitative measurement. For the western blots, 1 μg of each of the four ERK samples in sample buffer (Invitrogen, #NP007) were heated at 70°C for 10 min, and 100 pg/well of each sample was loaded in triplicate on a 15-well 12% 29:1 SDS–PAGE gel. Following PAGE, proteins were transferred onto PVDF membranes (Invitrogen) for 1 h, incubated with blocking buffer (LI-COR Biosciences, #927–40 000) for 60 min at room temperature and then incubated with phospho-specific mouse anti-X antibody at 1:2000 and rabbit anti-total Erk at 1:5000 overnight at 4°C (antibodies are listed in Figure 1C). Three replicate gels were run for each antibody. Membranes were washed 4 × with PBS and incubated with IRDye 800CW goat anti-mouse IgG (LI-COR, #926-32210) at 1:10 000 and IRDye 680 goat anti-rabbit IgG (LI-COR #926-32221) at 1:10 000 for 1 h at room temperature in the dark. Finally, membranes were washed 4 × with PBS and scanned with the Odyssey Infrared Imager (LI-COR) at 169 μm resolution, medium quality, intensity level 3 for both 700 and 800 channels. Bands were quantified with Odyssey Software (v2.1, LI-COR). Each band was 5 × zoomed, manually outlined and default background correction settings (median, border width 2, top-down) used to determine the integrated intensity. The intensity ratio of the two channels (800/700) was plotted using GraphPad Prism v4.
For the second set of non-isotopically labelled samples, one set of gels was loaded with 250 pg/well of each sample (Figure 3B), while a second set of gels was loaded with 250 pg/well of each sample spiked with 10 μg of whole-cell lysate (Millipore, #12-305; Figure 3C). Both sets were analysed as above. For chemiluminescence (Supplementary Figure 4), PAGE was carried out as just described on two sets of the four Erk samples, one with and one without whole-cell lysate. After blocking, PVDF membranes were first incubated with rabbit anti-total ERK antibody, as described above. Membranes were washed 4 × with PBS and incubated with HRP-linked donkey anti-rabbit IgG (GE Healthcare, NA934) for 2 h at room temperature, washed again 4 × with PBS, sprayed with RapidStep ECL Reagent (CalBiochem, 345818), incubated for 5 min in the dark and exposed in chemiluminescent mode in a Alpha Innotech CCD imager. All blots were exposed together, so that explosure parameters were identical. For stripping and re-probing, 25 ml of 1 × Western-Re-Probe reagent (Calbiochem, WB59) was added and incubated at room temperature for 30 min with shaking. The membranes were washed 3 × with PBST (0.1% Tween-20), for 5 min each time, and blocked with blocking buffer for 1 h. RapidStep ECL Reagent was sprayed and exposed to check removal of the first antibody. The membranes were washed with PBS and blocking buffer for 30 min, and phospho-specific mouse anti-X antibody was added in 1:2000 dilution and incubated with shaking at 4°C. The membranes were washed again 4 × with PBS, incubated with HRP-linked sheep anti-mouse IgG (GE Healthcare, NXA931) for 2 h, washed 4 × with PBS and analysed as described above. Images were quantified using ImageJ, with no background correction.
Peptide-based LC/MS
Synthetic phospho-peptide internal standards, corresponding to the four tryptic phospho-peptides of Erk containing the TEY motif, with C-terminal arginines fully labelled with 13C and 15N were purchased from Sigma at 96% purity. Stock solutions were prepared for each peptide and concentrations determined by amino-acid analysis (Molecular Biology Core Facility, Dana Farber Cancer Institute). For pepMS, 1 μg of Erk sample in sample buffer was loaded on a 12% 29:1 SDS–PAGE gel, washed with water and stained with SimplyBlue (Invitrogen). A blank lane was used for background correction. The bands corresponding to Erk were excised, washed with 100 mM ammonium bicarbonate (ABC) buffer and acetonitrile (Burdick and Jackson), reduced with 10 mM DTT at 56°C for 45 min and then alkylated with 50 mM iodoacetamide in the dark for 30 min. After washing with ABC and acetonitrile (2:1 mixture) for 15 min 3 × and then 5 min shrinking with acetonitrile, 12 ng/μl of sequencing-grade modified trypsin (Promega #V5111) was added and the mixture left on ice for 1 h. A quantity of 500 fmol of each of the internal standards was added and the mixture incubated at 37°C for 18 h. The digested tryptic peptides were extracted with ABC buffer. After drying in a speed vac, the sample was reconstituted in 20 μl of 5% formic acid, 5% acetonitrile and 50 mM citrate in water. Aliquots of 5 μl were analysed by LC/MS. The LC/MS system comprised a microautosampler, a nanoLC-2D nanoflow HPLC pump (both from Eksigent) and a LTQ XL-Orbitrap high-accuracy/resolution mass spectrometer (Thermo Scientific). A 100 μm ID PicoTip Emitter column (New Objective) was packed in-house using 5 μm, 10 nm pore size Magic C18 beads (Michrom BioResources). A 30 min gradient (95–65%A, 5–35%B), where A=0.2% formic aid in water and B=0.2% formic acid in acetonitrile was utilised. Six targeted full-scan windows ±2.5 m/z were sequentially scanned for each of the non-, mono- and di-phosphorylated peptides and corresponding internal standards. A low-resolution setting of 7.5 k FWHM maximised data points across the chromatographic peak while still allowing high-mass accuracy and isotope discrimination. Peak-area integration of extracted ion chromatograms (±0.17 m/z of the most abundant isotope), blank correction and calculation of sample/internal standard ratios were programmed in Xcalibur (Thermo Scientific). A standard curve showed excellent linearity and provided a loading range (Supplementary Figure 9). Values were sum normalised to yield the phospho-form distribution (Figure 2B) by the following argument. If ai is the amount of phospho-peptide i entering MS, then the corresponding detected peak area, pi, is expected to be proportional, pi=εiai, where εi is a phospho-form-dependent measure of ionisation and detection efficiency (Steen et al, 2005b). The amount of internal standard, ais, is expected to fly with identical efficiency, so that pis=εiais. Hence, pi/pis=ai/ais, which is efficiency independent. Assuming the same amount of internal standard is used for each of the four phospho-peptides, so that ais is independent of i, sum normalisation of the peak area ratios, (pi} /pis)/∑i (pi /pis) = ai /∑i ai, gives the relative amount of each phospho-peptide present. We found substantial lane-to-lane variation in in-gel digestion efficiency, which, together with loading variations, were corrected by sum normalisation.
Protein-based LC/MS
The four ERK samples containing 0.03% Brij-35 were buffer exchanged by dilution below the CMC of Brij-35 and then applied to a 30 kDa spin filter (Millipore). After the initial spin, the samples were washed 2 × with water and then with 0.25% formic acid. The retentate was reduced with TCEP, which significantly reduced the complexity of the sample. A volume of 5 μl of the retentate was injected for LC/MS analysis. Reversed-phase LC was performed as for pepMS, but with 5 μm, 30 nm pore size Magic C18 beads and a 60 min gradient of (5–55%B), where A=1% formic acid in water and B=1% formic acid in isopropanol. MS was performed on a QSTAR XL (Applied Biosystems) using a m/z window of 600–2000. All the spectra across the chromatographic peak were summed, charge-state deconvoluted in BioAnalyst and the neutral mass spectrum was then smoothed and centroided. The phospho-form peaks were identified by comparison with masses calculated for 15N-labelled, His6-tagged Erk2 (Figure 4B) and then sum normalised (Figure 4C).
Extended phospho-site mapping
Tryptic peptides from Erk-pTpY were obtained and LC was undertaken as described above, but with an increased gradient time of 60 min. Two different data-dependent MSn strategies were used. The six most intense peptides with charge state z⩾2 were fragmented. One strategy triggered MS3 on product ions showing neutral loss of phosphoric acid (DDNLMS3); the other used MSA in response to the same neutral losses. The peptide identifications were then searched for in Mascot (Matrix Science) and Protein Pilot v3.0 (Applied Biosystems). The highest-scoring hits were obtained with MSA (Ulintz et al, 2009). The two new phosphorylations were localised to the N-terminal tryptic peptide containing the His6 tag, (AHHHHHHASAAAAASSNPGGPEMVR), after cleavage of the N-terminal M, in the form of monophosphorylated pS9 (Mascot score 56) and diphosphorylated pS9pS15 (Mascot score 39). Additional oxidised forms of the peptide were consistent with the NMR data, which showed more than two non-TEY phospho-peptides.
NMR
The Erk samples were kept at −20°C in HEPES buffer containing 25% glycerol. They were concentrated by ultra filtration with a Vivaspin 2 (GE Healthcare) at a MWCO of 10 kDa, before buffer exchange on a NAP-10 desalting column (GE Healthcare) against 50 mM ABC buffer with 50 mM NaCl. The proteins were then at a concentration estimated at 1 mg/ml and basic pH suitable for tryptic digestion. Trypsin (Sigma) was resuspended in 1 mM HCl and added to the samples at 1/50 W/W. Digestion was performed at 37°C overnight. The digested proteins were lyophilised. The dried powder was solubilised in 250 μl of NMR buffer (NaPi 25 mM, 1 mM DTT, pH 6.8), with 5% D2O and TMSP as reference. Final concentrations were 45 μM for Erk-pTY, 20 μM for Erk-TpY and 30 μM for Erk-pTpY. NMR experiments were performed at 20°C on a Bruker 600 MHz Avance II spectrometer (Bruker Biospin, Wissembourg, France), equipped with a cryogenic probehead. HSQC experiments were recorded with a sensitivity enhanced pulse sequence (Palmer et al, 1991) as a complex matrix of 1024 × 128 complex points, for 16 × 36 p.p.m. spectral widths in the proton and nitrogen dimensions, respectively. Spectra were transformed after zero filling to 4 × 1 k points and multiplication with a shifted sine bell function. The HNCACB spectrum in Figure 5A, inset 1 was recorded with a standard Bruker pulse sequence (Muhandiram and Kay, 1994), with 1024 × 41 × 75 complex points for the 1H, 13C, 15N dimensions, respectively. The number of scans per increment was 32, leading to a total measuring time of 5 days and 12 h. The spectrum was transformed to 1k × 512 × 512 points, after multiplication with a squared sine bell window function. Processing was performed in the Bruker Topspin software, whereas analysis and integration was done with in-house software. Using the sequence Ac-VADPDHDHTGFL-(p)T-E-(p)Y-VATR-NH2, synthetic phospho-peptides corresponding to the four Erk phospho-forms were synthesised using the Fmoc protocol (NeoMPS, Strasbourg, France) and purified to homogeneity (>95%) by HPLC. NMR samples contained 5 mM of peptide under the same conditions of salt and pH as the tryptic mixture. Although the 15N-labelling on Erk could not be easily included on the phospho-peptides with the Fmoc protocol, HSQC spectra were recorded from the 0.37% naturally occurring 15N over 12 h. Homonuclear TOCSY and NOESY spectra were used to completely assign the spectra of all the synthetic phospho-peptides.
Supplementary Material
Acknowledgments
We thank Ruchi Chauhan for help in preparing samples and Jonathan Cooper, Marc Kirschner, Bernhard Küster, Juri Rappsilber and Philipp Selenko for helpful comments on the draft. We thank the anonymous reviewers for several helpful suggestions. SP, HS and JG were supported by NIH under grant R01-GM081578. RAE was supported on NRSA T32 training grant HL076115. IL, J-MW and GL acknowledge support from the TGE RMN THC (FR-3050, France).
Author Contributions: SP undertook sample preparation, biochemistry, western blotting and preliminary AQUA peptide-based MS. SP also coordinated the data preparation. RAE undertook pepMS, proMS and extended phospho-site mapping. IL and J-MW undertook the NMR spectroscopy and GL analysed the data. SP, GL, HS and JG jointly designed the research and GL, HS and JG supervised the execution of the experiments. JG undertook data analysis and wrote the paper.
Footnotes
The authors declare that they have no conflict of interest.
References
- Baker CL, Kettenbach AN, Loros JJ, Gerber SA, Dunlap JC (2009) Quantitative proteomics reveals a dynamic interactome and phase-specific phosphorylation in the Neurospora circadian clock. Cell 34: 354–363 [DOI] [PMC free article] [PubMed] [Google Scholar]
- Bienkiewicz EA, Lumb KJ (1999) Random coli chemical shifts of phosphorylated amino acids. J Biomol NMR 15: 203–206 [DOI] [PubMed] [Google Scholar]
- Breuker K, Jin M, Han X, Jiang H, McLafferty FW (2008) Top-down identification and characterization of biomolecules by mass spectrometry. J Am Soc Mass Spectrom 19: 1045–1053 [DOI] [PMC free article] [PubMed] [Google Scholar]
- Cha H, Shapiro P (2001) Tyrosine-phosphorylated extracellular signal-regulated kinase associates with the golgi complex during G2/M phase of the cell cycle: evidence for regulation of Golgi structure. J Cell Biol 153: 1355–1367 [DOI] [PMC free article] [PubMed] [Google Scholar]
- Cohen P (2000) The regulation of protein function by multisite phosphorylation - a 25 year update. Trends Biochem Sci 25: 596–601 [DOI] [PubMed] [Google Scholar]
- Cohen P (2001) The role of reversible protein phosphorylation in health and disease. Eur J Biochem 268: 5001–5010 [DOI] [PubMed] [Google Scholar]
- Du P, Loulakis P, Luo C, Mistry A, Simons SP, LeMotte PK, Rajamohan F, Rafidi K, Coleman KG, Geoghegan KF, Xie Z (2005) Phosphorylation of serine residues in histidine-tag sequences attached to recombinant protein kinases: a cause of heterogeneity in mass and complications in function. Protein Expr Purif 44: 121–129 [DOI] [PubMed] [Google Scholar]
- Grangeasse C, Cozzone AJ, Deutscher J, Mijakovic I (2007) Tyrosine phoshporylation: an emerging regulatory device of bacterial physiology. Trends Biochem Sci 32: 86–94 [DOI] [PubMed] [Google Scholar]
- Han X, Jin M, Breuker K, McLafferty FW (2006) Extending top-down mass-spectrometry to proteins with masses greater than 200 kilodaltons. Science 314: 109–112 [DOI] [PubMed] [Google Scholar]
- Holmberg CI, Tran SEF, Eriksson JE, Sistonen L (2002) Multisite phosphorylation provides sophisticated regulation of transcription factors. Trends Biochem Sci 27: 619–627 [DOI] [PubMed] [Google Scholar]
- Hunter T (2007) The age of crosstalk: phosphorylation, ubiquitination and beyond. Mol Cell 28: 730–738 [DOI] [PubMed] [Google Scholar]
- Kim J, Petritis K, Shen Y DGC II, Moore RJ, Smith RD (2007) Phosphopeptide elution times in reversed-phase liquid chromatography. J Chromatogr A 1172: 9–18 [DOI] [PMC free article] [PubMed] [Google Scholar]
- Kirkpatrick DS, Gerber SA, Gygi SP (2005) The absolute quantification strategy: a general procedure for the quantification of proteins and post-translational modifications. Methods 35: 265–273 [DOI] [PubMed] [Google Scholar]
- Landrieu I, Lacosse L, Leroy A, Wieruszeski JM, Trivelli X, Sillen A, Sibille N, Schwalbe H, Saxena K, Langer T, Lippens G (2006) NMR analysis of a tau phosphorylation pattern. J Am Chem Soc 128: 3575–3583 [DOI] [PubMed] [Google Scholar]
- Lewis TS, Shapiro PS, Ahn NG (1998) Signal transduction through MAP kinase cascades. Adv Cancer Res 74: 49–139 [DOI] [PubMed] [Google Scholar]
- Liokatis S, Dose A, Schwarzer D, Selenko P (2010) Simultaneous detection of protein phosphorylation and acetylation by high-resolution NMR spectroscopy. J Am Chem Soc 132: 14704–14705 [DOI] [PubMed] [Google Scholar]
- Marks F (1996) Protein Phosphorylation. Weinheim: Wiley VCH, Federal Republic of Germany [Google Scholar]
- Mollica JP, Oakhill JS, Lamb GD, Murphy RM (2009) Are genuine changes in protein expression being overlooked? Reassessing Western blotting. Anal Biochem 386: 270–275 [DOI] [PubMed] [Google Scholar]
- Muhandiram DR, Kay LE (1994) Gradient-enhanced triple-resonance three-dimensional NMR experiments with improved sensitivity. J Magn Reson 103: 203–216 [Google Scholar]
- Palmer AG III, Cavanagh J, Wright PE, Rance M (1991) Sensitivity improvement in proton-detected two-dimensional heteronuclear correlation NMR spectroscopy. J Magn Reson 93: 151–170 [Google Scholar]
- Park KS, Mohapatra DP, Misonou H, Trimmer JS (2006) Graded regulation of the Kv2.1 potassium channel by variable phosphorylation. Science 313: 976–979 [DOI] [PubMed] [Google Scholar]
- Pesavento JJ, Bullock CR, LeDuc RD, Mizzen CA, Kelleher NL (2008) Combinatorial modification of human histone H4 quantitated by two-dimensional liquid chromatography coupled with top down mass spectrometry. J Biol Chem 283: 14927–14937 [DOI] [PMC free article] [PubMed] [Google Scholar]
- Pesavento JJ, Mizzen CA, Kelleher NL (2006) Quantitative analysis of modified proteins and their positional isomers by tandem mass spectrometry: human histone H4. Anal Chem 78: 4271–4280 [DOI] [PubMed] [Google Scholar]
- Phanstiel D, Brumbaugh J, Berggren WT, Conrad K, Feng X, Levenstein ME, McAllister GC, Thomson JA, Coon JJ (2008) Mass spectrometry identifies and quantifies 74 unique histone H4 isoforms in differentiating human embryonic stem cells. Proc Natl Acad Sci USA 105: 4093–4098 [DOI] [PMC free article] [PubMed] [Google Scholar]
- Pufall MA, Lee GM, Nelson ML, Kang HS, Velyvis A, Kay LE, McIntosh LP, Graves BJ (2005) Variable control of Ets-1 DNA binding by multiple phosphates in an unstructured region. Science 309: 142–145 [DOI] [PubMed] [Google Scholar]
- Regenmortel MHVV (2009) What is a B-cell epitope? Methods Mol Biol 524: 3–20 [DOI] [PubMed] [Google Scholar]
- Schutz-Geschwender A, Zhang Y, Holt T, McDermitt D, Olive DM (2004) Quantitative, two-colour Western blot detection with infrared fluorscence, published by LI-COR Biosciences. Available from http://www.licor.com/bio/PDF/IRquant.pdf
- Selenko P, Frueh DP, Elsaesser SJ, Haas W, Gygi SP, Wagner G (2008) In situ observation of protein phosphorylation by high-resolution NMR spectroscopy. Nat Struct Mol Biol 15: 321–329 [DOI] [PubMed] [Google Scholar]
- Selenko P, Wagner G (2007) Looking into live cells with in-cell NMR spectroscopy. J Struct Biol 158: 244–253 [DOI] [PubMed] [Google Scholar]
- Shvartsburg AA, Creese AJ, Smith RD, Cooper HJ (2010) Separation of peptide isomers with variant modified sites by high-resolution differential ion mobility spectrometry. Anal Chem 82: 8327–8334 [DOI] [PMC free article] [PubMed] [Google Scholar]
- Steen H, Jebanathirajah JA, Rush J, Morrice N, Kirschner MW (2005a) Phosphorylation analysis by mass spectrometry: myths, facts, and the consequences for qualitative and quantitative measurements. Mol Cell Proteomics 5: 172–181 [DOI] [PubMed] [Google Scholar]
- Steen H, Jebanathirajah JA, Springer M, Kirschner MW (2005b) Stable isotope-free relative and absolute quantitation of protein phosphorylation stoichiometry by MS. Proc Natl Acad Sci USA 102: 3948–3953 [DOI] [PMC free article] [PubMed] [Google Scholar]
- Thomson M, Gunawardena J (2009) Unlimited multistability in multisite phosphorylation systems. Nature 460: 274–277 [DOI] [PMC free article] [PubMed] [Google Scholar]
- Timm W, Ozlu N, Steen JJ, Steen H (2010) Effect of high-accuracy precursor masses on phosphopeptide identification from MS3 spectra. Anal Chem 82: 3977–3980 [DOI] [PubMed] [Google Scholar]
- Ulintz PJ, Yocum AK, Bodenmiller B, Aebersold R, Andrews PC, Nesvizhskii AI (2009) Comparison of MS2-only, MSA and MS2/MS3 methodologies for phosphopeptide identification. J Proteome Res 8: 887–899 [DOI] [PMC free article] [PubMed] [Google Scholar]
- Winter D, Pipkorn R, Lehmann WD (2009) Separation of peptide isomers and conformers by ultra performance liquid chromatography. J Sep Sci 32: 1111–1119 [DOI] [PubMed] [Google Scholar]
- Wu RC, Qin J, Yi P, Wong J, Tsai SY, Tsai MJ, O’Malley BW (2004) Selective phosphorylations of the SRC-3/AIB1 coactivator integrate genomic responses to multiple cellular signaling pathways. Mol Cell 15: 937–949 [DOI] [PubMed] [Google Scholar]
- Yao Z, Seger R (2009) The Erk signalling cascade—views from different subcellular compartments. Biofactors 35: 407–416 [DOI] [PubMed] [Google Scholar]
- Young NL, DiMaggio PA, Plazas-Mayorca MD, Baliban RC, Floudas CA, Garcia BA (2009) High-throughput characterization of combinatorial histone codes. Mol Cell Proteomics 8: 2266–2284 [DOI] [PMC free article] [PubMed] [Google Scholar]
Associated Data
This section collects any data citations, data availability statements, or supplementary materials included in this article.