



Abstract
Cardiac T2 mapping is a promising method for quantitative assessment of myocardial edema and iron overload. We have developed a new multi-echo fast spin echo (ME-FSE) pulse sequence for breath-hold T2 mapping with acceptable spatial resolution. We propose to further accelerate this new ME-FSE pulse sequence using k-t FOCal Underdetermined System Solver (FOCUSS) adapted with a framework that utilizes both compressed sensing and parallel imaging (.e.g, GRAPPA) to achieve higher spatial resolution. We imaged twelve control subjects in mid-ventricular short-axis planes and compared the accuracy of T2 measurements obtained using ME-FSE with GRAPPA and ME-FSE with k-t FOCUSS. For image reconstruction, we used a bootstrapping two-step approach, where in the first step fast Fourier transform was used as the sparsifying transform and in the final step principal component analysis was used as the sparsifying transform. Compared with T2 measurements obtained using GRAPPA, T2 measurements obtained using k-t FOCUSS were in excellent agreement (mean difference = 0.04 ms; upper/lower 95% limits of agreement were 2.26/−2.19 ms). The proposed accelerated ME-FSE pulse sequence with k-t FOCUSS is a promising investigational method for rapid T2 measurement of the heart with relatively high spatial resolution (1.7 mm × 1.7 mm).
Keywords: MRI, heart, multi-echo FSE, T2, compressed sensing, parallel imaging, k-t FOCUSS
Introduction
Black-blood, T2-weighted fast spin echo (FSE)(1) pulse sequence (2) is emerging as an important cardiovascular magnetic resonance (CMR) method to detect T2 changes induced by a variety of diseases, including edema (3–5) and iron overload (6,7). However, with black-blood T2-weighted FSE pulse sequence, the resulting clinical interpretation is often hindered by surface coil effects, which yield non-uniform signals unrelated to pathology.
Quantitative tissue characterization with T2 measurement can overcome these limitations associated with T2-weighted MRI and further improve the accuracy and precision of detecting and assessing the severity of cardiac disease. Myocardial T2 measurement, however, is technically challenging, because robust pulse sequences, such as multiple single spin-echo pulse sequence with different echo times and Carr-Purcell-Meiboom-Gill (CPMG) (8,9), are inherently inefficient and require navigator gating that render them clinically impractical. Recent developments in breath-hold cardiac T2 mapping pulse sequences have been applied for identification of edema (10,11) and iron overload (12–14), with each specific pulse sequence having advantages and disadvantages. We have developed a breath-hold T2 mapping pulse sequence based on multi-echo FSE (ME-FSE)(13) and validated it in vivo against the navigator gated CPMG. This new ME-FSE pulse sequence with a turbo factor (TF) of 2 and reverse centric k-space ordering provides an accuracy that is comparable to that of even-echo CPMG, as previously described (13). Note that TF is the number of echoes acquired after each excitation. Combining this TF with conventional parallel imaging enables a breath-hold acquisition with spatial resolution on the order of 2.7 mm × 3.8 mm. While this spatial resolution may be adequate for liver imaging, it may be marginally acceptable for cardiac imaging and sensitive to partial volume effects in patients with thinned myocardial wall due to left ventricular (LV) remodeling.
T2 mapping is a good candidate for compressed sensing (CS)(15), because the transverse magnetization (e.g., signal) as a function of time is monoexponential and sparse after applying an appropriate transform (16), such as Principal Component Analysis (PCA)(17–19). We propose to further accelerate the new ME-FSE pulse sequence using k-t FOCal Underdetermined System Solver (FOCUSS)(20–23) adapted with a framework (20,24) that utilizes both CS and parallel imaging (25,26). The purposes of this study were to develop an accelerated ME-FSE pulse sequence using k-t FOCUSS for cardiac T2 mapping with relatively high spatial resolution and to validate it against the new ME-FSE pulse sequence using parallel imaging alone.
Methods
Our aim was to achieve relatively high spatial resolution (~ 2 mm × 2 mm) within clinically acceptable breath-hold duration (~ 20s). An acceleration rate (R) of 6, in combination with a TF of 2, was needed to acquire a 192 × 192 × 16 (echoes) data matrix within a breath-hold duration of less than 20 heart beats. For a field of view (FOV) of 320 mm × 320 mm, an inter-echo spacing (ESP) of 5 ms, and a TF of 2, this acquisition matrix corresponds to a scan time of 18 heart beats (1 heart beat to acquire the coil sensitivity data; 1 heart beat to acquire dummy scans to approach steady state of magnetization; 16 heart beats to acquire the image data) and an echo-train duration of approximately 160 ms.
The key components for high performance in CS are image sparsity and incoherent aliasing artifacts. The following two sections (Preliminary Experiments 1 & 2) describe the methods and results of preliminary experiments, which were needed for the acceleration strategy.
Preliminary Experiment 1: k-t Undersampling Pattern
A different pseudo-random undersampling pattern with higher density at the center of k-space for each time point was proposed for applications of CS to dynamic imaging, to maximize incoherence and reduce the resulting aliasing artifacts by distributing them along two dimensions (24,27). We used a different realization of an 8th-order polynomial probability distribution function to generate the variable-density random undersampling pattern along ky for each t, where ky is the spatial frequency in the phase-encoding direction and t is the echo dimension. We modified the previously described ME-FSE pulse sequence (13) to employ a 6-fold accelerated ky-t sampling pattern (Fig. 1). Figure 1 shows the resulting point-spread-function (PSF) in the sparse y-PCA space after applying FFT along ky and PCA along t, where y is the phase-encoding direction. For completeness, Figure 1 also shows the resulting PSF in the sparse y-f space after applying Fourier transform along ky and t, where f is frequency. The ratio of the peak and standard deviation of PSF was 31.7 and 32.4 for PCA and FFT, respectively.
Figure 1.

(Left) 6-fold accelerated ky-t sampling pattern based on FOV = 320 mm × 320 mm, inter-image spacing = 10 ms, and number of images = 16. (Middle) Corresponding PSF in the sparse y-f space using FFT as the sparsifying transform. Ratio of the peak and standard deviation of PSF was 32.4. (Right) Corresponding PSF in the sparse y-PCA space using PCA as the sparsifying transform. Ratio of the peak and standard deviation of PSF was 31.7.
Preliminary Experiment 2: Sparsifying Transform
We performed numerical simulation to compare two different sparsifying transforms, fast Fourier transform (FFT) and PCA for accelerated T2 mapping with ME-FSE. Using the pulse sequence parameters used in this study (see Pulse Sequence) and assuming myocardial T2 = 50 ms (14), an ideal monoexponential curve representing the transverse magnetization of ME-FSE was generated and plotted in Figure 2. This same monoexponential time curve was replicated for each point on the 192 × 192 (x-y) plane to emulate the spatial resolution studied in vivo, where x is the frequency-encoding direction. Figure 2 also shows both FFT and PCA representations of this curve. These plots clearly show that a monoexponential decay curve is sparser in PCA than in FFT domain. To further validate this finding, both FFT and PCA representations of a reference ME-FSE series are shown in Figure 2. The data were consistent with the ideal curves shown in Figure 2. These preliminary results prove that PCA is a superior sparsifying transform than FFT for T2 mapping with ME-FSE, and confirms the rationale behind the use of PCA in previous T2 mapping studies with CS (17–19). Based on these preliminary results, we used PCA as the sparsifying transform for accelerated T2 mapping with k-t FOCUSS. Similar to distributing residual aliasing artifacts along two dimensions, image sparsity was also enforced along two dimensions.
Figure 2.

(a) Monoexponential decay curve representing the transverse magnetization (Mxy) of ME-FSE. b) FFT representation of a) and c) PCA representation of a). These plots clearly show that a monoexponential decay curve is sparser in PCA than in FFT domain. To further validate this finding, a reference ME-FSE series is displayed in both d) FFT and e) PCA domains. Both domains are displayed with identical grayscale of 0 – 1000 arbitrary unit (a.u.). The results were consistent with the ideal curves shown (a-c). These preliminary results prove that PCA is a superior sparsifying transform than FFT for T2 mapping with ME-FSE, and confirms the rationale behind the use of PCA in previous T2 mapping studies with CS (17–19).
Pulse Sequence
For the purposes of this work, the ME-FSE pulse sequence with parallel imaging alone is defined as the reference T2 mapping pulse sequence, and the ME-FSE pulse sequence with k-t FOCUSS is defined as the accelerated T2 mapping sequence. For details on the reference T2 mapping pulse sequence, see reference (13).
Both the reference and accelerated T2 mapping pulse sequences were implemented on a whole-body 3T MRI scanner (Tim Trio, Siemens Healthcare, Erlangen, Germany) equipped with a gradient system capable of achieving a maximum gradient strength of 45 mT/m and a slew rate of 200 T/m/s. The radio-frequency (RF) excitation was performed using the body coil, and a 32-element cardiac coil array (Invivo, Orlando, FL) was employed for signal reception. Relevant imaging parameters for both pulse sequences were: FOV = 320 mm × 320 mm, slice thickness = 10 mm, excitation RF pulse duration = 1.5 ms, refocusing RF pulse duration = 2.0 ms, ESP = 5 ms, TF = 2, number of images =16, echo train length per shot = 32, echo train duration = 163 ms, receiver bandwidth = 531 Hz/pixel, and double-inversion, black-blood preparation pulses.
The accelerated T2 mapping pulse sequence used R = 6, acquisition matrix = 192 × 192 × 16, breath-hold duration = 18 heart beats (1 heart beat to acquire the coil sensitivity maps, 1 heart beat to acquire dummy scans to approach steady state of magnetization, and 16 heart beats to acquire the image data). The reference T2 mapping pulse sequence used generalized autocalibrating partially parallel acquisitions (GRAPPA)(28) with R = 1.8, acquisition matrix = 192 × 76, and breath-hold duration = 21 heat beats (1 heart beat to acquire dummy scans to approach steady state of magnetization, and 20 heart beats to acquire the image data). Note that, to maintain a breath-hold duration on the order of 20s, the spatial resolution in the phase-encoding direction was set at only 40% of the resolution achieved in the accelerated T2 mapping pulse sequence.
Improving Sparsity using Pre-Conditioning RF pulses
As previously described, CS performance is determined by image sparsity (15). We hypothesize that suppression of bright signals unrelated to the heart increases sparsity of ME-FSE data. Given that the proposed ME-FSE echo train is acquired during 163 ms per heart beat, the pulse sequence permits the use of multiple pre-conditioning RF pulses prior to ME-FSE readout (Figure 3), without exceeding clinically acceptable specific absorption rate limit. We explored the use of fat suppression and pre-saturation RF pulses to suppress bright signals unrelated to the heart (e.g., chest wall and back). Note that pulse duration of a spatial pre-saturation module, including spoiler gradients, is 4.8 ms, and that pulse duration of a fat suppression module, including spoiler gradients, is 12.2 ms. Figure 4 shows a short-axis scout image and illustrations on how pre-conditioning RF pulses were utilized to increase sparsity for cardiac ME-FSE imaging, as well as the resulting four cases of ME-FSE with parallel imaging (see Pulse Sequence for the relevant imaging parameters) using different pre-conditioning RF pulses: i) none, ii) fat suppression, iii) three spatial pre-saturation pulses, and iv) fat suppression and three spatial pre-saturation RF pulses. The slice thickness of the pre-saturation bands was graphically adjusted between 50 to 100 mm. Between the four cases of preliminary results, the combined use of fat suppression and pre-saturation RF pulses produced the best suppression of bright signals unrelated to the heart (Figure 4). Given the lack of consequential penalty associated with the combined use of fat saturation and three spatial pre-saturation pulses, we acquired accelerated ME-FSE images with the pre-conditioning RF pulses. To validate the usefulness of increasing sparsity with pre-conditioning RF pulses, we compared both the image quality and T2 accuracy of accelerated data with and without pre-conditioning RF pulses.
Figure 3.

Schematic diagram of the proposed accelerated T2 mapping pulse sequence with pre-conditioning RF pulses. Electrocardiogram triggering was used to image at mid to late diastole, to image at a cardiac phase where there is minimal cardiac motion. Three pre-saturation RF modules and a single fat suppression module were applied prior to ME-FSE readout as shown. These diagrams are drawn to approximate proportions but not exact scales. ECG: electrocardiogram; Pre: pre-conditioning; PS: pre-saturation; FS: fat suppression.
Figure 4.

Representative (column 1) short-axis scout image displaying positions and thicknesses of three pre-saturation RF pulses (displayed as meshed-strip lines). Resulting ME-FSE images with GRAPPA at TE = 10 ms: (column 2) none, (column 3) fat suppression, (column 4) three pre-saturation RF pulses, and (column 5) fat suppression and three pre-saturation RF pulses. Between the four cases, the combined use of fat suppression and pre-saturation RF pulses produced the best suppression of bright signals unrelated to the heart.
Phantom Imaging
For in vitro validation, we imaged a phantom consisting of five bottles containing different concentrations of manganese chloride (MnCl2) in distilled water: 0.135, 0.270, 0.405, 0.540 and 0.675 mM. MnCl2 was chosen because it has T1/T2 on the order of 10. These concentrations were chosen to emulate clinically relevant T2 values in the myocardium.
Cardiac Imaging
Twelve adult volunteers (7 males and 5 females; mean age = 26.1 ± 1.8 years) were imaged in a mid-ventricular short-axis plane. Electrocardiogram triggering was used to image at mid to late diastole, to image at a cardiac phase where there is minimal cardiac motion. Human imaging was performed in accordance with protocols approved by the New York University School of Medicine Institutional Review Board; all subjects provided written informed consent.
Image Reconstruction
The GRAPPA image reconstruction was performed on-line using commercially available reconstruction algorithm. We adapted the k-t FOCUSS reconstruction to use a framework (20,24) that combines CS and parallel imaging. The k-t FOCUSS reconstruction was performed off-line using customized software developed in a GPU (graphics processing unit) platform with CUDA (Compute Unified Device Architecture) programming. For details on the general k-t FOCUSS reconstruction, see reference (20–23).
Previously proposed accelerated T2 mapping methods using CS (16–18) require a training data for PCA, whereas our method uses a bootstrapping approach to self calibrate a PCA basis without training data. Given the proposed undersampling pattern shown in Figure 1, an accurate PCA basis cannot be directly estimated because a set of low frequency k-space frequencies was not fully sampled. Therefore, as described in the previous work (22), we implemented a two-step bootstrap reconstruction approach (Figure 5). In step 1, coil sensitivity maps, and multi-coil k-space data were used to perform preliminary k-t FOCUSS reconstruction (m1) using FFT as the sparsifying transform. In step 2, m1 was used to estimate a basis set for PCA. The schematic details are shown in Figure 6. By concatenating each time signal vector along column direction, a matrix V is constructed. Then, by conducting eigen-decomposition of the covariance matrix C of V, a basis set for PCA is estimated. The resulting basis set, coil sensitivity maps, and multi-coil k-space data were used to perform the final reconstruction (m2) using an optimal temporal PCA basis. Our preliminary analysis showed that this bootstrap approach yields better results than the direct PCA approach. Each FOCUSS step consists of updating a weighting matrix and solving a least square solution with the updated weighting matrix. In our implementation, a weighting matrix is updated three times, and the least square solution is solved iteratively with fifty conjugate gradient steps with the corresponding weighting matrix. Using a NVIDIA Tesla GPU with 4 GB global memory, the total computational time per image time series using the two-step bootstrap k-t FOCUSS was 1 minute.
Figure 5.

Schematic flowchart of the two-step reconstruction methods. In step 1, coil sensitivity maps and multi-coil k-space data were used to perform preliminary reconstruction using FFT as the sparsifying transform. In step 2, m1 was used to estimate a basis set for PCA. The resulting PCA basis set, coil sensitivity maps, and multi-coil k-space data were used to perform the final reconstruction (m2). m1: reconstructed image using FFT as the sparsifying transform; m2: reconstructed image using PCA as the sparsifying transform; s.t.: subject to; ε: noise level. See Figure 6 for schematic details on step 2.
Figure 6.

Schematics details of estimating a PCA basis. Results from step 1 (i.e., m1) in Figure 5 are shown in upper left. By concatenating each time signal vector along column direction, a matrix V is constructed. Then, by conducting eigen-decomposition of the covariance matrix C of V, a basis set for PCA is estimated.
Image Analysis
Image analysis was performed using customized software developed in MATLAB, and nonlinear least square fitting was based on the MATLAB implementation of the Levenberg-Marquardt algorithm (Statistics Toolbox™ version 6.2).
For each MnCl2 phantom bottle, a mask covering the whole bottle was generated with image intensity thresholding, and the corresponding pixel-by-pixel T2 map was calculated (see below for details). For in vivo data, both reference and accelerated ME-FSE data sets of all subjects were pooled and randomized for independent blinded analysis. The LV endo- and epi-cardial contours were manually drawn to mask the whole LV. The corresponding pixel-by-pixel T2 map was calculated by nonlinear least square fitting for three parameters of the monoexponential signal relaxation equation:
| [1] |
where S(t) is the signal amplitude at time t, Sideal is the ideal signal, and the three unknown parameters are: the initial signal amplitude (S0), the mean background noise (σ), and T2. This approximate noise correction procedure is similar to the method of McGibney and Smith (29), although here the noise was determined from a fit to the data rather than from the signal in air.
Statistical Analysis
For each bottle of the phantom, the mean transverse relaxation rate (R2)(=1/T2) was calculated. The five mean R2 measurements were plotted as a function of MnCl2 concentration, and the transverse relaxivity of MnCl2 was calculated by performing linear regression analysis.
According to the 16-segment model recommended by American Heart Association (30), the mid-ventricular short-axis view of the myocardium was divided into six segments: anterior, anteroseptal, inferoseptal, inferior, inferolateral, and anterolateral. Statistical analyses were performed using SPSS version 18 (SPSS Inc, Chicago, IL). The mean T2 and segmental T2 measurements were compared using the paired-sample t-test (2-tailed). A p < 0.05 was considered to be statistically significant. Reported values represent mean ± standard deviation. Bland-Altman analysis was performed to determine the bias and precision of T2 measurements obtained using the accelerated T2 mapping pulse sequence as compared with those obtained using the reference T2 mapping pulse sequence.
To assess the influence of manual segmentation of LV contours on T2 calculation, we assessed the intra- and inter-observer variability of T2 calculation using the Bland-Altman analysis. For intra-observer variability assessment, one blinded observer (L.F) repeated the image analysis (i.e., contour segmentation and T2 calculation) with at least two weeks of separation from the first analysis, and Bland-Altman analysis was performed on the resulting two sets of T2 measurements (analysis 1 vs. analysis 2). Intra-observer difference was defined as T2 (analysis 1) – T2 (analysis 2). For inter-observer variability assessment, the second blinded observer (D.K) independently analyzed the data, and Bland-Altman analysis was performed on the resulting two sets of T2 measurements (observer 1, analysis 1 vs. observer 2). Inter-observer difference was defined as T2 (observer 1, analysis 1) – T2 (observer 2).
Results
The two sets of in vitro T2 maps calculated from the reference and accelerated ME-FSE data sets were in good agreement. Specifically, the root mean square error was 0.54 ms. The reference and accelerated ME-FSE T2 maps yielded transverse relaxivities of 88.6 ± 1.2 and 88.3 ± 1.4 s−1/mM, respectively.
Figure 7 shows representative ME-FSE images acquired using the reference and accelerated T2 mapping pulse sequences. The accelerated T2 mapping pulse sequence consistently yielded higher spatial resolution in the phase-encoding direction (1.7 mm × 1.7 mm vs. 1.7 mm × 4.2 mm; accelerated vs. reference, respectively). In all subjects, k-t FOCUSS yielded good image quality. Figure 8 shows the corresponding zoomed images and the resulting T2 maps. Mean T2 values of this subject calculated from GRAPPA and k-t FOCUSS images were 51.7 ± 3.6 and 51.6 ± 4.0, respectively. Compared with the GRAPPA image, k-t FOCUSS image yielded higher spatial resolution in the phase-encoding direction, as highlighted by the intensity profiles at the edge of the muscle-blood border.
Figure 7.

Representative ME-FSE images acquired using the reference and accelerated T2 mapping pulse sequences: (top row) GRAPPA and (bottom row) k-t FOCUSS. Compared with GRAPPA, k-t FOCUSS consistently yielded higher spatial resolution in the phase-encoding direction (1.7 mm × 1.7 mm vs. 1.7 mm × 4.2 mm; accelerated vs. reference, respectively).
Figure 8.

Zoomed ME-FSE image series corresponding to Figure 7: (top row) GRAPPA and (bottom row) k-t FOCUSS. Mean T2 values of this subject resulting from GRAPPA and k-t FOCUSS were 51.7 ± 3.6 and 51.6 ± 4.0, respectively. Compared with GRAPPA image, k-t FOCUSS image yielded higher spatial resolution in the phase-encoding direction, as shown by the intensity profiles of the muscle-blood border.
For the pool of twelve subjects, mean myocardial T2 values measur ed by observer 1 (analysis 1) using the GRAPPA and k-t FOCUSS data were 49.9 ± 1.5 and 50.0 ± 1.5, respectively, and they were not significantly different (p > 0.05). The corresponding mean segmental T2 values are summarized in Table 1, and mean T2 values for every segment were not significantly different (p > 0.05). These findings are consistent with previously reported T2 measurements of controls at 3T (14). These mean T2 values between GRAPPA and k-t FOCUSS were not significantly different (p > 0.8).
Table 1.
Mean segmental and whole myocardial T2 measurements obatined using GRAPPA and k-t FOCUSS data sets. Note that these values represent results analyzed by observer 1, analysis 1.
| Myocardium | GRAPPA | k-t FOCUSS |
|---|---|---|
| Anterior | 49.1 ± 3.2 ms | 48.7 ± 2.6 ms |
| Anteroseptal | 52.0 ± 3.0 ms | 51.5 ± 2.8 ms |
| Inferoseptal | 51.4 ± 2.6 ms | 51.6 ± 2.9 ms |
| Inferior | 50.3 ± 1.8 ms | 49.9 ± 1.9 ms |
| Inferolateral | 50.2 ± 1.5 ms | 49.6 ± 2.7 ms |
| Anterolateral | 47.1 ± 1.9 ms | 49.1 ± 2.6 ms |
| Whole myocardium | 49.9 ± 1.5 ms | 50.0 ± 1.5 ms |
According to the Bland-Altman analysis (Table 2), T2 measurements obtained from k-t FOCUSS and GRAPPA images were in excellent agreement (mean difference = 0.04 ms; upper/lower 95% limits of agreement were 2.26/−2.19 ms), suggesting that the corresponding T2 measurements are quantitatively equivalent (see Table 2). The corresponding Bland-Altman statistics for the segmental T2 measurements are summarized in Table 2.
Table 2.
Bland-Altman statistics of T2 measurements obtained using GRAPPA and k-t FOCUSS data sets. Note that these values represent results analyzed by observer 1, analysis 1.
| Myocardium | Difference (ms) | Upper 95% limit (ms) | Lower 95% limit (ms) |
|---|---|---|---|
| Anterior | −0.40 | 5.43 | −6.23 |
| Anteroseptal | −0.52 | 5.69 | −6.72 |
| Inferoseptal | 0.21 | 4.01 | −3.60 |
| Inferior | −0.36 | 3.29 | −4.00 |
| Inferolateral | −0.59 | 5.31 | −6.49 |
| Anterolateral | 1.99 | 8.14 | −4.17 |
| Whole myocardium | 0.04 | 2.26 | −2.19 |
The intra-observer agreements for T2 calculations using the same set of GRAPPA and k-t FOCUSS data were −0.18 and 0.04, the upper 95% limits of agreements were 0.99 and 0.91, and the lower 95% limits of agreements were −1.34 and −0.83, respectively. The inter-observer agreements for T2 calculations using the same set of GRAPPA and k-t FOCUSS data were 0.36 and 0.35, the upper 95% limits of agreements were 1.56 and 1.37, and the lower 95% limits of agreements were −0.83 and −0.68, respectively . These Bland-Altman statistics suggest that T2 calculations from a given set of data are highly repeatable and reproducible.
Figure 9 shows example ME-FSE images and the corresponding T2 map with and without pre-conditioning RF pulses. For the latter case, note the signal heterogeneity in the k-t FOCUSS reconstruction, particularly in the lateral wall, as well as the corresponding T2 error. In this subject, the mean T2 measurements within the segmented myocardium were 50.0 ± 4.0 ms and 60.8 ± 12.9 ms for with and without pre-conditioning RF pulses, respectively. These results are corroborated with zero-filled FFT reconstruction images which show more aliasing artifacts for the latter case. These findings clearly demonstrate the usefulness of increasing sparsity in ME-FSE through the use of pre-conditioning RF pulses.
Figure 9.
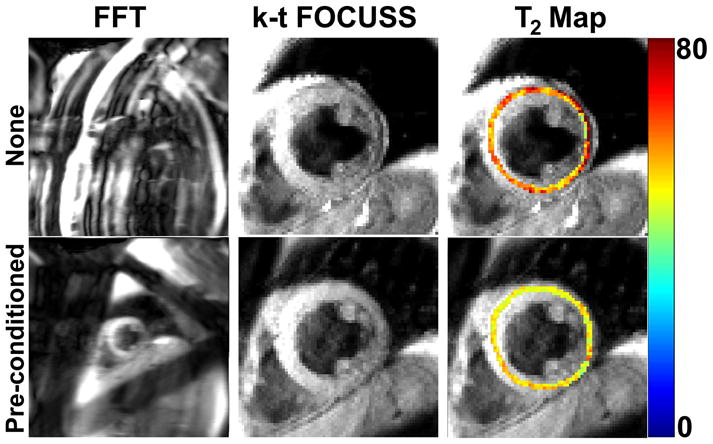
Example ME-FSE images and the corresponding T2 maps with and without pre-conditioning RF pulses. For the latter case, note the signal heterogeneity in the k-t FOCUSS reconstruction, particularly in the lateral wall, as well as the corresponding T2 error. In this subject, the mean T2 measurements within the segmented myocardium were 50.0 ± 4.0 ms and 60.8 ± 12.9 ms for with and without pre-conditioning RF pulses, respectively. These results are corroborated with zero-filled FFT reconstruction images which show more residual aliasing artifacts for the latter case. These results clearly demonstrate the usefulness of increasing sparsity in ME-FSE through the use of preconditioning RF pulses.
Discussion
Our results demonstrate the feasibility of performing a 6-fold accelerated breath-hold ME-FSE acquisition using k-t FOCUSS. Compared with the reference T2 mapping pulse sequence with GRAPPA, the accelerated T2 mapping pulse sequence with k-t FOCUSS produced results in vivo of comparable accuracy (Table 2). In all 12 subjects, k-t FOCUSS reconstruction consistently yielded good image quality. The intra- and inter-observer agreements for T2 calculations from a given set of images were excellent (Table 3).
Table 3.
Intra- and inter-observer agreements for T2 calculations based on manual segmentation of LV contours. Intra-observer difference was defined as T2 (analysis 1) – T2 (analysis 2), and inter-observer difference was defined as T2 (observer 1) – T2 (observer 2).
| Agreement type | Difference (ms) | Upper 95% limit (ms) | Lower 95% limit (ms) |
|---|---|---|---|
| Intra (GRAPPA) | −0.18 | 0.99 | −1.34 |
| Intra (k-t FOCUSS) | 0.04 | 0.91 | −0.83 |
| Inter (GRAPPA) | 0.36 | 1.56 | −0.83 |
| Inter (k-t FOCUSS) | 0.35 | 1.37 | −0.68 |
This study demonstrates that the proposed accelerated breath-hold ME-FSE pulse sequence is a promising investigational method for myocardial T2 measurement with relatively high spatial resolution (1.7 mm × 1.7 mm). Nonetheless, these initial studies have limitations that warrant discussion. First, commercially available fat suppression pulse did not completely suppress the undesirable fat signals at 3T. The use of improved fat suppression pulse, such as chemically selective inversion recovery, should further suppress the fat signal and, subsequently, increase sparsity of cardiac ME-FSE data. Second, we used three spatial pre-saturation pulses prior to ME-FSE readout to suppress bright signals outside the heart. More work is needed to explore the optimal use of spatial pre-saturation pulses (e.g., quantity, pulse width, location, and orientation, etc) for maximal suppression of undesirable background signal. Third, our accelerated ME-FSE pulse sequence acquired an echo train for approximately 160 ms during mid to late diastole, and our data analysis was performed assuming no cardiac motion. However, even with a perfectly still breath hold, gradual ventricular relaxation occurs during the 160 ms of data acquisition. More complex image registration methods are needed to eliminate this potential source of error in data fitting for T2 calculation. Fourth, our study was carried out in a small number of control subjects at 3T, without edema or iron overload. Further studies in a larger number of patients with the whole spectrum of T2 encountered in clinical practice are necessary to fully evaluate the clinical utility of the accelerated ME-FSE pulse sequence and to establish the intra- and inter-instrumental and study variability of the pulse sequence. Fifth, the breath-hold duration of 18 heartbeats could be too long for some patients with impaired breath-hold capacity. In such patients, it may be necessary to sacrifice some spatial resolution in order to reduce the breath-hold duration. Sixth, we performed the multi-coil k-t FOCUSS reconstructions, assuming perfect image registration between the coil sensitivity maps and accelerated data. While our data exhibited good image quality, heart rate variability and drifts in the diaphragm position could lead to mis-registration between the coil sensitivity and accelerated data and subsequently yield image artifacts. One solution to this problem is to perform coil-by-coil reconstruction and then combine the multi-coil images, at the expense of increased residual incoherent aliasing artifacts. A more robust solution to this problem is to perform auto-calibrated parallel imaging in combination with k-t FOCUSS. Seventh, we used the two-step bootstrap reconstruction approach, using FFT as the initial sparsifying transform and PCA as the final sparsifying transform. More work is needed to determine the optimal bootstrap approach, in terms of the number of sparsifying transforms and iterations per step. Eight, we used the proposed k-space sampling pattern (Figure 1) based on our prior experience with accelerated first-pass cardiac perfusion MRI with compressed sensing and parallel imaging (24). While our study does not prove that the proposed k-space sampling pattern is the optimum candidate for accelerated cardiac T2 mapping, it does show that the sampling pattern is an adequate candidate. Determining the optimal k-space sampling pattern is beyond the scope of this work.
In conclusion, the proposed accelerated breath-hold ME-FSE pulse sequence can be used to perform rapid T2 mapping of the heart with relatively high spatial resolution. The proposed accelerated T2 mapping pulse sequence is a promising investigational method for quantitative assessment of myocardial edema and iron overload.
Acknowledgments
Grant Sponsors: National Institutes of Health: R01-DK069373, R01-EB000447-07A1; American Heart Association: 0730143N; Korea Science and Engineering Foundation: 2009-0081089.
References
- 1.Hennig J, Nauerth A, Friedburg H. RARE imaging: a fast imaging method for clinical MR. Magnetic Resonance in Medicine. 1986;3(6):823–833. doi: 10.1002/mrm.1910030602. [DOI] [PubMed] [Google Scholar]
- 2.Simonetti OP, Finn JP, White RD, Laub G, Henry DA. “Black blood” T2-weighted inversion-recovery MR imaging of the heart. Radiology. 1996;199(1):49–57. doi: 10.1148/radiology.199.1.8633172. [DOI] [PubMed] [Google Scholar]
- 3.Abdel-Aty H, Zagrosek A, Schulz-Menger J, Taylor AJ, Messroghli D, Kumar A, Gross M, Dietz R, Friedrich MG. Delayed enhancement and T2-weighted cardiovascular magnetic resonance imaging differentiate acute from chronic myocardial infarction. Circulation. 2004;109(20):2411–2416. doi: 10.1161/01.CIR.0000127428.10985.C6. [DOI] [PubMed] [Google Scholar]
- 4.Cury RC, Shash K, Nagurney JT, Rosito G, Shapiro MD, Nomura CH, Abbara S, Bamberg F, Ferencik M, Schmidt EJ, Brown DF, Hoffmann U, Brady TJ. Cardiac magnetic resonance with T2-weighted imaging improves detection of patients with acute coronary syndrome in the emergency department. Circulation. 2008;118(8):837–844. doi: 10.1161/CIRCULATIONAHA.107.740597. [DOI] [PubMed] [Google Scholar]
- 5.Friedrich MG, Abdel-Aty H, Taylor A, Schulz-Menger J, Messroghli D, Dietz R. The salvaged area at risk in reperfused acute myocardial infarction as visualized by cardiovascular magnetic resonance. Journal of the American College of Cardiology. 2008;51(16):1581–1587. doi: 10.1016/j.jacc.2008.01.019. [DOI] [PubMed] [Google Scholar]
- 6.Ptaszek LM, Price ET, Hu MY, Yang PC. Early diagnosis of hemochromatosis-related cardiomyopathy with magnetic resonance imaging. Journal of Cardiovascular Magnetic Resonance. 2005;7(4):689–692. doi: 10.1081/jcmr-65632. [DOI] [PubMed] [Google Scholar]
- 7.Pressacco J, Elliot TL, Provost Y, Paul N, Merchant N. Case 123: cardiac hemosiderosis. Radiology. 2007;245(1):292–295. doi: 10.1148/radiol.2451040867. [DOI] [PubMed] [Google Scholar]
- 8.Carr H, Purcell E. Effects of diffusion on free precession in nuclear magnetic resonance experiments. Physical Review. 1954;94(3):630–638. [Google Scholar]
- 9.Meiboom S, Gill D. Modified spin-echo method for measuring nuclear relaxation times. The Review of Scientific Instruments. 1958;29(8):688–691. [Google Scholar]
- 10.Gouya H, Vignaux O, Le Roux P, Chanson P, Bertherat J, Bertagna X, Legmann P. Rapidly reversible myocardial edema in patients with acromegaly: assessment with ultrafast T2 mapping in a single-breath-hold MRI sequence. American Journal of Roentgenology. 2008;190(6):1576–1582. doi: 10.2214/AJR.07.2031. [DOI] [PubMed] [Google Scholar]
- 11.Giri S, Chung YC, Merchant A, Mihai G, Rajagopalan S, Raman SV, Simonetti OP. T2 quantification for improved detection of myocardial edema. Journal of Cardiovascular Magnetic Resonance. 2009;11(1):56. doi: 10.1186/1532-429X-11-56. [DOI] [PMC free article] [PubMed] [Google Scholar]
- 12.He T, Gatehouse PD, Anderson LJ, Tanner M, Keegan J, Pennell DJ, Firmin DN. Development of a novel optimized breathhold technique for myocardial T2 measurement in thalassemia. Journal of Magnetic Resonance Imaging. 2006;24(3):580–585. doi: 10.1002/jmri.20681. [DOI] [PubMed] [Google Scholar]
- 13.Kim D, Jensen JH, Wu E, Sheth S, Brittenham GM. Breathhold multiecho fast spin-echo pulse sequence for accurate R2 measurement in the heart and liver. Magnetic Resonance in Medicine. 2009;62(2):300–306. doi: 10.1002/mrm.22047. [DOI] [PMC free article] [PubMed] [Google Scholar]
- 14.Guo H, Au WY, Cheung JS, Kim D, Jensen JH, Khong PL, Chan Q, Chan KC, Tosti C, Tang H, Brown TR, Lam WW, Ha SY, Brittenham GM, Wu EX. Myocardial T2 quantitation in patients with iron overload at 3 Tesla. Journal of Magnetic Resonance Imaging. 2009;30(2):394–400. doi: 10.1002/jmri.21851. [DOI] [PMC free article] [PubMed] [Google Scholar]
- 15.Lustig M, Donoho D, Pauly JM. Sparse MRI: The application of compressed sensing for rapid MR imaging. Magnetic Resonance in Medicine. 2007;58(6):1182–1195. doi: 10.1002/mrm.21391. [DOI] [PubMed] [Google Scholar]
- 16.Doneva M, Börnert P, Eggers H, Stehning C, Sénégas J, Mertins A. Compressed sensing reconstruction for magnetic resonance parameter mapping. Magnetic Resonance in Medicine. 2010;64(4):1114–1120. doi: 10.1002/mrm.22483. [DOI] [PubMed] [Google Scholar]
- 17.Doneva M, Senegas J, Bornert P, Eggers H, Mertins A. Accelerated MR parameter mapping using compressed sensing with model-based sparsifying transform. Proceedings of the 17th Annual Meeting of ISMRM; Honolulu, Hawaii. 2009. (Abstract 2812) [Google Scholar]
- 18.Huang C, Graff C, Bilgin A, Altbach MI. Fast MR parameter mapping from highly undersampled data by direct reconstruction of principal component coefficient maps using compressed sensing. Proceedings of the 18th Annual Meeting of ISMRM; Stockholm, Sweden. 2010. (Abstract 348) [Google Scholar]
- 19.Petzschner F, Ponce I, Blaimer M, Jakob P, Breuer F. Fast MR parameter mapping using k-t PCA. Proceedings of the 18th Annual Meeting of ISMRM; Stockholm, Sweden. 2010. (Abstract 544) [Google Scholar]
- 20.Jung H, Ye JC, Kim EY. Improved k-t BLAST and k-t SENSE using FOCUSS. Physics in Medicine & Biology. 2007;52(11):3201–3226. doi: 10.1088/0031-9155/52/11/018. [DOI] [PubMed] [Google Scholar]
- 21.Jung H, Sung K, Nayak KS, Kim EY, Ye JC. k-t FOCUSS: a general compressed sensing framework for high resolution dynamic MRI. Magnetic Resonance in Medicine. 2009;61(1):103–116. doi: 10.1002/mrm.21757. [DOI] [PubMed] [Google Scholar]
- 22.Jung H, Ye JC. Motion estimated and compensated compressed sensing dynamic magnetic resonance imaging: what we can learn from video compression techniques. International Journal of Imaging Systems and Technology. 2010;20(2):81–98. [Google Scholar]
- 23.Jung H, Park J, Yoo J, Ye JC. Radial k-t FOCUSS for high-resolution cardiac cine MRI. Magnetic Resonance in Medicine. 2010;63(1):68–78. doi: 10.1002/mrm.22172. [DOI] [PubMed] [Google Scholar]
- 24.Otazo R, Kim D, Axel L, Sodickson D. Combination of Compressed Sensing and Parallel Imaging for Highly Accelerated First-Pass Cardiac Perfusion MRI. Magnetic Resonance in Medicine. 2010 doi: 10.1002/mrm.22463. (in press) [DOI] [PMC free article] [PubMed] [Google Scholar]
- 25.Sodickson DK, Manning WJ. Simultaneous acquisition of spatial harmonics (SMASH): fast imaging with radiofrequency coil arrays. Magnetic Resonance in Medicine. 1997;38(4):591–603. doi: 10.1002/mrm.1910380414. [DOI] [PubMed] [Google Scholar]
- 26.Pruessmann KP, Weiger M, Scheidegger MB, Boesiger P. SENSE: sensitivity encoding for fast MRI. Magnetic Resonance in Medicine. 1999;42(5):952–962. [PubMed] [Google Scholar]
- 27.Lustig M, Santos J, Donoho D, Pauly J. k-t SPARSE: High frame rate dynamic MRI exploiting spatio-temporal sparsity. Proceedings of the 14th Annual Meeting of ISMRM; Seatle, Washington, USA. 2006. p. 2420. [Google Scholar]
- 28.Griswold MA, Jakob PM, Heidemann RM, Nittka M, Jellus V, Wang J, Kiefer B, Haase A. Generalized autocalibrating partially parallel acquisitions (GRAPPA) Magnetic Resonance in Medicine. 2002;47(6):1202–1210. doi: 10.1002/mrm.10171. [DOI] [PubMed] [Google Scholar]
- 29.McGibney G, Smith MR. An unbiased signal-to-noise ratio measure for magnetic resonance images. Medical Physics. 1993;20(4):1077–1078. doi: 10.1118/1.597004. [DOI] [PubMed] [Google Scholar]
- 30.Cerqueira MD, Weissman NJ, Dilsizian V, Jacobs AK, Kaul S, Laskey WK, Pennell DJ, Rumberger JA, Ryan T, Verani MS American Heart Association Writing Group on Myocardial S, Registration for Cardiac I. Standardized myocardial segmentation and nomenclature for tomographic imaging of the heart: a statement for healthcare professionals from the Cardiac Imaging Committee of the Council on Clinical Cardiology of the American Heart Association. Circulation. 2002;105(4):539–542. doi: 10.1161/hc0402.102975. [DOI] [PubMed] [Google Scholar]