Abstract
Up to date, no consensus has been achieved regarding the possibility of detecting neuronal currents by MRI (ncMRI) in human brain. To evaluate the detectability of ncMRI, an effective way is to simulate ncMRI signal with the realistic neuronal geometry and electrophysiological processes. Unfortunately, previous realistic ncMRI models are based on rat and monkey neurons. The species difference in neuronal morphology and physiology would prevent these models from simulating the ncMRI signal accurately in human subjects. The aim of the present study is to bridge this gap by establishing a realistic ncMRI model specifically for human cerebral cortex. In this model, the ncMRI signal was simulated using anatomically reconstructed human pyramidal neurons and their biophysical properties. The modeling results showed that the amplitude of ncMRI signal significantly depends on the density of synchronously firing neurons and imaging conditions such as position of imaging voxel, direction of main magnetic field (B0) relative to the cortical surface and echo time. The results indicated that physiologically-evoked ncMRI signal is too weak to be detected (magnitude/phase change ≤ -1.4×10⁻⁶/0.02°), but the phase signal induced by spontaneous activity may reach a detectable level (up to 0.2°) in favorable conditions.
Keywords: neuronal current, MRI, human, realistic
Enormous efforts have been devoted to use MRI to detect magnetic fields produced by neuronal currents (termed ncMRI) in human brain. Nonetheless, to the question whether ncMRI signal is detectable, the answers from different ncMRI experiments on human subjects are still contradictory (1–14). To assess the detectability of ncMRI signal, several groups have simulated the MRI signal change produced by ncMRI effects using simplified current dipole (SCD) models (4,15–17), which depict the neuronal currents as static current dipoles with simple alignment (e.g., parallel or antiparallel).
In SCD models, the neuronal geometry and the dynamics of neuronal activity are ignored to reduce the computational complexity of ncMRI signal simulation. On the other hand, this simplification may significantly degrade the simulation accuracy (18). To overcome this limitation, two groups have recently utilized the realistic structure and biophysical characteristics of the neurons in monkey (18) and rat (19) brains to model ncMRI signal. Since these realistic ncMRI models are able to simulate the temporal and spatial distributions of neuronal currents more accurately, in principle they would provide a more accurate tool to predict the size of ncMRI signal.
However, it has been noted that the ncMRI magnitude/phase signal estimated by the monkey model (10−2/1 degree) (18) is 10,000 times higher than the rat model (10−6/10−4 degree) with the similar imaging parameters. This suggests that the strength of ncMRI signal may vary greatly in different animal species due to differences in their neuronal morphology and physiology. Hence, significant errors may be produced if the monkey (18) or rat (19) ncMRI models are used to estimate the amplitude of ncMRI signal in human brain. Therefore, the results from the previous realistic ncMRI models (18,19) are unable to resolve the debate on the feasibility of ncMRI in human subjects completely. To address this question, it is necessary to establish a realistic ncMRI model specifically for human brain.
To the best of our knowledge, the realistic ncMRI model for human brain is still lacking up to date. In this study, we modeled the ncMRI signal by using the 3-D reconstructed cell structure and biophysical properties of human cortical pyramidal neurons. In addition, the human cerebral cortex is typically composed of six cellular layers (layer IVI) and the neuron packing density varies in different layers. To investigate the impact of this neuron density variation on ncMRI signal, we used six layers of neurons with different neuron density to simulate the ncMRI signal in a cortical tissue. Our modeling results would provide more reliable information about characteristics of ncMRI signal and help to determine the detectability of ncMRI signal in human brain.
Methods
The ncMRI signal in human cerebral cortex was simulated through the following four procedures: (I) Construction of a structural model of cerebral cortical tissue; (II) Calculation of neuronal currents and NMF in single neurons; (III) Simulation of NMF in the activated tissues based on that of single neurons; (IV) Estimation of ncMRI signal changes induced by the NMF in the tissue.
I. Structural model of cerebral cortical tissue
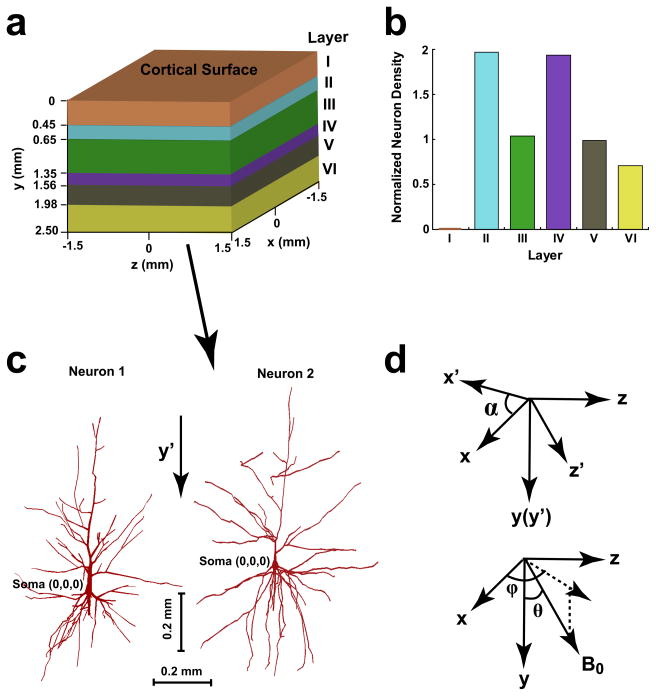
As shown in Figure 1a, a structural model was constructed for a cerebral cortical tissue with surface area of 3 × 3 mm2 and 2.5 mm thickness. A coordination system (x-y-z) is defined based on the geometry of tissue, and the y-axis in this system is perpendicular to the tissue surface. To simulate the architecture of human cortical tissue, the model tissue is divided into six cortical layers (layer I–VI) perpendicular to the tissue surface (y-axis). The cortical layers have different thickness (Fig. 1a) and neuron packing density. The distribution of neuron density in different layers is illustrated in Fig. 1b where the neuron density of each layer is normalized to the average neuron density in the tissue (ρ̄N), which is the weighted average of neuron density in all the layers:
| (1) |
where ρN,k and Tk are the neuron density and thickness of the kth cortical layer, and T is the thickness of tissue. The values of layer thickness and neuron density used in this simulation are obtained from the previous measurements in human brain (20).
Figure 1.
(a) Structure and coordinate system of the cerebral cortical tissue. (b) Distribution of neuron density in six cortical layers. The values of neuron density arenormalized to the average neuron density in the tissue (ρ̄N). (c) Morphology and coordinate system of two human pyramidal neurons, which are from prefrontal (neuron 1) and temporal (neuron 2) cortices, respectively. (d) The relationship of the tissue coordinate system (x-y-z) with the neuron coordinate system (x′-y′-z′) and the direction of B0.
The morphology of the neurons in the model tissue is copied from that of a digital neuron, which is anatomically 3-D reconstructed from a real cortical pyramidal neuron in human brain. Two versions of brain tissue (tissue 1 and 2) were created separately using the digital copies of two pyramidal neurons (neuron 1 and 2). Neuron 1 and 2 were reconstructed from prefrontal cortex (21) and auditory cortex (22), respectively. As shown in Fig. 1c, the shapes of neuron 1 and 2 are described by using 362 and 458 cylinder compartments in the coordinate system of neuron (x′- y′- z′). The origin of this coordinate system is located at soma and the y′ direction is along the length axis of neuron. Considering that pyramidal neurons in human cerebral cortex are approximately perpendicular to the cortical surface, the length axes (y′) of the neurons are aligned along thickness direction of tissue (i.e., y′//y). The directions of width axes (x′- z′) of neurons with respect to that of tissue (x-z) are randomly assigned, and the angle between x′ of each neuron and x is denoted by α (0 ≤ α < 360°) between them (see Fig. 1d). Please note that α is not constant and varies with different neurons.
II. Calculation of neuronal currents and NMFs in single neurons
The distribution of ion currents in neuron 1 and 2 were simulated with the NEURON simulator (23). The biophysical properties of the two neurons are described by two categories of parameters. (1) Passive membrane parameters: specific membrane resistivity Rm, intracellular resistance Ra, and specific membrane capacitance Cm. The values of Rm, Ra and Cm were obtained by fitting the voltage response of the model neuron for a given current pulse (= −0.4 nA) at soma to that measured in the previous human study (Avoli et al., 1994). The detail fitting procedure has been described in previous studies (24). The fitting results are: Rm = 15 Ω·cm2, Ri = 245 Ω·cm, Cm = 0.76 μF/cm2. (2) Active membrane parameters: voltage-gated sodium current INa, delayed-rectifier (IKDR) and A-type (IA) potassium currents. The typical active membrane parameters were used in this model and they have been reviewed in detail by Migliore and Shepherd (25). Briefly, INa and IKDR are uniformly distributed in the dendrites of the neuron. The peak conductance for IA increases linearly with the distance from the soma.
The stimulation to the neurons is represented by 25 excitatory synaptic inputs that are randomly located in the dendrites. The synaptic inputs are produced synchronously with a frequency of 40 Hz, which is the typical neuronal firing frequency for normal neuronal activity (18). Each synaptic event is modeled as a double-exponential function with peak conductance = 0.5 nS, rise/decay time constant = 0.4/1 ms and reversal potential = 0 mV.
Based on the morphological and physiological properties described above, the membrane potentials in the cylindrical compartments of the neuron during 0–50 ms (t = 0–50 ms, time step = 25 μs) are simulated using the NEURON simulator. Then the intracellular current in each compartment is calculated with its membrane potential and resistance according to the Ohm’s law. The extracellular currents are ignored in this model due to their negligible contribution to the ncMRI signal (15,18).
The NMF generated by the intracellular currents in neuron 1 and 2 during 0–50 ms (interval = 1 ms) were calculated in the coordinate system of neuron (x′ - y′ - z′) according to the Biot-Savart law:
| (2) |
where is the NMF at point p(r⃗′) and time t, μ0 is the magnetic permeability in free space, N is the number of cylindrical compartments in the neuron, Ij(t) is the neuronal current in the jth compartment at time t, is the line element vector of the jth compartment and , where and are the positions of the start and end points of the compartment, is the distance vector from the center of the jth compartment to point p and .
Since the NMF decreases rapidly with the increase of distance from the neuron, the NMF is calculated only at the points in the vicinity of the neuron to reduce computation intensity. The calculation region is defined as x′ = [−400 400] (μm), y′= [−400 600] (μm), and z′ = [−200 200] (μm). The NMF outside this region is regarded as zero. The calculation points are sampled uniformly in space with 5 μm interval.
III. Simulation of NMF in activated cortical tissues
The NMF in the activated tissue 1 (tissue 2) was calculated with that of neuron 1 (neuron 2) according to the following relationship:
| (3) |
where B⃗t(r⃗, t) and B⃗n,i (r⃗, t) are the NMFs of tissue and the ith neuron at point r⃗ and time t in the tissue coordinate system (x-y-z), M is the number of activated neurons in the tissue, is the coordinates of r⃗ in the coordinate system of ith neuron (x′- y′- z′), and is obtained using coordinate transform:
| (4) |
where αi is the angle of the width axes of the ith neuron (x′ and y′) relative to the x and z directions (see Fig. 1d), and r⃗0,i is the position vector of soma of the ith neuron in the tissue coordinate system.
With Eqs. (3–4), the NMFs generated in tissue 1 and 2 were simulated on the PADS computer cluster system at the Computation Institute of University of Chicago (http://pads.ci.uchicago.edu/). To investigate the dependence of NMF strength and distribution on the density of neurons that fired synchronously in the tissue (ρ̄FN), the NMF of tissue was calculated with different ρ̄FN values (= 0–5000 neurons/mm3). In this model, the ratio of activated neurons to the total number of neurons (RF) is assumed to be same in all the cortical layers, so there is a proportional relationship between the firing neuron density (ρ̄FN) and overall neuron density (ρ̄N) in the tissue:
| (5) |
In human prefrontal cortex, the average neuron density (ρ̄N) is about 6.2×10⁴ neurons/mm3 (20), then ρ̄FN = 0–5000 neurons/mm3 is corresponding to a firing ratio (RF) of 0–8% approximately. In the simulation, the ρ̄FN value was increased with an interval of 400 neurons/mm3 when ρ̄FN ≤ 2000 neurons/mm3, and a 1000 neurons/mm3 interval was used for ρ̄FN > 2000 neurons/mm3. The calculation points were sampled in the tissue space with 5 μm interval for ρ̄FN = 0–1600 neurons/mm3, and the sampling interval was decreased to 10 μm due to the limitation of computing capacity.
IV. ncMRI signal changes in activated cortical tissues
The magnitude and phase changes of ncMRI signal in the activated tissues are expressed by (4,19):
| (6) |
| (7) |
where δ(TE) and Δφ(TE) are the ncMRI signal changes in magnitude and phase at the echo time (TE), and V is the volume of imaging voxel, φ(r⃗, TE) is the phase shift accumulated by the spin at the point p(r⃗) in an echo time TE and φ(r⃗, TE) is expressed as:
| (8) |
Bt,0(r⃗) is the component of B⃗t(r⃗) in the direction of B⃗0. As shown in Fig. 1d, the direction of B⃗0 is specified by the zenith angle of B⃗0 from the positive y-axis (θ) and the azimuth angle of B⃗0 in the x-z plane from the positive x-axis (ϕ). Then Bt,0(r⃗) can be obtained with the following relationship:
| (9) |
where Bt,x(r⃗), Bt,y(r⃗), and Bt,z(r⃗) are the components of B⃗t(r⃗) on x, y, and z directions.
Using the calculated NMFs in the tissues and Eqs. (6–9), the ncMRI signal changes were simulated on a computer cluster with the following imaging parameters: gradient echo pulse sequence, TE = 0–50 ms (interval = 1 ms), and voxel size = 1×1×1 mm3. Diffusion effects are neglected when calculating the ncMRI signal changes because they have little impact to the ncMRI signal (18). Since the ncMRI signal changes depend upon the location of voxel, to find out the maximum signal, the voxel center is moved throughout the tissue space with a step of 50 μm, and then the ncMRI signal changes were calculated for each position correspondingly. In addition, to investigate the dependence of ncMRI signal on the direction of B⃗0 with respect to neurons, the ncMRI signal was calculated with the combinations of different θ (= 0–180°, 30° interval) and φ (= 0–180°, 30° interval).
Results
Neuronal activity and NMFs in single neurons
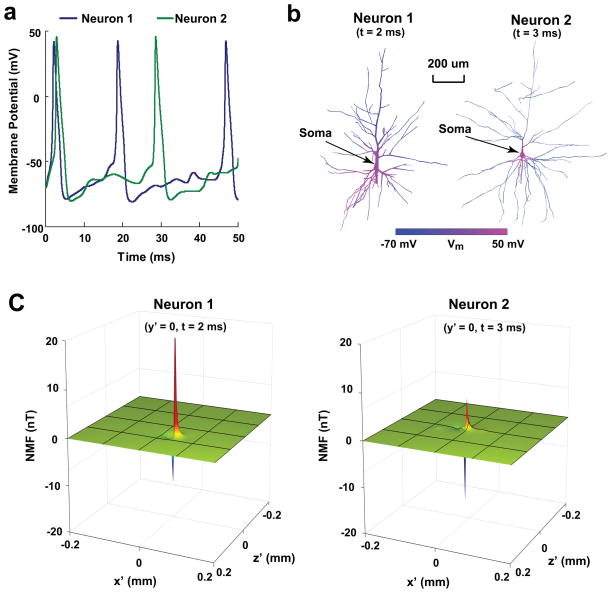
Figure 2a shows the time courses of membrane potentials (Vm) at the soma of neuron 1 and 2 during 0–50 ms. The membrane potential is equal to −70 mV at resting and is altered by the stimulation that starts at 0 ms. It is shown that the potential varies with time and there are three/two peaks in the time course of neuron 1/neuron 2, and the peak duration (full width at half maximum) is about 2 ms.
Figure 2.
(a) Time-varying membrane potentials at soma in neuron 1 and 2 during 0–50 ms. (b) Spatial distribution of membrane potentials (Vm) in neuron 1 at t = 2 ms and in neuron 2 at t = 3 ms. (c) Distribution of z′ component of NMF at t = 2 ms/3 ms produced by neuron 1/neuron 2 on the x′-z′ plane at its soma ( y′ = 0).
The spatial distributions of membrane potentials in the neuron 1 and 2 at the peak response time (t = 2 and 3 ms for neuron 1 and 2) are shown in Fig. 2b. It can be seen that Vm varies significantly with spatial locations. In general, the Vm change relative to resting potential (70 mV) is larger in the dendrites near the soma, and decreases dramatically with increasing distance from the soma.
Figure 2c illustrates the NMF distribution produced by neuron 1 and 2. The figure shows the distribution of z′ component of NMF produced by neuron 1 and neuron 2 in plane y′= 0 at the peak response time. It can be seen that the amplitude and polarity of NMFs change with spatial locations. The NMFs decay rapidly with the increase of distance from the neuron. At the edges of the calculation region ( x′ = [−400 400] (μm), y′= [−400 600] (μm), and z′ = [−200 200] (μm)), the magnitudes of NMFs decrease to 1 pT approximately, which is tens of thousands weaker than the maximum NMF generated by the neuron. So the NMFs outside the calculation region can be regarded as zero.
NMFs in the activated cortical tissue
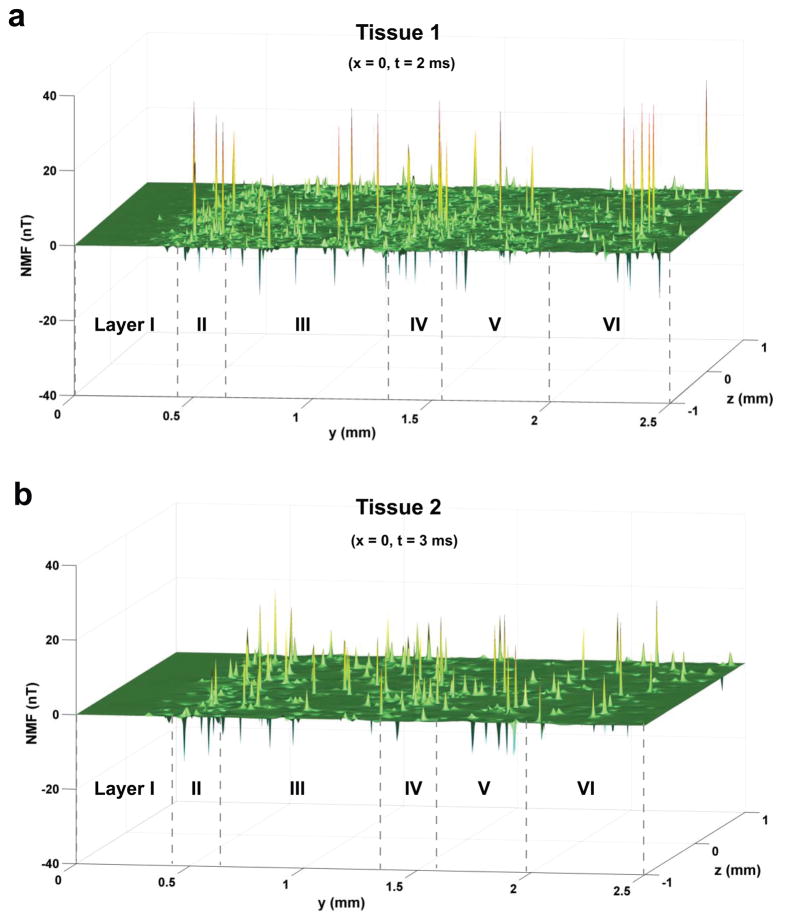
Figure 3 shows spatial distribution of the z components of NMFs in the activated cortical tissue 1/tissue 2 in plane x = 0 at t = 2 ms/3 ms. The results in the figure were obtain with a neuron firing ratio of 10% (ρ̄FN = 800 neurons/mm3). It is found that the cortical NMFs are inhomogeneous in the tissue. The mean and standard deviation of the NMF are 0.01 and 0.51 nT (0.02 and 0.37 nT) in tissue 1 (tissue 2). Furthermore, the extent of field inhomogeneity varies with different cortical layers. Layer I shows the smallest fluctuation in NMF, and the largest field inhomogeneity is present in layer II. The results for other firing neuron densities also show the same behavior. The fluctuation and average intensity of NMF increase with the increase in ρ̄FN.
Figure 3.
Distribution of z component of NMF in the activated tissue 1 (a) at t = 2 ms and tissue 2 (b) at t = 3 ms on the y-z plane at their soma (x = 0).
ncMRI signal in the cortical tissue
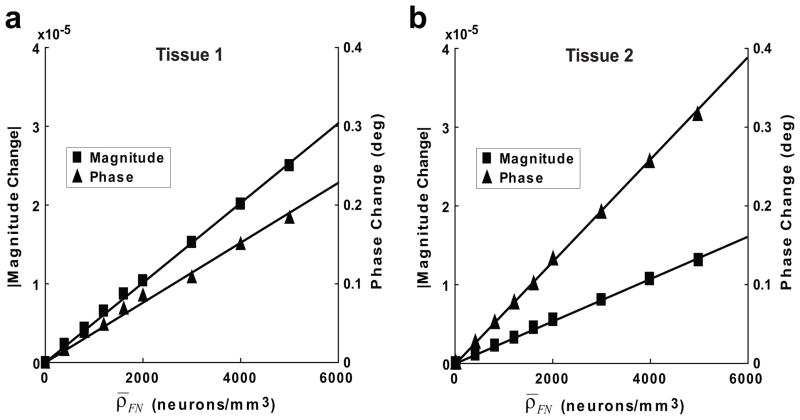
Figure 4 shows maximum ncMRI magnitude and phase signal changes at TE = 50 ms for different firing neuron densities (ρ̄FN). The maximum signal changes refer to the maximum values that can be achieved with all possible B⃗0 directions and voxel positions. It is found that the amplitude of ncMRI signal increases with the increase in ρ̄FN, and there is an approximately linear relationship between the ncMRI signal change and ρ̄FN. When increasing ρ̄FN from 0 to 5000 neurons/mm3 (corresponding RF = 0–62.5%), the magnitude/phase signal change is elevated from 0 to 2.6×10⁻⁵/0.17° (1.2×10⁻⁵/0.32°) in tissue 1 (tissue 2).
Figure 4.
The relationship between ncMRI signal changes and the density of firing neurons (ρ̄FN) in tissue 1 (a) and 2 (b). The straight lines in the figure indicate the lines fitted from the data points.
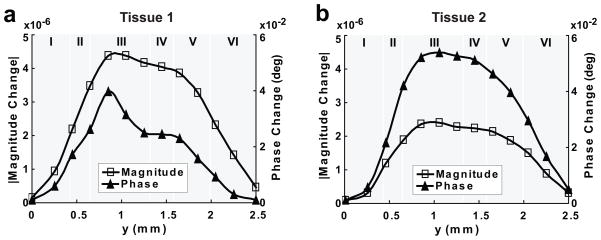
Figure 5 demonstrates the dependence of ncMRI signal changes on the position of voxel when ρ̄FN = 800 neurons/mm3 and TE = 50 ms. It can be seen that magnitude and phase changes increase initially when increasing the depth of the voxel’s position relative to the tissue surface (at y = 0), reach to their maximum in layer III, and then decrease with further increase in the depth. The same phenomena were observed in the results for other ρ̄FN values.
Figure 5.
Dependence of ncMRI signal on the position of voxel in the direction of tissue thickness (y). (a) and (b) show the results obtained with average firing neuron density (ρ̄FN) of 800 neurons/mm3 (corresponding to neuron firing ratio of 10%) in tissue 1 and 2, respectively.
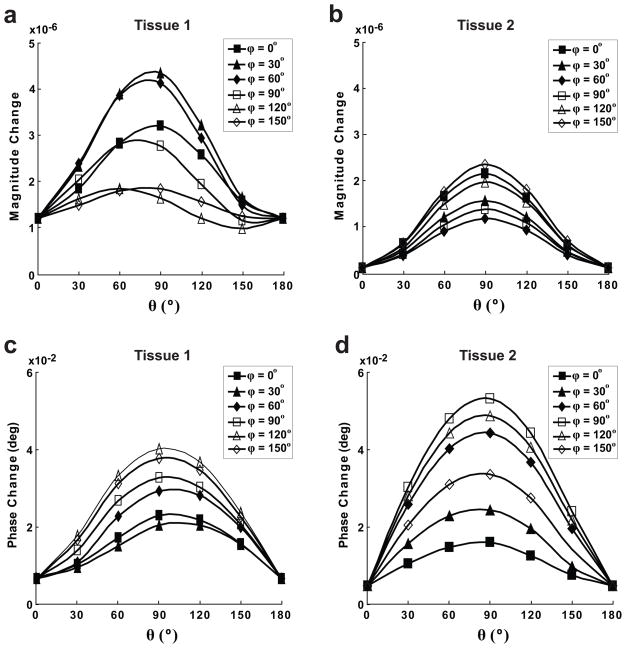
As shown in Figure 6, the size of ncMRI signal varies with the direction of B⃗0 relative to the neurons ρ̄FN = 800 neurons/mm3. It can be seen that for different B⃗0 directions (governed by θ and ϕ), a difference of up to 5/10 times exists in their corresponding magnitude/phase ncMRI signal changes. In most cases, for a given ϕ, the ncMRI signal is the strongest when B⃗0 is approximately perpendicular to the length axes of neurons (θ = 90°).
Figure 6.
Dependence of magnitude (a and b) and phase (c and d) signal changes in the direction of B⃗0. (a), (c) and (b), (d) show the results of tissue 1 and 2, respectively. The direction of B⃗0 is specified by the zenith angle of B⃗0 from the positive y-axis (θ) and the azimuth angle of B⃗0 in the x-z plane from the positive x-axis (ϕ).
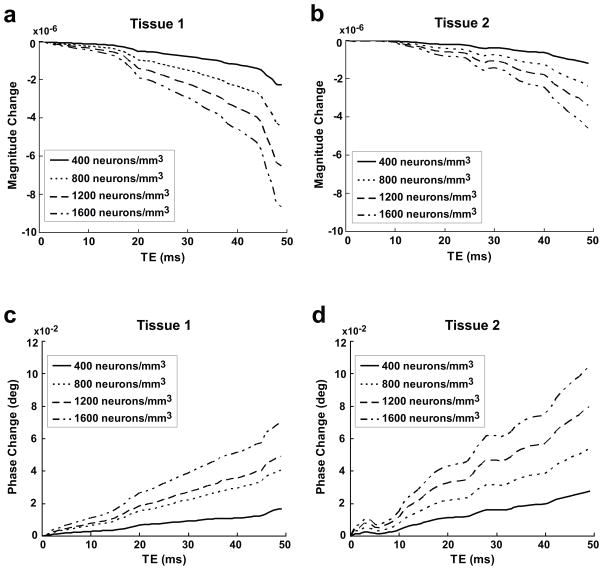
Figure 7 shows the maximum ncMRI signal changes in magnitude and phase as a function of TE for different ρ̄FN. These results indicate that the ncMRI signal changes increase when TE increases, and the magnitude signal increases more rapidly than the phase signal. The results also show that the rate of signal increase with TE is approximately independent of firing neuron density. It is noticed that there are some local perturbations in the curves of ncMRI signal vs. TE (e.g., at TE = 19/28 ms in tissue 1/tissue 2). This phenomenon also appears in the simulation results in the previous ncMRI models (18,19) and it is caused by the back propagation of action potentials (19).
Figure 7.
Dependence of magnitude (a and c) and phase (b and d) ncMRI signal changes on TE for different firing neuron densities (ρ̄FN = 400–1600 neurons/mm3 with interval of 400 neurons/mm3). (a), (c) and (b), (d) show the results of tissue 1 and 2, respectively.
Discussion
In this study, we modeled the ncMRI signal using the morphology and physiology of human neuron for the first time. In this model, we considered the multilayer structure of cortical tissue and the difference of neuron packing density in different cortical layers. Through these improvements, this model would allow us to predict the size and properties of ncMRI signal in human brain in a high accuracy.
The simulation results showed that the size of ncMRI signal increases with the density of synchronously firing neurons (ρ̄FN) (Fig. 4), which depends on the intensity of neuronal activity. In ncMRI experiments on healthy human subjects, two types of neuronal responses can be used to detect ncMRI signal: evoked and spontaneous activity (26). From the previous MEG study (27), it is known that the strength of sensory (e.g., visual) evoked activity is about 2–40 nA·m in terms of equivalent current dipole (ECD). Using the methods described in Cassara’s study (19), we calculated the ECD of neuron 1 and found its peak strength to be 5 pA·m approximately. Thus, a sensory stimulation can activate up to 8000 neurons synchronously. Considering that the cortical area of sensory activation is at least 10 mm2 (28), then the strength of a typical evoked activity will be corresponding to the firing neuron density (ρ̄FN) of 320 neurons/mm3 in this model (tissue thickness = 2.5 mm). For such a ρ̄FN value, the maximum magnitude/phase ncMRI signal at TE = 50 ms will be about −1.4×10⁻⁶/0.02° (see Fig. 4). Obviously, such a small signal is beyond the detection capability of current MRI technology. Compared to the evoked activity, the ECD of spontaneous alpha wave activity (= 100–1000 nA·m) (29) can be over ten times stronger, so the ρ̄FN value for spontaneous activity can be increased by a factor of 10, then the phase ncMRI signal will rise to 0.2°. According to the theory of power analysis (30), it will require about 20 min of scan time with the typical p-threshold (p < 0.001 uncorrected) and imaging conditions (TR = 1 s and temporal phase noise = 1°) to detect this signal. This suggests that successful detection of spontaneous ncMRI activation would be possible in human subjects.
In this model, it is estimated that the evoked (spontaneous) ncMRI signal changes are about 2×10⁻⁶ (2×10⁻⁵) for magnitude and 3×10⁻² (3×10⁻¹) degree for phase (Fig. 4). Then in a typical ncMRI experiment on human subjects (temporal SNR/phase noise ~ 80/1°), the contrast-to-noise ratio (CNR) of phase signal will be approximately 186 times higher than magnitude signal according to the definition of CNR of ncMRI (4). This suggests that phase imaging would be more sensitive to neuronal currents than magnitude imaging. Our results agree with those from the pioneering phantom experiments that used MRI to detect ultra-weak transient magnetic fields (31,32). In contrast, the previous SCD-based ncMRI model claimed that MR magnitude signal is a much better candidate to detect neuronal current induced signal changes as compared to MR phase (15). Due to the oversimplification of neuronal structure and physiological properties, significant errors could be produced in this SCD model. By using the realistic geometry and physiology of human neuron, the simulation accuracy would be substantially improved in the present model. Thus, our results would provide more reliable information regarding the sensitivity of magnitude and phase signals.
The results from this study show that both magnitude (δ) and phase (Δφ) ncMRI signal changes have a linear relationship with the firing neuron density (ρ̄FN) when ρ̄FN < 5000 neurons/mm3 (Fig. 4). The dependence of ncMRI signal on ρ̄FN has been investigated in two previous ncMRI models (15,19). Both models showed that there is linear dependence between Δφ and ρ̄FN, but discrepancy exists between these two models on the results of magnitude signal. Xue’s model (15) indicated that δ also linearly increases with ρ̄FN for a small or moderate ρ̄FN value (number of firing dendrites in the voxel is less than two million), while Cassara’s model (19) estimated that there is an exponential relationship between δ and ρ̄FN. Our simulation results agree with the findings from the former model. Although similar simulation methods are utilized in our and Cassara’s models, the morphological and physiological information of neuron are measured from human cerebral cortex in the present model, while from rat hippocampus in Cassara’s model (19). Since major differences exist between primate and rodent brains in the regularities behind brain morphology and cellular composition (33). The size, shape, and packing density of neuron in human brain may significantly differ from those in rat brain. The spatial and temporal distribution of neuronal currents heavily depends on these neuronal properties. Hence, the difference in these properties for different species would alter the characteristics of ncMRI signal, and this results in the discrepancy between our human ncMRI model and the rat model (19), regarding the dependence of ncMRI signal changes on ρ̄FN.
The magnitude/phase ncMRI signal change is estimated to be on the order of 10−2/1 degree from the realistic ncMRI model based on monkey neuron (18), while only 10−6/10−4 degree from the rat model (19). The ρ̄FN value used in these two models is equivalent to 4×10⁵ and 2083 neurons/mm3, respectively. If it is assumed that a linear relationship exists between ncMRI signal and ρ̄FN (see Fig. 4), when using the same ρ̄FN value, the amplitude of ncMRI signal calculated from the present human model will be comparable to the monkey model (18) but about one hundred times stronger than the rat model (19). The discrepancy between the rat model and our human model can be attributed to two factors: (i) Species difference in neuronal morphology: primate and rodent have different regularities of brain morphology (33), so the geometry of human neurons may differ from that of rat neurons considerably. The amplitude of ncMRI signal heavily relies on the spatial and temporal distribution of NMF, which is governed by the shape of neuron. Hence, the morphological difference between primate and rodent neurons will lead to the difference in their ncMRI signal intensity. (ii) Difference in spatial sampling: a spatial sampling interval of 20 μm was used to calculate the ncMRI signal in the rat model (19), while the present model adopted a smaller sampling interval (5 μm). To evaluate the impact of spatial sampling on the ncMRI signal calculation, we simulated the ncMRI signal in tissue 1 when ρ̄FN = 800 neurons/mm3, using both 5 and 20 μm sampling intervals. The results indicated that the magnitude/phase signal change calculated with 20 μm interval is approximately 22%/8% smaller than that obtained with 5 μm interval. Thus, the difference in spatial sampling would not result in the large discrepancy (100 times of difference) between the rat (19) and the present models. In other words, the species difference in neuronal morphology may be the primary factor that caused the discrepancy.
Our results indicate that the ncMRI signal change depends on the direction of B⃗0 relative to the neuron (Fig. 6). In general, when the angle between B⃗0 and the length axes of neurons (θ) is close to 90°, the ncMRI signal reaches to its maximum value. In cerebral cortex, the neurons are proximately perpendicular to the cortical surface, so the brain areas with cortical surfaces parallel to B⃗0 would produce the largest ncMRI signals. In other words, better detection sensitivity of ncMRI will be attained by choosing the cortical regions parallel to the main magnetic field. In addition, it is also found the extent of signal variation with B⃗0 direction in tissue 1 differs from that in tissue 2. In tissue 1, there exists up to four/six times of difference in the magnitude/phase signal intensities for different B⃗0 directions (Fig. 6a and c), while this difference reaches up to 23/14 times (for magnitude/phase) in tissue 2 (Fig. 6b and d). Since tissue 1 and 2 only differ in their neuronal morphology (i.e., neuron 1 vs. neuron 2), these results suggest that the dependence of ncMRI signal intensity on B⃗0 direction can vary with the geometry of neuron. Also, it is worth mentioning that our results for tissue 1 agree with the findings from the ncMRI model based on monkey neuron (18), which showed that different B⃗0 directions can result in several times of difference in the ncMRI signal.
It is found that the increase of TE can increase the magnitude signal noticeably, while the phase signal elevates with TE more gradually (Fig. 7). If an exponential relationship between ncMRI signal change and TE (δ ∝ (TE)c1 and Δφ ∝ (TE)c2) is assumed, then according to our simulation results, c1 and c2 are approximately equal to 1.7/1.6 and 1.1/1.2, respectively in tissue 1/tissue 2. Furthermore, the firing neuron density has negligible impact on the values of c1 and c2. This suggests that the dependence of ncMRI signal on TE can be affected by the neuronal geometry but it is invariant with ρ̄FN. Also, the relationship between ncMRI signal and TE obtained from this human model is found to be similar to that from the monkey (18) and rat (19) models. By fitting the data from these two models, the values of c1 and c2 were obtained and they are equal to 1.7 and 1.2 approximately in both monkey and rat.
When simulating the ncMRI signal in the multilayer cortical tissues (tissue 1 and 2), to simplify the simulation procedure, the neuron morphology in the tissues are copied from that of a single neuron (neuron 1 and 2). Since the cellular morphology and cortical circuits vary in different cortical layers (22), this simplification may produce error in the estimation of ncMRI signal. To obtain more accurate results, it is necessary to simulate the ncMRI signal using a large-scale model of human cortex, in which the variation of neuronal morphology and the interactions between neurons are fully described. Unfortunately, the complete and quantitative information regarding the neuronal morphology and cortical connections in human brain is still lacking up to date, so we are unable to construct such a large-scale model at the present stage. We will further refine our model when this information is available.
In this model, a voxel size of 1 × 1 × 1 mm3 was used to calculate the ncMRI signal. This is smaller than the spatial resolution typically used in human ncMRI experiments (~ 3 × 3 × 3 mm3). The use of a larger voxel size will reinforce the partial volume effects, which will reduce the intensity of ncMRI signal. Thus, the ncMRI signal changes in a typical human ncMRI experiment would be lower than that estimated by this model. The simulation results from the present model gives the upper limit for the ncMRI signal changes that can be acquired in a human ncMRI experiment.
Conclusions
In conclusion, we established a realistic ncMRI model for human brain tissue. It is found that the intensity of ncMRI signal highly relies on the density of firing neurons and imaging conditions such as TE, the direction of B0 relative to the tissue surface, and position of voxel in the direction of tissue thickness. The results indicated that the ncMRI magnitude and phase signals evoked by physiological stimulation are too weak to be detected in human subjects. Nevertheless, the phase signal induced by spontaneous response could be much stronger than evoked activity and reach up to 0.2°. Hence, the phase ncMRI signal elicited by spontaneous alpha wave activity could be detectable if the optimal experimental conditions are achieved.
Acknowledgments
We thank I. Foster for providing the computer cluster and data storage system used in this study. This work was supported by a NIH grant (RO1 EB004753).
References
- 1.Singh M. Sensitivity of MR phase-shift to detect evoked neuromagnetic fields inside the head. IEEE Transactions on Nuclear Science. 1994;41(1):349–351. [Google Scholar]
- 2.Kamei H, Iramina K, Yoshikawa K, Ueno S. Neuronal current distribution imaging using magnetic resonance. Ieee Transactions on Magnetics. 1999;35(5):4109–4111. [Google Scholar]
- 3.Xiong J, Fox PT, Gao JH. Directly mapping magnetic field effects of neuronal activity by magnetic resonance imaging. Hum Brain Mapp. 2003;20(1):41–49. doi: 10.1002/hbm.10124. [DOI] [PMC free article] [PubMed] [Google Scholar]
- 4.Konn D, Gowland P, Bowtell R. MRI detection of weak magnetic fields due to an extended current dipole in a conducting sphere: a model for direct detection of neuronal currents in the brain. Magn Reson Med. 2003;50(1):40–49. doi: 10.1002/mrm.10494. [DOI] [PubMed] [Google Scholar]
- 5.Chu R, de Zwart JA, van Gelderen P, Fukunaga M, Kellman P, Holroyd T, Duyn JH. Hunting for neuronal currents: absence of rapid MRI signal changes during visual-evoked response. Neuroimage. 2004;23(3):1059–1067. doi: 10.1016/j.neuroimage.2004.07.003. [DOI] [PubMed] [Google Scholar]
- 6.Bianciardi M, Di Russo F, Aprile T, Maraviglia B, Hagberg GE. Combination of BOLD-fMRI and VEP recordings for spin-echo MRI detection of primary magnetic effects caused by neuronal currents. Magn Reson Imaging. 2004;22(10):1429–1440. doi: 10.1016/j.mri.2004.10.009. [DOI] [PubMed] [Google Scholar]
- 7.Liston AD, Salek-Haddadi A, Kiebel SJ, Hamandi K, Turner R, Lemieux L. The MR detection of neuronal depolarization during 3-Hz spike-and-wave complexes in generalized epilepsy. Magn Reson Imaging. 2004;22(10):1441–1444. doi: 10.1016/j.mri.2004.10.017. [DOI] [PubMed] [Google Scholar]
- 8.Chow LS, Cook GG, Whitby E, Paley MN. Investigation of MR signal modulation due to magnetic fields from neuronal currents in the adult human optic nerve and visual cortex. Magn Reson Imaging. 2006;24(6):681–691. doi: 10.1016/j.mri.2006.01.005. [DOI] [PubMed] [Google Scholar]
- 9.Chow LS, Dagens A, Fu Y, Cook GG, Paley MN. Comparison of BOLD and direct-MR neuronal detection (DND) in the human visual cortex at 3T. Magn Reson Med. 2008;60(5):1147–1154. doi: 10.1002/mrm.21753. [DOI] [PubMed] [Google Scholar]
- 10.Parkes LM, de Lange FP, Fries P, Toni I, Norris DG. Inability to directly detect magnetic field changes associated with neuronal activity. Magn Reson Med. 2007;57(2):411–416. doi: 10.1002/mrm.21129. [DOI] [PubMed] [Google Scholar]
- 11.Mandelkow H, Halder P, Brandeis D, Soellinger M, de Zanche N, Luechinger R, Boesiger P. Heart beats brain: The problem of detecting alpha waves by neuronal current imaging in joint EEG-MRI experiments. Neuroimage. 2007;37(1):149–163. doi: 10.1016/j.neuroimage.2007.04.034. [DOI] [PubMed] [Google Scholar]
- 12.Tang L, Avison MJ, Gatenby JC, Gore JC. Failure to direct detect magnetic field dephasing corresponding to ERP generation. Magn Reson Imaging. 2008;26(4):484–489. doi: 10.1016/j.mri.2007.09.003. [DOI] [PMC free article] [PubMed] [Google Scholar]
- 13.Xue Y, Chen X, Grabowski T, Xiong J. Direct MRI mapping of neuronal activity evoked by electrical stimulation of the median nerve at the right wrist. Magn Reson Med. 2009;61(5):1073–1082. doi: 10.1002/mrm.21857. [DOI] [PMC free article] [PubMed] [Google Scholar]
- 14.Rodionov R, Siniatchkin M, Michel CM, Liston AD, Thornton R, Guye M, Carmichael DW, Lemieux L. Looking for neuronal currents using MRI: an EEG-fMRI investigation of fast MR signal changes time-locked to frequent focal epileptic discharges. Neuroimage. 2010;50(3):1109–1117. doi: 10.1016/j.neuroimage.2009.12.076. [DOI] [PubMed] [Google Scholar]
- 15.Xue Y, Gao JH, Xiong J. Direct MRI detection of neuronal magnetic fields in the brain: theoretical modeling. Neuroimage. 2006;31(2):550–559. doi: 10.1016/j.neuroimage.2005.12.041. [DOI] [PubMed] [Google Scholar]
- 16.Park TS, Lee SY, Park JH, Cho MH. Observation of the fast response of a magnetic resonance signal to neuronal activity: a snail ganglia study. Physiol Meas. 2006;27(2):181–190. doi: 10.1088/0967-3334/27/2/008. [DOI] [PubMed] [Google Scholar]
- 17.Heller L, Barrowes BE, George JS. Modeling direct effects of neural current on MRI. Hum Brain Mapp. 2009;30(1):1–12. doi: 10.1002/hbm.20484. [DOI] [PMC free article] [PubMed] [Google Scholar]
- 18.Blagoev KB, Mihaila B, Travis BJ, Alexandrov LB, Bishop AR, Ranken D, Posse S, Gasparovic C, Mayer A, Aine CJ, Ulbert I, Morita M, Muller W, Connor J, Halgren E. Modelling the magnetic signature of neuronal tissue. Neuroimage. 2007;37(1):137–148. doi: 10.1016/j.neuroimage.2007.04.033. [DOI] [PubMed] [Google Scholar]
- 19.Cassara AM, Hagberg GE, Bianciardi M, Migliore M, Maraviglia B. Realistic simulations of neuronal activity: a contribution to the debate on direct detection of neuronal currents by MRI. Neuroimage. 2008;39(1):87–106. doi: 10.1016/j.neuroimage.2007.08.048. [DOI] [PubMed] [Google Scholar]
- 20.Rajkowska G, Miguel-Hidalgo JJ, Wei J, Dilley G, Pittman SD, Meltzer HY, Overholser JC, Roth BL, Stockmeier CA. Morphometric evidence for neuronal and glial prefrontal cell pathology in major depression. Biol Psychiatry. 1999;45(9):1085–1098. doi: 10.1016/s0006-3223(99)00041-4. [DOI] [PubMed] [Google Scholar]
- 21.Hayes TL, Lewis DA. Magnopyramidal neurons in the anterior motor speech region. Dendritic features and interhemispheric comparisons. Arch Neurol. 1996;53(12):1277–1283. doi: 10.1001/archneur.1996.00550120089021. [DOI] [PubMed] [Google Scholar]
- 22.Benavides-Piccione R, Arellano JI, DeFelipe J. Catecholaminergic innervation of pyramidal neurons in the human temporal cortex. Cereb Cortex. 2005;15(10):1584–1591. doi: 10.1093/cercor/bhi036. [DOI] [PubMed] [Google Scholar]
- 23.Hines ML, Carnevale NT. The NEURON simulation environment. Neural Comput. 1997;9(6):1179–1209. doi: 10.1162/neco.1997.9.6.1179. [DOI] [PubMed] [Google Scholar]
- 24.Chitwood RA, Hubbard A, Jaffe DB. Passive electrotonic properties of rat hippocampal CA3 interneurones. J Physiol. 1999;515 ( Pt 3):743–756. doi: 10.1111/j.1469-7793.1999.743ab.x. [DOI] [PMC free article] [PubMed] [Google Scholar]
- 25.Migliore M, Shepherd GM. Emerging rules for the distributions of active dendritic conductances. Nat Rev Neurosci. 2002;3(5):362–370. doi: 10.1038/nrn810. [DOI] [PubMed] [Google Scholar]
- 26.Hagberg GE, Bianciardi M, Maraviglia B. Challenges for detection of neuronal currents by MRI. Magn Reson Imaging. 2006;24(4):483–493. doi: 10.1016/j.mri.2005.12.027. [DOI] [PubMed] [Google Scholar]
- 27.Portin K, Salenius S, Salmelin R, Hari R. Activation of the human occipital and parietal cortex by pattern and luminance stimuli: neuromagnetic measurements. Cereb Cortex. 1998;8(3):253–260. doi: 10.1093/cercor/8.3.253. [DOI] [PubMed] [Google Scholar]
- 28.Lu ZL, Williamson SJ. Spatial extent of coherent sensory-evoked cortical activity. Exp Brain Res. 1991;84(2):411–416. doi: 10.1007/BF00231463. [DOI] [PubMed] [Google Scholar]
- 29.Tesche C, Kajola M. A comparison of the localization of spontaneous neuromagnetic activity in the frequency and time domains. Electroencephalogr Clin Neurophysiol. 1993;87(6):408–416. doi: 10.1016/0013-4694(93)90155-o. [DOI] [PubMed] [Google Scholar]
- 30.Murphy K, Bodurka J, Bandettini PA. How long to scan? The relationship between fMRI temporal signal to noise ratio and necessary scan duration. Neuroimage. 2007;34(2):565–574. doi: 10.1016/j.neuroimage.2006.09.032. [DOI] [PMC free article] [PubMed] [Google Scholar]
- 31.Bodurka J, Jesmanowicz A, Hyde JS, Xu H, Estkowski L, Li SJ. Current-induced magnetic resonance phase imaging. J Magn Reson. 1999;137(1):265–271. doi: 10.1006/jmre.1998.1680. [DOI] [PubMed] [Google Scholar]
- 32.Bodurka J, Bandettini PA. Toward direct mapping of neuronal activity: MRI detection of ultraweak, transient magnetic field changes. Magn Reson Med. 2002;47(6):1052–1058. doi: 10.1002/mrm.10159. [DOI] [PubMed] [Google Scholar]
- 33.Herculano-Houzel S, Collins CE, Wong P, Kaas JH. Cellular scaling rules for primate brains. Proc Natl Acad Sci U S A. 2007;104(9):3562–3567. doi: 10.1073/pnas.0611396104. [DOI] [PMC free article] [PubMed] [Google Scholar]


