

Abstract
Extensive site-specific glycosylation analysis of individual glycoproteins is difficult due to the nature and complexity of glycosylation in proteins. In protein mixtures, these analyses are even more difficult. We present an approach combining non-specific protease digestion, nano-flow liquid chromatography and tandem mass spectrometry (MS/MS) aimed at comprehensive site-specific glycosylation analysis in protein mixtures. The strategy described herein involves the analysis of a complex mixture of glycopeptides generated from immobilized-pronase digestion of a cocktail of glycoproteins consisting of bovine lactoferrin, kappa casein and bovine fetuin using nano-flow liquid chromatography coupled with quadrupole time-of-flight mass spectrometry (nano-LC/Q-TOF MS). The resulting glycopeptides were chromatographically separated on a micro fluidic chip packed with porous graphitized carbon and analyzed via MS and MS/MS analyses. In all, 233 glycopeptides (identified based on composition and including isomers) corresponding to 18 glycosites were observed and determined in a single mixture. The glycopeptides were a mixture of N-linked glycopeptides (containing high mannose, complex and hybrid glycans) and O-linked glycopeptides (mostly sialylated). Results from this study were comprehensive as detailed glycan micro-heterogeneity information was obtained. This approach presents a platform to simultaneously characterize N- and O-glycosites in the same mixture with extensive site heterogeneity.
Keywords: Site-specific glycosylation, protein mixtures, immobilized-pronase, glycopeptides, nano-LC/Q-TOF MS, tandem MS, N-glycosites, O-glycosites
Introduction
Glycosylation is an important and common form of post-translational modification (PTM) in proteins and involves the enzymatic attachment of glycans to asparagine (N-linked glycans) and serine or threonine (O-linked glycans).1 With over 50% of proteins believed to be potentially glycosylated, 1,2 glycosylation in proteins has been reported to have wide structural and functional roles.3–9 Hence, there is considerable interest to improve strategies aimed at comprehensive characterization of glycosylation in proteins, particularly in protein mixtures.
The analysis of glycosylation in proteins can be achieved with several levels of detail. The most simple and direct analysis is the release of the glycans from the protein followed by mass spectrometric (MS) analysis.10 This method provides protein-specific glycosylation, however it provides no information on the specific sites of glycosylation. Site-specific glycosylation is a more difficult task, but can be partly achieved by methods that employ lectins or reactive beads that enrich specifically for glycopeptides after trypsin digestion.11–25 The general procedure for determining site-specific glycosylation analysis in a protein employs a combination of steps including proteolysis, fractionation and MS analysis.26–31 First the glycoprotein is digested with a specific protease (such as trypsin) to generate a mixture of unglycosylated peptides and glycosylated peptides. Next is a fractionation step to enrich the glycopeptides from the peptide pool. The peptides are often far more abundant than glycopeptides with the former potentially suppressing ionization of the latter.13, 32 Once enriched, the glycopeptides are subjected to MS analysis with the aim of determining both the glycan and peptide moieties. While this technique provides site occupancy, it is laborious and often provides limited information on the glycans associated with each site. There are several reasons for the limited glycan information obtained with this approach. Many glycoproteins are resistant to tryptic digestion 33–36 and often produce missed cleavages 37 that result in large glycopeptides. The large glycopeptides may contain multiple glycosites that lead to ambiguity in glycosite assignments and/or may not fragment readily under common CID conditions.
The use of non-specific protease is becoming more acceptable as it provides more detailed site micro-heterogeneity.38 Tandem MS is useful for confirming composition when several possible combinations are possible. Tandem MS is more effective because the glycopeptide products are smaller and more amenable to CID fragmentation. This method has been shown to be highly effective and has been used to determine both N- and O-glycosylation sites.38–42 This method, however, has been limited to the analysis of single proteins. Mixtures of glycoproteins present a problem because high mass accuracy is insufficient when there are several glycoproteins as they increase significantly the number of glycopeptide possibilities that can correspond to a single mass. The development of a successful method for achieving site-specific glycosylation analysis in mixtures containing a few proteins is important, as there is a need for the extensive analysis of pre-fractionated proteins in, for example, biomarker discovery and in protein networks involving protein-protein interactions. Despite the need, extensive analyses of protein mixtures to yield comprehensive site-specific glycosylation with extensive heterogeneity have remained a distant goal.
In this report, we describe a chip-based nano-LC MS and MS/MS approach for separating, detecting and characterizing complex mixtures of glycopeptides generated from bead-immobilized pronase digestion of a cocktail of glycoproteins consisting of bovine lactoferrin (N-glycosylated), kappa casein (O-glycosylated) and bovine fetuin (N- and O-glycosylated). The proteins were selected as their glycosylation is well studied and each has multiple glycosites.39,41,43,44 Hence, we anticipated that pronase digestion of this cocktail of glycoproteins would yield a complex mixture of N- and O-linked glycopeptides suitable for this study, thereby providing simultaneous N- and O-glycosites. The resultant glycopeptides were separated and compositionally elucidated with nano-LC MS/MS, where product ion spectra were acquired data-dependently. Glycopeptide product ion spectra were sorted by the presence of carbohydrate-specific fragment ions such as sugar oxonium ions including m/z 204 (HexNAc + H)+, m/z 163 (Hex + H)+ and m/z 366 (HexNAc + Hex + H)+. The glycan moieties of the glycopeptides were determined by the presence of B-type and Y-type ions derived from the sequence of glycan fragmentations in the product ion spectra. An in-house tool, the Glycopeptide finder, was used to achieve rapid glycopeptide assignment. Such assignments were then verified to ensure correlation with glycan and peptide compositional information obtained from the MS/MS data. In general, the tandem MS provided limited peptide information. However, owing to the non-specific nature of the pronase digestion, glycopeptides containing peptide tags of varying lengths (for the same or different glycan moieties) were generated. These digest products were used as secondary verification of the assigned glycosites, while the peptide sequence yielded protein identification. Owing to its ability to separate and simultaneously analyze N- and O-glycopeptides from a protein mixture in a single analysis, the adopted approach demonstrates a rapid, yet highly sensitive tool for glycoproteomic studies.
Materials and Methods
Materials and Reagents
Pronase E proteases, cyanogen bromide (CNBr) activated sepharose 4B (S4B) beads, bovine lactoferrin, bovine kappa casein and bovine fetuin were all obtained from Sigma Aldrich (St. Louis, MO). Graphitized carbon cartridges were purchased from Grace Davison Discovery Sciences (Deerfield, IL). All chemicals used were either of analytical grade or better.
Pronase Digestion and Glycopeptide Cleanup
The site-specific glycosylation analysis workflow of the protein cocktail mixture is shown in Figure 1. Pronase E was covalently coupled to CNBr activated sepharose beads via a well-established coupling chemistry 45 and as earlier reported in our laboratory.40–41 A cocktail glycoprotein solution was added to the prepared pronase-beads and incubated at 37°C for a 24 hour period. The resulting glycopeptide digests were desalted and enriched via solid phase extraction (SPE) on a graphitized carbon cartridge (GCC) as described previously.38 After the enrichment step, a clean mixture of glycopeptides was eluted with 20% acetonitrile (ACN) in water (v/v) and 0.05% trifluoroacetic acid (TFA) in 40% ACN in water (v/v). Each glycopeptide fraction enriched by GCC was completely dried in a vacuum centrifuge. The fraction was later reconstituted to yield a concentration of approximately 7 μg/μL. For the analysis, a 2 μL of the glycopeptide solution (~15 μg of total glycoprotein mixture) was injected into the LC/MS. For these experiments, a stock solution of glycopeptide mixture was used. However, the current sensitivity of the method allows analysis of a mixture obtained from a gel spot observable by coomassie blue stain.
Figure 1.
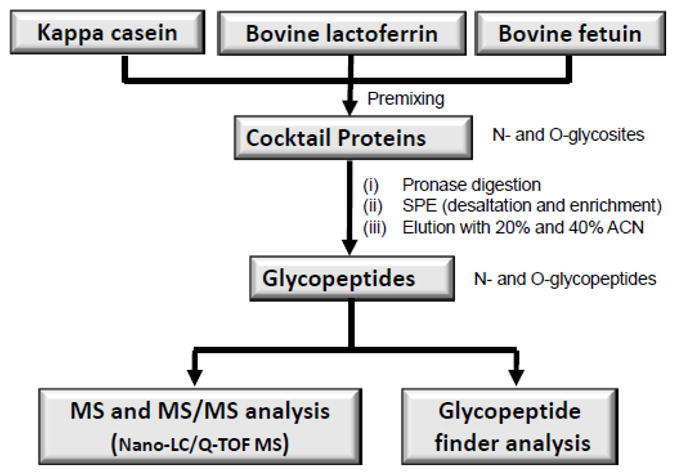
Work Scheme for the generation and analysis of a complex mixture of N- and O-glycopeptides generated from pronase digestion of a cocktail of glycoproteins.
Instrumentation
The glycopeptide solutions were analyzed using an Agilent 1200 series LC system coupled to an Agilent 6520 Q-TOF mass spectrometer (Agilent Technologies, Santa Clara, CA). The HPLC-Chip/Q-TOF system was equipped with a micro well-plate auto sampler (maintained at 6°C by the thermostat), a capillary loading pump for sample enrichment, a nano pump as the analytical pump for sample separation, HPLC-Chip Cube, and the Agilent 6520 Q-TOF MS detector. The tandem mass spectra of the glycopeptides were acquired in a data-dependent manner following LC separation on the microfluidic chip. The microfluidic chip consisted of a 9 × 0.075 mm i.d. enrichment column and a 150 × 0.075 mm i.d. analytical column, both packed with 5 μm porous graphitized carbon (PGC) as the stationary phase. PGC chip was used as peptide populations that carry a heterogeneous carbohydrate moiety cannot separate on C8 or C18 stationary phases. Both pumps use binary solvent: A, 3.0% ACN/water (v/v) with 0.1% formic acid; B, 90% ACN/water (v/v) with 0.1% formic acid. A flow rate of 4 μL/min of solvent A was used for sample loading with 2 μL injection volume. A nano pump gradient was delivered at 0.4 μL/min using (A) 0.1% formic acid in 3.0% ACN/water (v/v) and (B) 0.1% formic acid in 90.0% ACN/water (v/v). Samples were eluted with 0% B (0.00–2.50 min); 0 to 16% B (2.50–20.00 min); 16 to 44% B (20.00–30.00 min); 44 to 100% B (30.00–35.00 min) and 100% B (35.00–45.00 min). The drying gas temperature was set at 325 °C with a flow rate of 4 L/min (2 L of filtered nitrogen gas and 2 L of filtered dry grade compressed air). MS and MS/MS spectra were acquired in the positive ionization mode with an acquisition time of 1587 milliseconds per spectrum and acquisition rate of 0.63 spectra per second. Also, while the MS data was acquired over a mass range of 400–3000 m/z, the MS/MS data was acquired over 50–3000 m/z mass range. Mass calibration was enabled using reference masses of m/z 622.029, 922.010, 1221.991, 1521.972, 1821.952, 2121.933, 2421.914 and 2721.895 (ESI-TOF Tuning Mix G1969–85000, Agilent Technologies, Santa Clara, CA). Data analysis was performed on Agilent Mass Hunter (Agilent Technologies Inc.). For the MS/MS analysis, glycopeptides were subjected to collision induced fragmentation with nitrogen as the collision gas using a series of collision energies that were dependent on the m/z values of the different glycopeptides. The collision energies correspond to voltages (Vcollision) that were based on the equation: Vcollision = m/z (1.8/100 Da) Volts – 2.4 Volts; where the slope and offset of the voltages were set at (1.8/100 Da) and (- 2.4) respectively. The preferred charge states were set at 2, 3, >3 and unknown.
Data Processing
The mass list of the glycopeptide precursor ions from the MS/MS analysis was analyzed with our in-house software GP finder for rapid glycopeptide assignment. The GP finder is an improvement on the previously developed GlycoX 46, offering several new features including biological filters to reduce false-positive hits, support for protein mixture analysis, faster run-time, and a significantly improved user interface. All glycopeptide assignments were made within a specified tolerance level (≤ 20ppm). Each glycopeptide identity was further verified by tandem mass spectrometry (MS/MS) for detailed structural information.
Results and Discussions
Glycopeptide Assignment
Glycopeptide assignments were achieved by a combination of the information from the MS/MS data and the analysis of the precursor ion masses of the investigated glycopeptides with the GP finder. Particularly, glycan compositional information (N-linked vs. O-linked) obtained from the tandem mass spectra of individual glycopeptides was used in verifying assignments made with the GP finder to ensure correlation and eliminate false assignments. It is imperative to note that in some cases, multiple assignments were obtained for some glycopeptide masses during the GP finder analysis. In such cases, the tandem mass spectra of the investigated glycopeptides were further inspected with emphasis on the information from the glycan and peptide fragmentations. Typically, information from the glycan fragmentation helps eliminate many false positive assignments from the GP finder analysis. Since each glycopeptide assignment was associated with an error less than 20 ppm, it was unwise to determine, without ambiguity, the true identity of glycopeptides solely by accurate mass measurement. MS/MS data served as a more reliable means of making non-ambiguous assignments.
Liquid Chromatography Mass Spectrometry (LC/MS)
Previous studies from our group on the analysis of released glycans revealed an earlier elution of neutral glycans prior to sialylated glycans on a graphitized carbon cartridge during the SPE step.47 In line with this observation and owing to the anticipated complexity of the glycopeptides that stems from the multiple glycosites on multiple glycoproteins, the glycopeptides were fractionated into two through elution from the SPE with 20% ACN and 40% ACN. LC/MS chromatograms for the protein mixture composed of the three glycoproteins (bovine lactoferrin, kappa casein, and bovine fetuin) resulting in a mixture of N- and O-glycosylated peptides was obtained for each of the two elution fractions from the SPE step. The advantage of pronase digestion is that there are no large peptides in the mixtures, and the chromatogram corresponds primarily to glycopeptides. Figure 2A is representative of the extracted compound chromatogram (ECC) of glycopeptides eluted with the 20% ACN during the SPE fractionation step. The result shown in Figure 2A revealed that short peptide tags (3 to 5 amino acids) connected to high mannose type glycans (GlcNAc2Man5-9) were observed eluting ahead of longer peptide-containing glycopeptides (6 to 7 amino acids). These high mannose-containing glycopeptides were later identified as that from lactoferrin (represented in Figure 2A with peaks shaded in pink). Other lactoferrin glycopeptides with complex and hybrid type glycans were also observed (also represented with pink shaded peaks). In addition to the bovine lactoferrin glycopeptides observed in Figure 2A, glycopeptides corresponding to kappa casein (peaks shaded in green) and bovine fetuin (peaks shaded in blue) were also observed. Figure 2B represents the extracted compound chromatogram (ECC) of glycopeptides eluted with the 40% ACN fraction of the SPE fractionation step. Unlike in Figure 2A, the glycopeptides observed in the 40% ACN fraction (Figure 2B) predominantly corresponded to O-linked glycopeptides from kappa casein (peaks shaded in green) and bovine fetuin (peaks shaded in blue). Most of the glycopeptides observed in the 40% ACN fraction were sialylated with some observed as multi-sialylated species. The assignments made in Figure 2 were made using accurate mass measurement and MS/MS analysis as discussed below.
Figure 2.

Figure 2A: Extracted compound chromatogram (ECC) of glycopeptides eluted with the 20% ACN fraction of the SPE fractionation step. Figure 2B: Extracted compound chromatogram (ECC) of glycopeptides eluted with the 40% ACN fraction of the SPE fractionation step. Glycosites corresponding to each assigned glycopeptide are highlighted in bolder font to distinguish them.
Tandem MS and Spectra Sorting
During the CID experiments, individual glycopeptides were subjected to single collision energies (SCE) that were dependent on their m/z values. It should be noted that the glycopeptide ions were observed as diprotonated species (M + 2H)2+. The CID data revealed detailed glycan compositional information for each glycopeptide investigated. Tandem mass spectra of the glycopeptides primarily resulted in glycosidic bond fragmentation; providing B- and Y-type ions (upper case letters are for glycans and lower case are for peptides). However minor peptide fragmentation resulting in informative b- and y-ions, following the nomenclature of Roepstorff and Fohlman, 48 were observed in some spectra. Hence, glycopeptides were characterized based on a combination of the information from the MS/MS data and accurate mass measurement from the time-of-flight instrument.
Since the use of pronase results in non-specific digestion of peptide bonds, glycopeptides containing the same glycans but differing in their peptide tag lengths and sequence were expected. This observation was useful in that it complemented the limited peptide fragmentations obtained from the CID experiments as secondary peptide sequencing of the peptide moieties of glycopeptides was achieved. Unlike these results obtained from pronase digestion, a limitation with the use of specific proteases is that in the absence of missed cleavages, there is only one copy of a particular glycopeptide or glycoform to be analyzed. Hence, there is an increased risk of losing glycoform information during tryptic glycopeptide analysis. Table 1 shows a list of glycopeptides belonging to the same family of glycans (glycopeptides containing the same glycans but connected to varying peptide lengths and sequences). It is imperative to note that for these glycopeptides belonging to the same families of glycans, a trend of longer retention times was observed with increasing peptide lengths. As an example, glycopeptides containing five hexose and two HexNAc residues (HexNAc2 + Hex5) were found connected to (IV495NQ), (LIV495NQ), (LIV495NQT) and (GLIV495NQ) with retention times of 15.8 min, 17.7 min, 18.0 min and 18.2 min respectively. This phenomenon can be attributed to the additional interactions of the peptide tags with the PGC chip during the LC/MS analysis.
Table 1.
List of glycopeptides belonging to the same glycan families. Glycopeptides are grouped into unique classes based on similar glycan compositions and varying peptide lengths and sequence.
| GP mass (Da) | Retention time (mins) | Hexose | HexNAc | Neu5Ac | Glycosite | Peptide sequence | Peptide mass (Da) | Error (ppm) | Source protein |
|---|---|---|---|---|---|---|---|---|---|
| 1620.588 | 15.3 | 5 | 2 | 0 | Asn - 387 | SGQN | 386.155 | 0.6 | b-LF |
| 1719.655 | 14.9 | 5 | 2 | 0 | Asn - 387 | SGQNV | 485.223 | 1.3 | b-LF |
| 1748.635 | 15.8 | 5 | 2 | 0 | Asn - 387 | QSGQN | 514.214 | 7.0 | b-LF |
|
| |||||||||
| 2280.835 | 13.3 | 9 | 2 | 0 | Asn - 387 | GQNV | 398.191 | 0.4 | b-LF |
| 2367.862 | 13.5 | 9 | 2 | 0 | Asn - 387 | SGQNV | 485.223 | 2.5 | b-LF |
|
| |||||||||
| 1688.681 | 15.8 | 5 | 2 | 0 | Asn - 495 | IVNQ | 454.254 | 3.7 | b-LF |
| 1801.763 | 17.7 | 5 | 2 | 0 | Asn - 495 | LIVNQ | 567.338 | 4.7 | b-LF |
| 1902.806 | 18.0 | 5 | 2 | 0 | Asn - 495 | LIVNQT | 668.386 | 7.2 | b-LF |
| 1858.787 | 18.2 | 5 | 2 | 0 | Asn - 495 | GLIVNQ | 624.360 | 3.3 | b-LF |
|
| |||||||||
| 1739.627 | 13.3 | 6 | 2 | 0 | Asn - 495 | NQT | 343.149 | 5.0 | b-LF |
| 1850.733 | 16.1 | 6 | 2 | 0 | Asn - 495 | IVNQ | 454.254 | 4.0 | b-LF |
| 1951.790 | 16.5 | 6 | 2 | 0 | Asn - 495 | IVNQT | 555.302 | 0.9 | b-LF |
| 1963.806 | 18.0 | 6 | 2 | 0 | Asn - 495 | LIVNQ | 567.338 | 9.1 | b-LF |
| 2064.861 | 18.5 | 6 | 2 | 0 | Asn - 495 | LIVNQT | 668.386 | 5.4 | b-LF |
| 2020.836 | 19.0 | 6 | 2 | 0 | Asn - 495 | GLIVNQ | 624.360 | 5.1 | b-LF |
| 2121.881 | 19.2 | 6 | 2 | 0 | Asn - 495 | GLIVNQT | 725.407 | 5.8 | b-LF |
|
| |||||||||
| 1212.538 | 18.8 | 1 | 1 | 1 | Thr - 142 | IPTIN | 538.311 | 9.2 | k-CN |
| 1543.676 | 25.1 | 1 | 1 | 1 | Thr - 142 | TEIPTINT | 869.449 | 7.4 | k-CN |
|
| |||||||||
| 1424.561 | 22.4 | 1 | 1 | 2 | Thr - 186 | TSTAV | 459.233 | 3.8 | k-CN |
| 1424.561 | 22.8 | 1 | 1 | 2 | Thr - 186 | VTSTA | 459.233 | 3.8 | k-CN |
To obtain further information on the peaks in the chromatogram in Figure 2A and 2B, the tandem MS spectra resulting from the peaks in the chromatogram were examined. Under our optimized conditions, glycopeptide CID spectra share a group of common characteristic glycan fragment ions. They include B-type ions with m/z 204 (HexNAc + H)+, m/z 163 (Hex + H)+, and m/z 366 (HexNAc + Hex + H)+. With sialylation, m/z 292 (Neu5Ac + H)+, m/z 274 (Neu5Ac - H2O + H)+ and m/z 657 (HexNAc + Hex + Neu5Ac + H)+ are also present. Upon identifying a glycopeptide MS/MS spectrum based on its component diagnostic peaks, the next step was to deconvolute the spectrum using the Agilent Mass Hunter software. In addition to B-type ions, Y-type ions resulting from the neutral losses of monosaccharides and disaccharides from the glycan moieties of glycopeptides were observed in the MS/MS data. Following the sequential neutral losses of monosaccharides, the CID data also revealed the (peptide + HexNAc1) and peptide peaks. In addition to these common pattern of fragmentation observed in the CID data, unique fragment ions were observed for the different glycopeptide types investigated. Interestingly, such unique fragment ions were found to correlate with the different types of glycans (high mannose, complex, hybrid and sialylated) connected to their respective peptide tags. These observations have the potential for application towards rapid identification and subsequent characterization of target glycopeptides in a pool of numerous glycopeptide CID spectra.
LC/MS/MS Analysis of High Mannose Glycan-containing Glycopeptides
Unique to glycopeptides containing high mannose glycans are B-type ions corresponding to m/z 325 (2Hex, observed as 324 Da peaks in the deconvoluted spectra). In addition to the 324 Da disaccharide peak, high mannose-containing glycopeptides reveal CID data containing a series of B-type ions differing in mass by ~ 162 Da (hexose residue) that were found to correspond to (HexNAc + Hex1-9). These ions are due to the neutral loss of the (HexNAc + peptide) from the glycopeptide precursor ions. These series of peaks include those observed as 365 Da, 527 Da, 689 Da, 851 Da, 1013 Da, 1175 Da, 1337 Da, 1499 Da, 1661 Da, which correspond to the neutral masses of (HexNAc + Hex), (HexNAc + Hex2), (HexNAc + Hex3), (HexNAc + Hex4), (HexNAc + Hex5), (HexNAc + Hex6), (HexNAc + Hex7), (HexNAc + Hex8) and (HexNAc + Hex9) respectively.
Figure 3A represents the deconvoluted MS/MS data for a diprotonated high mannose-containing bovine lactoferrin glycopeptide with m/z 1018.83 corresponding in mass to (252NNS + GlcNAc2 + Man8 + 2H)+2. Y-type ions corresponding to sequential neutral losses of eight hexose residues (~ 162 Da each) and two HexNAc residues (~ 203 Da each) were observed in the spectrum. As earlier stated, a series of B-type ions of (HexNAc + Hex1-8) were also observed further verifying the assigned glycopeptide. The loss of 87.08 Da from the (NNS + HexNAc) peak corresponds to a b2 peptide fragmentation involving a serine residue loss. This loss indicates a terminal serine residue on the peptide moiety and partly verifies the peptide assignment made from the GP finder analysis.
Figure 3.

Figures 3A and 3B: Deconvoluted MS/MS spectra of two high mannose glycan-containing N-linked glycopeptides from bovine lactoferrin. Green circles (
 ) and blue squares (
 ) represent mannose and GlcNAc residues, respectively.
Another diprotonated high mannose-containing bovine lactoferrin glycopeptide with m/z 845.35 corresponding in mass to (IV495NQ + GlcNAc2 + Man5 + 2H)+2 shows similar pattern of fragmentation (Figure 3B). Again, a series of B-type ions corresponding to (HexNAc + Hex1-5) were observed in the CID data in addition to the series of Y-type ions from the neutral losses of hexose residues from this mannose-containing glycopeptide. Two informative peptide fragmentations were observed in this MS/MS data. First, a terminal isoleucine residue loss was observed as a y3 peptide fragmentation from the glycopeptide precursor peak. A second peptide fragmentation from the (IV495NQ + HexNAc) peak involving the N-terminal dipeptide loss of isoleucine and valine residues (combined mass of 212.15 Da) further verifies the assigned peptide moiety. The two spectra (Figure 3A and 3B) and other high mannose glycan-containing glycopeptide MS/MS data had peaks corresponding to two hexose residues (~ 324 Da). Hence, the 324 Da peak could be used as a diagnostic peak for particularly identifying high mannose glycopeptides from a pool of other glycopeptides.
LC/MS/MS Analysis of Complex and Hybrid Glycan-containing Glycopeptides
Particularly unique to glycopeptides containing complex or hybrid glycans are B-type ions corresponding to m/z 407 (2HexNAc, observed as 406 Da peaks in the deconvoluted spectra). With high mannose glycans, the monosaccharides beyond the trimannosyl core structure are exclusively mannose residues. However, with complex glycans, non-mannose type residues including sialic acid, galactose, fucose and GlcNAc are found beyond the trimannosyl core. For hybrid glycans, the features are a combination of those from the high mannose and complex glycan types. Figure 4A, 4B and 4C represent the deconvoluted MS/MS data for three diprotonated bovine lactoferrin glycopeptides with m/z 1053.95, m/z 1089.97 and m/z 1052.46. These glycopeptides correspond in mass to (GDVAFVK495N + GlcNAc3 + Man4 + 2H)+2, (GLIV495N + GlcNAc5 + Hex4 + 2H)+2 and (GLIV495N + GlcNAc4 + Hex4 + 2H)+2 respectively. While Figure 4A and 4B represent CID data involving examples of complex glycan-containing lactoferrin glycopeptides, Figure 4C shows an example with a hybrid glycan-containing lactoferrin glycopeptide.
Figure 4.

Figures 4A, 4B and 4C: Deconvoluted MS/MS spectra of three complex/hybrid glycan-containing N-linked glycopeptides from bovine lactoferrin. Green circles (
), yellow circles (
 ) and blue squares (
) represent mannose, galactose and GlcNAc residues, respectively.
) and blue squares (
) represent mannose, galactose and GlcNAc residues, respectively.
Particularly, the result from Figure 4C shows fragmentations indicative of hybrid rather than complex type glycans. The loss of two HexNAc residues (combined mass of 406.11 Da) from the glycopeptide precursor peak prior to the loss of a hexose residue (162.13 Da) clearly reveals a hybrid type glycan and not a complex type glycan. With the assumption of a complex type glycan for this glycopeptide, the fourth hexose residue (non-trimannosyl core hexose) would be attached to one of the antennae HexNAc residues (non-trimannosyl core HexNAc). To justify such assumption, one hexose, one HexNAc or the disaccharide (HexNAc + Hex) would be the first series of fragments from the glycan moiety of such glycopeptide. This was not the case in Figure 4C as no hexose residue or (HexNAc + Hex) disaccharide was directly lost from the precursor peak. However, examples with complex glycan-containing glycopeptide are observed in Figure 4A and 4B. This is evident from the neutral loss of a hexose residue (Figure 4A) and the (HexNAc + Hex) disaccharide (Figure 4B) from the glycopeptide precursor ion peaks.
Bovine lactoferrin is known to contain high mannose glycans, and results from this study support this claim as numerous lactoferrin glycopeptides containing high mannose glycans were found. However, despite the analysis of the lactoferrin glycopeptides amidst other glycopeptides from the protein mixture, some lactoferrin glycopeptides were found containing complex and hybrid type glycans (as shown in Figure 4A, 4B and 4C). This observation underscores the ability of the adopted strategy involving LC and MS/MS to serve as enrichment for even low abundant glycoforms in the mixture. Such low abundant glycoforms might not be easily detected in a non-LC/MS system. These three spectra (Figure 4A, 4B and 4C) and other complex and hybrid glycan-containing glycopeptide MS/MS data contained the 406 Da peak in their deconvoluted data. Hence, the 406 Da peak could be used as a diagnostic peak for identifying complex or hybrid glycan-containing glycopeptides from a pool of other glycopeptides. The glycan structures shown in Figure 4B and 4C are putative as other possible structures exist and would require additional analysis to confirm the actual structure.
Sialylated N-glycopeptides from fetuin were observed in the MS analysis, but did not yield abundant tandem MS data. However, for the sialylated O-glycopeptides, the tandem MS data were of high quality (See below). We believe the poor quality CID data for the sialylated N-glycopeptides was due to the large ions, many contained up to three sialic acids, and insufficient energies for the CID process. The CID conditions favored the smaller ions, while raising the collision energy provided better tandem MS for the larger ions but yielded poorer spectra for the smaller ions. To address this issue in future experiments, we are in the process of incorporating multiple energies including both low and high energies, simultaneously, during a single run. This capability will be incorporated in future workflows.
Previous studies have shown that certain diagnostic ions could be used to detect the presence of glycosylation.34,49 Table 2 is a list of diagnostic ions and N-linked glycopeptide types where they are frequently observed based on the MS/MS data obtained from this study. Here, we have included additional diagnostic ions observed during glycopeptide MS/MS analysis that have not been widely reported. A careful examination of the peaks corresponding to these diagnostic ions in a glycopeptide MS/MS data would be useful as a means for rapid identification of a glycopeptide type. The search for such diagnostic ions can be a valuable means for sorting out specific glycopeptide types particular while analyzing very complex mixtures of glycopeptides.
Table 2.
List of diagnostic ions and corresponding N-glycopeptide types containing such ions.
| m/z (Da) | Diagnostic ions | N-linked glycopeptides | ||
|---|---|---|---|---|
| High mannose | Complex | Hybrid | ||
| 163 | (Hex + H)+ | √ | √ | √ |
| 204 | (HexNAc + H)+ | √ | √ | √ |
| 366 | (HexNAc + Hex + H)+ | √ | √ | √ |
| 325 | (Hex2 + H)+ | √ | - | - |
| 407 | (HexNAc2 + H)+ | x | √ | √ |
| 528 | (HexNAc + Hex2 + H)+ | √ | - | - |
| 690 | (HexNAc + Hex3 + H)+ | √ | - | - |
| 852 | (HexNAc + Hex4 + H)+ | √ | - | - |
| 1014 | (HexNAc + Hex5 + H)+ | √ | - | - |
| 1176 | (HexNAc + Hex6 + H)+ | √ | - | - |
| 1338 | (HexNAc + Hex7 + H)+ | √ | - | - |
| 1550 | (HexNAc + Hex8 + H)+ | √ | - | - |
| 1662 | (HexNAc + Hex9 + H)+ | √ | - | - |
LC/MS/MS Analysis of Sialylated O-glycopeptides
Unlike with the N-glycopeptides, most O-glycopeptides analyzed in this mixture contain short sialylated glycans with 2 to 6 monosaccharide residues. Hence, with sialylation, B-type ions corresponding to neutral masses of ~ 291 Da (Neu5Ac) and ~ 273 Da (Neu5Ac – H2O) were consistently present in the deconvoluted MS/MS data of such O-glycopeptides. Also, the trisaccharide peak (HexNAc + Hex + Neu5Ac) with a neutral mass of ~ 656 Da was present in most sialylated O-glycopeptide CID spectra observed. Owing to the fact that sialic acid is a labile residue and that they typically reside in the terminal position, the Y-type ions resulting from the CID data of sialylated O-glycopeptides typically correspond to the initial loss of the terminal sialic acid(s). However, in some cases, non-sialic acid residues were observed as the first series of fragmentation from the glycopeptide precursor peak despite the precursor ion containing at least one sialic acid residue. These fragments reveal the actual connection of the sialic acid to specific monosaccharide residues in the glycan moiety of the glycopeptide.
Figure 5A, 5B and 5C are examples of deconvoluted O-glycopeptide MS/MS data. Figure 5A represents an example with a di-sialylated O-glycopeptide from bovine fetuin with m/z 1027.40 corresponding in mass to (AEAP271SAVP + GalNAc2 + Gal2 + Neu5Ac2 + 2H)+2. Figure 5B and 5C represent MS/MS data for compositionally identical mono-sialylated O-glycopeptides from kappa casein with m/z 772.85 both corresponding in mass to (TEIP142TINT + GalNAc1 + Gal1 + Neu5Ac1 + 2H)+2. Interestingly, the CID data in both Figure 5B and 5C revealed some unique peaks corresponding to the two connection possibilities of the sialic acid. Figure 5B represents the case with a 453.13 Da peak (Hex + Neu5Ac) and a Neu5Ac (~ 291 Da) neutral loss from the glycopeptide precursor peak. Figure 5C on the other hand represents the case with a 494.17 Da peak (HexNAc + Neu5Ac) and a hexose (~ 162 Da) neutral loss from the glycopeptide precursor peak. These observations suggest the two species are isomers with one sialic acid bound to a Hex while the other is bound to a HexNAc. In general, sialylated glycopeptides contain fragments due to sialic acids, namely m/z 273 and 291, providing rapid identification of these species.
Figure 5.

Figures 5A, 5B and 5C: Deconvoluted MS/MS spectra of three sialylated O-linked glycopeptides. Figure 5A represents the MS/MS data for an O-linked glycopeptide from bovine fetuin while figure 5B and 5C represent the MS/MS data for an isomeric O-linked glycopeptide from kappa casein. Yellow circles (
), yellow rectangles (
 ) and purple diamond symbols (
 ) represent GlcNAc, galactose and NeuAc residues, respectively.
The use of single collision energy (SCE) strategy for the fragmentation of individual glycopeptides via CID seemed sufficient for revealing detailed glycan information. However, information from this study reveals that subjecting individual glycopeptides to SCE resulted in limited peptide fragmentation. Hence, we are in the process of adopting a multiple collision energy (MCE) strategy as a means to achieve a more comprehensive fragmentation of glycopeptides, irrespective of their size or m/z value. With the MCE strategy, each glycopeptide will be subjected to a series of collision energies with the aim of determining the optimum CID conditions for individual glycopeptides.
Glycopeptide Isomer-specific Study
Separation of glycopeptides on the PGC chip occur based on both peptide and glycan structures. This contrasts, for example, to C18 stationary phase, which only minimally retains glycans and separates primarily based on the peptide moiety. Separation of the glycopeptides is critical in the analysis of complicated glycoprotein mixtures and PGC provides suitable separation of small glycopeptides.
The examination of kappa casein glycopeptides containing the trisaccharide (HexNAc + Hex + Neu5Ac) showed the separation of two glycopeptides with identical peptides but with variation in the connection of Neu5Ac (sialic acid) to either the HexNAc or the hexose. Such information was obtained from the observation of the unique disaccharide peaks for either (Hex + Neu5Ac) or (HexNAc + Neu5Ac) in the tandem MS data corresponding in mass to ~ 453 Da and ~ 494 Da respectively. Figure 6A is an extracted ion chromatogram (EIC, constructed with a precursor ion search within 10 ppm error) for the diprotonated kappa casein glycopeptide with m/z 723.29 corresponding in mass to (GEP152TSTPT + GalNAc1 + Gal1 + Neu5Ac1+ 2H)+2. The EIC for this glycopeptide ion clearly shows two major peaks at 20.00 min and at 20.90 min suggesting isomer separation (or less likely isobaric glycopeptides). The former is a more probable scenario as there was only one assignment obtained from the GP finder analysis for this glycopeptide mass. Assuming the two major peaks in the EIC actually represent the same assigned glycopeptide with identical peptide tags and harboring the same type of trisaccharide, they would only differ in their monosaccharide linkage, which would separate on the PGC chip.
Figure 6.

Figure 6A: Extracted ion chromatogram (EIC) of isomeric bovine kappa casein O-linked glycopeptides with m/z 723.29 assigned as (GEP152TSTPT + GalNAc1 + Gal1 + NeuAc1 + 2H)2+ eluting at 20.00 min and 20.90 min. Figure 6B: Deconvoluted MS/MS spectrum of one isomer eluting at 20.00 min. Figure 6C: Deconvoluted MS/MS spectrum of second isomer eluting at 20.90 min. Yellow rectangles (
), yellow circles (
) and purple diamond symbols (
) represent GlcNAc, galactose and NeuAc residues, respectively.
The tandem MS indicates that the two glycopeptides differ in their connection of Neu5Ac to either the hexose or HexNAc residue. Figure 6B and 6C show the deconvoluted tandem mass spectra for the glycopeptide in question eluting at 20.00 min and at 20.90 min respectively. The MS/MS data in Figure 6B confirms the attachment of the Neu5Ac to the hexose residue based on the (Hex + Neu5Ac) disaccharide peak corresponding to 453.27 Da. The MS/MS data in Figure 6C shows significantly different fragmentation, revealing the linkage of the Neu5Ac to the HexNAc residue as evident by the presence of the (HexNAc + Neu5Ac) peak corresponding to 494.16 Da. Hence, coupling separation and tandem MS is really helpful in resolving glycopeptide isomers. Furthermore, the observation of a 1282.50 Da peak in Figure 6C corresponding to a 162.07 Da loss (hexose residue loss) from the precursor ion prior to the Neu5Ac residue loss reveal a terminal hexose residue. However, in Figure 6B, the hexose residue (162.27 Da) loss was only observed after the cleavage of the Neu5Ac residue from the precursor ion. Both spectra contain the peptide peaks (788.35 Da and 788.41 Da) corresponding in mass to (GEP152TSTPT + H2O) and the trisaccharide peak (656.20 Da) corresponding in mass to (HexNAc + Hex + NeuAc). Other signals observed for both glycopeptide isomers include those corresponding to ~ 203 Da (HexNAc), ~ 273 Da (Neu5Ac – H2O) and ~ 291 Da (Neu5Ac), further confirming the compositions of each glycopeptide.
Isomer separations were also observed for N-glycans. For example, isomers of high-mannose containing glycopeptides such as GlcNAc2Man7 and GlcNAc2Man8 are observed in Figure 7. Figure 7A is an extracted ion chromatogram (EIC, constructed with a precursor ion search within 10 ppm error) for the diprotonated high mannose glycan-containing bovine lactoferrin glycopeptide with m/z 1103.91 corresponding in mass to (SGQ387NV + GlcNAc2 + Man8 + 2H)+2. The EIC for this ion clearly shows two distinct peaks at 13.65 min and at 15.25 min also suggesting isomer separation. Figure 7B represents the deconvoluted MS/MS data for the isomer eluting at 13.65 min. MS/MS data for the isomer eluting at 15.25 min is not shown as the data was not sufficient to distinguish between both isomers, probably due to the relatively low abundance of the isomer eluting at 15.25 min.
Figure 7.

Figure 7A: Extracted ion chromatogram (EIC) of isomeric bovine lactoferrin N-linked glycopeptides with m/z 1103.91 assigned as (SGQ387NV + GlcNAc2 + Man8 + 2H)2+ eluting at 13.65 min and 15.25 min. Figure 7B: Deconvoluted MS/MS spectrum of one isomer eluting at 13.65 min. Green circles (
) and blue squares (
) represent mannose and GlcNAc residues, respectively.
Determination of Comprehensive Glycan Micro-heterogeneity
Most glycosylated proteins exist with multiple glycans attached to a single glycosite, a phenomenon known as glycan micro-heterogeneity. One of the strengths of digesting glycoproteins with pronase, as opposed to specific enzymes such as trypsin, is its ability to generate a clean mixture of short glycopeptides typically containing one site per glycopeptide. This enables a more comprehensive representation of all glycans attached to each glycosite thereby resulting in a more detailed determination of glycan micro-heterogeneity. In line with this, glycopeptides belonging to families of peptides (containing the same peptide tags but with varying glycans) were observed in this study. Table 3 shows a list of such glycopeptides with the same peptide tags and the same glycosite but with varying connecting glycan compositions. Additional glycan micro-heterogeneity information was also obtained from glycopeptides containing the same glycosite but with different peptide tag lengths and/or sequence.
Table 3.
List of glycopeptides belonging to the same peptide families. Glycopeptides are grouped into unique classes based on similar peptide tags and varying glycan composition.
| GP mass (Da) | Retention time (mins) | Hexose | HexNAc | Neu5Ac | Glycosite | Peptide sequence | Peptide mass (Da) | Error (ppm) | Source protein |
|---|---|---|---|---|---|---|---|---|---|
| 1873.649 | 12.0 | 7 | 2 | 0 | Asn - 252 | NNS | 315.118 | 4.5 | b-LF |
| 2035.709 | 11.8 | 8 | 2 | 0 | Asn - 252 | NNS | 315.118 | 0.5 | b-LF |
|
| |||||||||
| 1548.586 | 13.7 | 5 | 2 | 0 | Asn - 387 | NVT | 314.159 | 4.2 | b-LF |
| 1751.656 | 12.5 | 5 | 3 | 0 | Asn - 387 | NVT | 314.159 | 9.0 | b-LF |
| 2034.742 | 12.5 | 8 | 2 | 0 | Asn - 387 | NVT | 314.159 | 4.2 | b-LF |
|
| |||||||||
| 1719.655 | 14.9 | 5 | 2 | 0 | Asn - 387 | SGQNV | 485.223 | 1.2 | b-LF |
| 1881.703 | 14.1 | 6 | 2 | 0 | Asn - 387 | SGQNV | 485.223 | 3.6 | b-LF |
| 2043.755 | 12.7 | 7 | 2 | 0 | Asn - 387 | SGQNV | 485.223 | 3.6 | b-LF |
| 2205.809 | 13.7 | 8 | 2 | 0 | Asn - 387 | SGQNV | 485.223 | 3.1 | b-LF |
| 2367.862 | 13.5 | 9 | 2 | 0 | Asn - 387 | SGQNV | 485.223 | 2.5 | b-LF |
|
| |||||||||
| 2020.835 | 19.0 | 6 | 2 | 0 | Asn - 495 | GLIVNQ | 624.360 | 5.1 | b-LF |
| 2102.895 | 16.4 | 4 | 4 | 0 | Asn - 495 | GLIVNQ | 624.360 | 1.6 | b-LF |
|
| |||||||||
| 1951.790 | 16.5 | 6 | 2 | 0 | Asn - 495 | IVNQT | 555.302 | 0.9 | b-LF |
| 1992.805 | 14.6 | 5 | 3 | 0 | Asn - 495 | IVNQT | 555.302 | 4.5 | b-LF |
| 2154.852 | 14.8 | 6 | 3 | 0 | Asn - 495 | IVNQT | 555.302 | 7.0 | b-LF |
|
| |||||||||
| 2173.794 | 23.5 | 7 | 2 | 0 | Asn - 564 | NDTVW | 615.265 | 4.7 | b-LF |
| 2335.844 | 23.5 | 8 | 2 | 0 | Asn - 564 | NDTVW | 615.265 | 5.7 | b-LF |
| 2497.902 | 23.3 | 9 | 2 | 0 | Asn - 564 | NDTVW | 615.265 | 3.4 | b-LF |
|
| |||||||||
| 2146.911 | 15.9 | 3 | 4 | 0 | Asn - 564 | GDVAFVKN | 830.429 | 2.1 | b-LF |
| 2105.887 | 16.0 | 4 | 3 | 0 | Asn - 564 | GDVAFVKN | 830.429 | 0.9 | b-LF |
|
| |||||||||
| 2250.927 | 18.6 | 4 | 3 | 1 | Asn - 156 | LNDSRV | 684.355 | 8.1 | b-Fetuin |
| 2616.047 | 17.0 | 5 | 4 | 1 | Asn - 156 | LNDSRV | 684.355 | 1.8 | b-Fetuin |
|
| |||||||||
| 2528.003 | 17.0 | 4 | 4 | 1 | Asn - 99 | ANCSVRQ | 758.349 | 8.5 | b-Fetuin |
| 2236.900 | 12.1 | 4 | 4 | 0 | Asn - 99 | ANCSVRQ | 758.349 | 4.8 | b-Fetuin |
|
| |||||||||
| 1290.500 | 17.0 | 1 | 1 | 1 | Thr - 157 | TEAVES | 616.270 | 6.4 | k-CN |
| 1581.588 | 25.1 | 1 | 1 | 2 | Thr - 157 | TEAVES | 616.270 | 10.1 | k-CN |
|
| |||||||||
| 842.362 | 9.8 | 1 | 1 | 0 | Thr - 163 | STVAT | 459.233 | 16.6 | k-CN |
| 1133.467 | 15.2 | 1 | 1 | 1 | Thr - 163 | STVAT | 459.233 | 3.5 | k-CN |
| 1424.561 | 17.9 | 1 | 1 | 2 | Thr - 163 | STVAT | 459.233 | 3.8 | k-CN |
Figure 8 is a pictorial representation of all eighteen glycosites observed and their corresponding glycans for the three constituent glycoproteins in the cocktail mixture. These glycosites include five bovine lactoferrin glycosites (252Asn, 300Asn, 387Asn, 495Asn and 564Asn); six kappa casein glycosites (142Thr, 152Thr, 154Thr, 157Thr, 163Thr and 186Thr) and seven bovine fetuin glycosites (99Asn, 156Asn, 176Asn, 271Ser, 280Thr, 282Ser and 341Ser). A previous study by Holland and co-workers involving the separation of the glycoforms of kappa casein by two-dimensional electrophoresis showed that each bovine kappa casein glycosite can only have a maximum of one N-acetylgalactosamine (GalNAc) unit and one galactose (Gal) unit.50 This earlier result further revealed that the disaccharide could also be decorated with one or two N-acetylneuraminic acid (Neu5Ac) unit(s). Data from our study are in agreement with the earlier study.
Figure 8.

Glycosylation associated with each glycosite of bovine lactoferrin, kappa casein and fetuin. The various glycans at each site indicate glycan micro-heterogeneity in the occupancy of each glycosite observed.
The results obtained from our strategy underscore a comprehensive approach towards analyzing site-specific glycosylation in protein mixtures as detailed glycan information was obtained for each glycosite. For example, seven N-glycans were observed to be associated with the 252Asn glycosite of bovine lactoferrin. These glycans include four high-mannose type glycans (GlcNAc2Man5, GlcNAc2Man7, GlcNAc2Man8 and GlcNAc2Man9), two complex type glycans (GlcNAc4Hex3 and GlcNAc4Hex 5) and one hybrid type glycan (GlcNAc3Hex5), all attached to a single 252Asn glycosite. On the other hand, 300Asn was found occupied by only one high mannose type glycan (GlcNAc2Man5), whereas 387Asn was occupied by all five high-mannose type glycans (GlcNAc2Man5, GlcNAc2Man6, GlcNAc2Man7, GlcNAc2Man8 and GlcNAc2Man9). Furthermore, 495Asn was occupied by three high-mannose, three complex and two hybrid type glycans while 564Asn was occupied by three high-mannose and two complex type glycans. It is imperative to note that 300Asn is a novel glycosite for bovine lactoferrin as it has never been reported to the best of our knowledge. Furthermore, despite the fact that the 186Thr glycosite from kappa casein is a rarely reported glycosite, our analysis of this protein mixture revealed one glycopeptide corresponding to this glycosite.
Conclusion
The approach described herein involving LC-MS and LC-MS/MS analyses of glycopeptides from a protein mixture via nano-LC/Q-TOF MS ensured the separation, detection and characterization of a complex mixture of glycopeptides investigated in this study. Glycopeptides were separated on a PGC chip based on their unique glycan and peptide compositions. Isomeric glycopeptides differing in their monosaccharide connectivities were also separated on the PGC chip into unique components during the analysis. This enabled structural elucidation for the individual species. The study was comprehensive as all known glycosites for the three glycoproteins investigated were observed. The 300Asn glycosite for bovine lactoferrin is reported here for the first time. Also, lactoferrin glycopeptides containing the rarely reported complex and hybrid glycans were observed in this study. In all, 233 glycopeptides (identified based on composition and including isomers) corresponding to 18 glycosites across three proteins were observed with most of the glycosites found occupied with multiple glycans. The glycopeptides analyzed were a complex mixture of N-linked glycopeptides (containing high mannose, complex and hybrid type glycans) and O-linked glycopeptides (containing sialylated and non-sialylated glycans).
The results obtained showed that the analysis of the complex mixture of glycopeptides using the described approach provides a unique platform for rapid analysis of site-specific glycosylation in protein mixtures. Specific ions such as those with m/z 163 (Hex + H)+, 204 (HexNAc + H)+ and 366 (HexNAc + Hex + H)+ were used as diagnostic ions for the identification of glycopeptide tandem mass spectra. Upon further inspection of such spectra, ions unique to certain kinds of glycopeptides based on the unique glycans they contain were observed. While ions such as m/z 325 (2Hex) were unique to only the high mannose glycan-containing glycopeptides, tandem spectra for complex and hybrid glycan-containing glycopeptides were particularly found containing ions with m/z 407 (2HexNAc). Software to serve as an automated and quick approach to analyze relevant glycopeptide tandem spectra is currently being developed by our group. The software is aimed at further broadening the application of this strategy to more complicated data set.
The complete composition of the glycan moieties for the glycopeptides can be obtained from the MS/MS data. Assignment of the peptide moieties of the glycopeptides was mainly achieved via accurate mass measurement as limited peptide fragmentations were observed from the MS/MS data. However, due to the non-specificity of pronase, varying peptide lengths and/or sequence obtained was useful for secondary verification of the peptide moieties and their consisting glycosites. Further improvement to the CID conditions used for obtaining more detailed peptide fragmentations within the same spectrum containing the glycan fragments is also under development in our group. The ability to separate and simultaneously characterize glycopeptides in a single analysis demonstrates a rapid, yet highly sensitive tool for comprehensive site-specific glycosylation analysis in simple protein mixtures. This approach lays the foundation for a glycoproteomic method with extensive site-specific heterogeneity and simultaneous N- and O-glycan determination.
Acknowledgments
Funds provided by the Dairy Management Institute (HD061923 and HD059127), National Institute of Health (ROIGM049077) and California Dairy Research Foundation Grant 06 LEC-01-NH are gratefully acknowledged. We also thank Eric D. Dodds for the helpful discussions.
References
- 1.Apweiler R, Hermjakob H, Sharon N. On the frequency of protein glycosylation as deduced from analysis of the SWISS-PROT database. Biochim Biophys Acta. 1999;1473(1):4–8. doi: 10.1016/s0304-4165(99)00165-8. [DOI] [PubMed] [Google Scholar]
- 2.An HJ, Froehlich JW, Lebrilla CB. Determination of glycosylation sites and site-speciric heterogeneity in glycoproteins. Curr Opin Chem Biol. 2009;13(4):421–426. doi: 10.1016/j.cbpa.2009.07.022. [DOI] [PMC free article] [PubMed] [Google Scholar]
- 3.Olden K, Parent JB, White SL. Carbohydrate moeities of glycoproteins a re-evaluation of their function. Biochim Biophys Acta. 1982;650(4):209–232. doi: 10.1016/0304-4157(82)90017-x. [DOI] [PubMed] [Google Scholar]
- 4.Helenius A, Aebi M. Intracellular functions of N-linked glycans. Science. 2001;291(5512):2364–2369. doi: 10.1126/science.291.5512.2364. [DOI] [PubMed] [Google Scholar]
- 5.Varki A. Biological roles of oligosaccharides: all of the theories are correct. Glycobiology. 1993;3(2):97–130. doi: 10.1093/glycob/3.2.97. [DOI] [PMC free article] [PubMed] [Google Scholar]
- 6.Lowe JB. Glycosylation, immunity and autoimmunity. Cell. 2001;104:809–812. doi: 10.1016/s0092-8674(01)00277-x. [DOI] [PubMed] [Google Scholar]
- 7.Montreuil J. Spatial conformation of glycans and glycoproteins. Biol Cell. 1984;51(2):115–131. doi: 10.1111/j.1768-322x.1984.tb00291.x. [DOI] [PubMed] [Google Scholar]
- 8.Yet MG, Shao MC, Wold F. Effects of the protein matrix on glycan processing in glycoproteins. Faseb J. 1988;2(1):22–31. doi: 10.1096/fasebj.2.1.3275561. [DOI] [PubMed] [Google Scholar]
- 9.Rademacher TW, Parekh RB, Dwek RA. Glycobiology. Annu Rev Biochem. 1988;57:785–838. doi: 10.1146/annurev.bi.57.070188.004033. [DOI] [PubMed] [Google Scholar]
- 10.Morelle W, Michalski JC. The mass spectrometric analysis of glycoproteins and their glycan structures. Curr Anal Chem. 2005;1(1):29–57. [Google Scholar]
- 11.Sharon N. Lectins: past, present and future. Biochem Soc Trans. 2008;36(6):1457–1460. doi: 10.1042/BST0361457. [DOI] [PubMed] [Google Scholar]
- 12.Tajiri M, Yoshida S, Wada Y. Differential analysis of site-specific glycans on plasma and cellular fibronectins: application of a hydrophilic affinity method for glycopeptide enrichment. Glycobiology. 2005;15(12):1332–1340. doi: 10.1093/glycob/cwj019. [DOI] [PubMed] [Google Scholar]
- 13.Zhang Y, Go EP, Desaire H. Maximizing coverage of glycosylation heterogeneity in MALDI-MS analysis of glycoproteins with up to 27 glycosylation sites. Anal Chem. 2008;80(9):3144–3158. doi: 10.1021/ac702081a. [DOI] [PubMed] [Google Scholar]
- 14.Wang Y, Wu SL, Hancock WS. Approaches to the study of N-linked glycoproteins in human plasma using lectin affinity chromatography and nano-HPLC coupled to electrospray linear ion trap-Fourier transform mass spectrometry. Glycobiology. 2006;16(6):514–523. doi: 10.1093/glycob/cwj091. [DOI] [PubMed] [Google Scholar]
- 15.Geng M, Zhang X, Bina M, Regnier F. Proteomics of glycoproteins based on affinity selection of glycopeptides from tryptic digests. J Chromatogr B Biomed Sci Appl. 2001;752(2):293–306. doi: 10.1016/s0378-4347(00)00550-8. [DOI] [PubMed] [Google Scholar]
- 16.Kaji H, Saito H, Yamauchi Y, Shinkawa T, Taoka M, Hirabayashi J, Kasai K, Takahashi N, Isobe T. Lectin affinity capture, isotope-coded tagging and mass spectrometry to identify N-linked glycoproteins. Nat Biotechnol. 2003;21(6):667–672. doi: 10.1038/nbt829. [DOI] [PubMed] [Google Scholar]
- 17.Yang Z, Hancock WS. Approach to the comprehensive analysis of glycoproteins isolated from human serum using a multi-lectin affinity column. J Chromatogr A. 2004;1053(1–2):79–88. [PubMed] [Google Scholar]
- 18.Durham M, Regnier FE. Targeted glycoproteomics: serial lectin affinity chromatography in the selection of O-glycosylation sites on proteins from the human blood proteome. J Chromatogr A. 2006;1132(1–2):165–173. doi: 10.1016/j.chroma.2006.07.070. [DOI] [PubMed] [Google Scholar]
- 19.Qui R, Regnier FE. Use of multidimensional lectin affinity chromatography in differential glycoproteomics. Anal Chem. 2005;77(9):2802–2809. doi: 10.1021/ac048751x. [DOI] [PubMed] [Google Scholar]
- 20.Zhang H, Li X, Martin DB, Aebersold R. Identification and quantification of N-linked glycoproteins using hydrazide chemistry, stable isotope labeling and mass spectrometry. Nat Biotechnol. 2003;21(6):660–666. doi: 10.1038/nbt827. [DOI] [PubMed] [Google Scholar]
- 21.Liu T, Qian WJ, Gritsenko MA, Camp DG, Monroe ME, Moore RJ, Smith RD. Human plasma N-glycoproteome analysis by immunoaffinity subtraction, hydrazide chemistry, and mass spectrometry. J Proteome Res. 2005;4(6):2070–2080. doi: 10.1021/pr0502065. [DOI] [PMC free article] [PubMed] [Google Scholar]
- 22.Pan S, Wang Y, Quinn JF, Peskind ER, Waichunas D, Wimberger JT, Jin J, Li JG, Zhu D, Pan C, Zhang J. Identification of glycoproteins in human cerebrospinal fluid with a complementary proteomic approach. J Proteome Res. 2006;5(10):2769–2779. doi: 10.1021/pr060251s. [DOI] [PubMed] [Google Scholar]
- 23.Zhang H, Aebersold R. Isolation of glycoproteins and identification of their N-linked glycosylation sites. Methods Mol Biol. 2006;328:177–185. doi: 10.1385/1-59745-026-X:177. [DOI] [PubMed] [Google Scholar]
- 24.Sun B, Ranish JA, Utleg AG, White JT, Yan X, Lin B, Hood L. Shotgun glycopeptide capture approach coupled with mass spectrometry for comprehensive glycoproteomics. Mol Cell Proteomics. 2007;6(1):141–149. doi: 10.1074/mcp.T600046-MCP200. [DOI] [PubMed] [Google Scholar]
- 25.Zhou Y, Aebersold R, Zhang H. Isolation of N-linked glycopeptides from plasma. Anal Chem. 2007;79(15):5826–5837. doi: 10.1021/ac0623181. [DOI] [PubMed] [Google Scholar]
- 26.Jiang H, Wu S, Karger BL, Hancock WS. Characterization of the glycosylation occupancy and the active site in the follow-on protein therapeutic: TNK-tissue plasminogen activator. Anal Chem. 2010;82(14):6154–6162. doi: 10.1021/ac100956x. [DOI] [PMC free article] [PubMed] [Google Scholar]
- 27.Dalpathado DS, Desaire H. Glycopeptide analysis by mass spectrometry. Analyst. 2008;133(6):731–738. doi: 10.1039/b713816d. [DOI] [PubMed] [Google Scholar]
- 28.Huddleston MJ, Bean MF, Carr SA. Collisional fragmentation of glycopeptides by electrospray ionization LC/MS and LC/MS/MS: Methods for selective detection of glycopeptides in protein digests. Anal Chem. 1993;65(7):877–884. doi: 10.1021/ac00055a009. [DOI] [PubMed] [Google Scholar]
- 29.Zhao J, Simeone DM, Heidt D, Anderson MA, Lubman DM. Comparative serum glycoproteomics using lectin selective sialic acid glycoproteins with mass spectrometric analysis: Application to pancreatic cancer serum. J Proteome Res. 2006;5(7):1792–1802. doi: 10.1021/pr060034r. [DOI] [PubMed] [Google Scholar]
- 30.Geyer H, Geyer R. Strategies for analysis of glycoprotein glycosylation. Biochim Biophys Acta. 2006;1764(12):1853–1869. doi: 10.1016/j.bbapap.2006.10.007. [DOI] [PubMed] [Google Scholar]
- 31.Hägglund P, Bunkenborg J, Elortza F, Jensen ON, Roepstorff PA. A new strategy for identification of N-glycosylated proteins and unambiguous assignment of their glycosylation sites using HILIC enrichment and partial deglycosylation. J Proteome Res. 2004;3(3):556–566. doi: 10.1021/pr034112b. [DOI] [PubMed] [Google Scholar]
- 32.Pouria S, Corran PH, Smith AC, Smith HW, Hendry BM, Challacombe SJ, Tarelli E. Glycoform composition profiling of O-glycopeptides derived from human serum IgA1 by matrix-assisted laser desorption-ionization time-of-flight mass spectrometry. Anal Biochem. 2004;330(2):257–263. doi: 10.1016/j.ab.2004.03.053. [DOI] [PubMed] [Google Scholar]
- 33.Loo TW, Clarke DM. Superfolding of the partially unfolded core-glycosylated intermediate of human P-glycoprotein into the mature enzyme is promoted by substrate-induced transmembrane domain interactions. J Biol Chem. 1998;273(24):14671–14674. doi: 10.1074/jbc.273.24.14671. [DOI] [PubMed] [Google Scholar]
- 34.Loo TW, Clarke DM. The human multidrug resistance P-glycoprotein is inactive when its maturation is inhibited: potential for a role in cancer chemotherapy. The FASEB Journal. 1999;13(13):1724–1732. doi: 10.1096/fasebj.13.13.1724. [DOI] [PubMed] [Google Scholar]
- 35.Giancotti FG, Tarone G, Knudsen K, Damsky C, Comoglio PM. Cleavage of a 135 KD surface glycoprotein correlates with loss of fibroblast adhesion to fibronectin. Exp Cell Res. 1985;156(1):182–190. doi: 10.1016/0014-4827(85)90272-1. [DOI] [PubMed] [Google Scholar]
- 36.Carter WG, Hakamori S. A protease-resistant, transformation-sensitive membrane glycoprotein and an intermediate filament-forming protein of hamster embryo fibroblasts. J Biol Chem. 1978;253(8):2867–2874. [PubMed] [Google Scholar]
- 37.Chen R, Jiang X, Sun D, Han G, Wang F, Ye M, Wang L, Zou H. Glycoproteomics analysis of human liver tissue by combination of multiple enzyme digestion and hydrazide chemistry. J Proteome Res. 2009;8(2):651–661. doi: 10.1021/pr8008012. [DOI] [PubMed] [Google Scholar]
- 38.An HJ, Peavy TR, Hedrick JL, Lebrilla CB. Determination of N-glycosylation sites and site heterogeneity in glycoproteins. Anal Chem. 2003;75(20):5628–5637. doi: 10.1021/ac034414x. [DOI] [PubMed] [Google Scholar]
- 39.Clowers BH, Dodds ED, Seipert RR, Lebrilla CB. Site determination of protein glycosylation based on digestion with immobilized nonspecific proteases and Fourier transform ion cyclotron resonance mass spectrometry. J Proteome Res. 2007;6(10):4032–4040. doi: 10.1021/pr070317z. [DOI] [PubMed] [Google Scholar]
- 40.Seipert RR, Dodds ED, Clowers BH, Beecroft SM, German JB, Lebrilla CB. Factors that influence fragmentation behavior N-linked glycopeptide ions. Anal Chem. 2008;80 (10):3684–3692. doi: 10.1021/ac800067y. [DOI] [PMC free article] [PubMed] [Google Scholar]
- 41.Seipert RR, Dodds ED, Lebrilla CB. Exploiting differential dissociation chemistries of O-linked glycopeptide ions for the localization of mucin-type protein glycosylation. J Proteome Res. 2009;8(2):493–501. doi: 10.1021/pr8007072. [DOI] [PMC free article] [PubMed] [Google Scholar]
- 42.Dodds ED, Seipert RR, Clowers BH, German JB, Lebrilla CB. Analytical performance of immobilized pronase for glycopeptide footprinting and implications for surpassing reductionist glycoproteomics. J Proteome Res. 2009;8(2):502–512. doi: 10.1021/pr800708h. [DOI] [PMC free article] [PubMed] [Google Scholar]
- 43.Coddeville B, Strecker G, Wieruszeski J, Vliegenthart J, Halbeek H, Peter-Katalinic J, Egge H, Spik G. Heterogeneity of bovine lactotransferrin glycans. Characterization of α-d-Galp-(1 → 3)-β-d-Gal- and α-NeuAc-(2 → 6)-β-d-GalpNAc-(1 → 4)-β-d-GlcNAc-substituted N-linked glycans. Carbohydr Res. 1992;236:145–164. doi: 10.1016/0008-6215(92)85013-p. [DOI] [PubMed] [Google Scholar]
- 44.Carr SA, Huddleston MJ, Bean MF. Selective identification and differentiation of N- and O-linked oligosaccharides in glycoproteins by liquid chromatography-mass spectrometry. Protein Sci. 1993;2(2):183–196. doi: 10.1002/pro.5560020207. [DOI] [PMC free article] [PubMed] [Google Scholar]
- 45.Deguchi K, Ito H, Bada T, Hirabayashi A, Nakagawa H, Fumoto M, Hinou H, Nishumura S. Structural analysis of O-glycopeptides employing negative- and positive-ion multi-stage mass spectra obtained by collision-induced an electron-capture dissociation in linear ion trap time-of-flight mass spectrometry. Rapid Commun Mass Spectrom. 2007;21(5):691–698. doi: 10.1002/rcm.2885. [DOI] [PubMed] [Google Scholar]
- 46.An HJ, Tillinghast JS, Woodruff DL, Rocke DM, Lebrilla CB. A new computer program (GlycoX) to determine simultaneously the glycosylation sites and oligosaccharide heterogeneity of glycoproteins. J Proteome Res. 2006;5(10):2800–2808. doi: 10.1021/pr0602949. [DOI] [PubMed] [Google Scholar]
- 47.Chu CS, Ninonuevo MR, Clowers BH, Perkins PD, An HJ, Yin H, Killeen K, Miyamoto S, Grimm R, Lebrilla CB. Profile of native N-linked glycan structures from human serum using high performance liquid chromatography on a microfluidic chip and time-of-flight mass spectrometry. Proteomics. 2009;9(7):1939–1951. doi: 10.1002/pmic.200800249. [DOI] [PMC free article] [PubMed] [Google Scholar]
- 48.Roepstorff P, Fohlman J. Proposal for a common nomenclature for sequence ions in mass spectra of peptides. Biomed Mass Spectrom. 1984;11(11):601–601. doi: 10.1002/bms.1200111109. [DOI] [PubMed] [Google Scholar]
- 49.Medzihradszky KF, Besman MJ, Burlingame AL. Structural characterization of site-specific N-glycosylation of recombinant human factor VIII by reversed-phase high-performance liquid chromatography-electrospray ionization mass spectrometry. Anal Chem. 1997;69(19):3986–3994. doi: 10.1021/ac970372z. [DOI] [PubMed] [Google Scholar]
- 50.Holland JW, Deeth HC, Alewood PF. Analysis of O-glycosylation site occupancy in bovine kappa-casein glycoforms separated by two-dimensional gel electrophoresis. Proteomics. 2005;5(4):990–1002. doi: 10.1002/pmic.200401098. [DOI] [PubMed] [Google Scholar]