

Abstract
Objective
To identify sociodemographic factors associated with completing a follow-up survey about health status on the web versus by telephone, and to examine differences in reported health-related quality of life by method of response.
Data Sources/Study Settings
Survey about child health status of 896 parents of children aged 0–17 years treated in a hospital emergency department or admitted for a traumatic brain injury or arm injury, and 227 injured adolescents aged 14–17 years.
Study Design
The main outcomes were characteristics of those who completed a follow-up survey on the web versus by telephone and health-related quality of life by method of response.
Principal Findings
Email addresses were provided by 76.9 percent of parents and 56.5 percent of adolescents at baseline. The survey was completed on the web by 64.9 percent of parents and 40.2 percent of adolescents through email. Parents with email access who were Blacks, Hispanics, had lower incomes, and those who were not working were less likely to choose the web mode for completing the survey. Unlike adolescents, the amount of time for parents to complete the survey online was significantly shorter than completion by telephone. Differences by survey mode were small but statistically significant in some of the six functional outcome measures examined.
Conclusions
Survey mode was associated with several sociodemographic characteristics. Sole use of web surveys could provide biased data.
Keywords: Injuries, surveys, Internet, telephone, children
Study of the outcomes of disease and injury and the effects of treatment are necessary for both health care providers to determine treatment effectiveness and policy makers to identify the burden of disease in the population. Barriers to collecting this information include the cost of the follow-up and uncertainty about the reliability and validity of the information obtained. Typical mail surveys on patient satisfaction with care following discharge from the hospital, for example, have had response rates of only 20–30 percent (Santuzzi et al. 2009; Simon et al. 2009;). While response rates for surveys conducted by telephone are often higher, telephone surveys are becoming more expensive because of the number of calls it takes to reach a respondent (Tourangeau 2004). Response rates in general population telephone surveys have been declining over time, probably due in part to telemarketing, solicitation by nonprofit organizations, noncommercial surveys, and the high prevalence of answering machines to screen out unwanted calls (Curtin et al. 2005). These same factors may contribute to the decline in responses to health surveys as well. For example, response rates to the random digit dialing Behavioral Risk Factor Surveillance System declined from 72 percent in 1993 to 51 percent in 2006 (Fahimi et al. 2008).
One of the alternatives to telephone surveys is to use World Wide Web-based surveys. Studies have indicated that the cost per respondent can be six-fold higher for telephone compared with web-based surveys (Parks et al. 2006). These higher costs for telephone surveys are not just because of the frequent need for repeated contact attempts by telephone but also because of the interviewer time required to administer the telephone survey. There are other potential advantages of the web mode. Self-administered questionnaires, whether by web, mail, or audio computer-assisted self-interviewing can be more successful at eliciting truthful responses on sensitive questions (de Leeuw and van der Zouwen 1988; Aquilino 1994; Galesic et al. 2006;). On the other hand, concerns have been raised about Internet access in the population (Wilson et al. 2003), break-off without completion of the survey, and uncertainty over the identity of the actual respondent (Galesic et al. 2006).
Concerns have also been raised on the comparability of information obtained by web-based surveys with that obtained by telephone surveys. In observational studies comparing these methods, respondents on web-based surveys were somewhat more likely to report some risk behaviors such as binge drinking but less likely to report other risk behaviors such as current smoking (Link and Mokdad 2005a,b;). However, other observational studies (Graham et al. 2006; Graham and Papandonatos 2008;) and randomized trials (Parks et al. 2006; McMorris et al. 2009;) have found little difference in reporting of risk behaviors by respondents to a web-based compared with a telephone survey. In one nonrandomized test–retest reliability study, concordance was higher for web-based than for telephone respondents (Rankin et al. 2008). Another trial in which people with Internet access were randomized to complete a survey by telephone or on the web indicated that, while completion rates were very different by assigned mode (97.5 percent for telephone and 51.6 percent for web), demographic characteristics of completers were similar between the two modes (Fricker et al. 2005).
There is no information in the literature, to our knowledge, on the comparison of web versus telephone surveys completed by parents about their children, nor a comparison of the use of the two survey types by adolescents. This study was undertaken (1) to identify sociodemographic factors associated with completing a follow-up survey on the Internet versus by telephone, and (2) to examine differences in time to complete the survey and in reported health-related quality of life, by method of response.
METHODS
Participants
This evaluation was part of a larger study on the outcome of children after traumatic brain injury (TBI), using children with an isolated arm injury as a comparison group. All study procedures were approved by the human subject committees of participating institutions. The larger study identified children under the age of 18 years treated and discharged alive either in the emergency department or as an inpatient for either a TBI or an arm injury. There were nine participating institutions in King County, WA (a children's hospital, two university-operated hospitals, and six community hospitals), and one in Philadelphia, PA (a children's hospital, from which only inpatient TBI cases were chosen). Study participants were parents of children randomly selected by computer-generated random number from the list of all eligible children treated between March 1, 2007, and September 30, 2008, and contacted by letter and follow-up telephone call, or in-person for those who were admitted.
Procedures
For those who agreed to participate, a baseline interview was administered as soon as possible after injury either by telephone or in-person to one parent or guardian of all children and to adolescents 14 years and older, if cognitively able. All parents and adolescents were asked at baseline for an email address for further communication with the study team.
A follow-up interview was conducted 3 months after the date of the index injury with all parents and with adolescents 14 years and older who were able to complete the survey. All participants were sent an advance letter about the follow-up survey. Participants who provided email addresses at baseline were sent an email with an embedded link to complete the follow-up survey online. All participants who did not provide an email address at baseline received a follow-up telephone call to complete the survey over the telephone. Those who were initially sent an email invitation but did not complete the on-line survey after three email reminders each sent 3 days apart were subsequently contacted by telephone to complete the survey.
Parents were offered a U.S.$25 gift certificate following completion of the survey, and adolescents were given a U.S.$10 gift certificate for completing the survey. The first 75 parents and their adolescents, if applicable, were asked to complete the survey by both methods, with the order of mode randomly determined using a random number table in order to evaluate the reliability of responses by survey mode. For Spanish-speaking respondents, the survey was conducted in Spanish either by a fluent Spanish speaker for the telephone mode, or translated to Spanish for the web survey.
Measures
Race and ethnicity of the injured child were reported by the parent respondent at baseline. Parents reported annual household income at baseline, as well as highest grade achieved by the child's mother and father, and whether the mother and father were each employed. Rural–urban residence was based on the zip code of the household.
The outcome measures were reported by both the parents and the adolescents. The 3-month follow-up survey included standardized questions on various aspects of the child's functioning.
Health-Related Quality of Life
Pediatric Quality of Life scale (Peds QL) was used as a measure of the health-related quality of life; healthy children have a mean of total score of 88 (SD 12) (Varni et al. 2001). This has been shown to be a reliable and valid measure of health-related quality of life in children after TBI and musculoskeletal trauma (McCarthy et al. 2005; McCarthy et al. 2006;). Standardized scores were calculated and used in the analysis.
Adaptive Skills
The Adaptive Behavior Assessment System-Second Edition (ABAS-II) is a multidimensional instrument that provides a comprehensive, norm-referenced assessment of adaptive skills (Harrison and Oakland 2003). We used two subscales of the ABAS-II: the Communication and the Self-Care subscales. These are standardized to a mean score of 10 (SD 3).
Activities
The Child and Adolescent Scale of Participation (CASP) consists of 20 items to measure the involvement of children and adolescents in various activities in the home, school, and community (Bedell 2006). In children without disabilities, the mean score is 97 (SD 4).
Family Impact
The Impact on Families Scale measures the perceived effect of the child's ongoing health issues on the family; mean scores for parents of children with a variety of chronic illnesses was 59 (SD 10) (Stein and Jessop 2003).
Behavior
The Pediatric Symptom Checklist (PSC) is a well-standardized parent checklist designed to screen for pediatric behavioral health problems (Jellinek and Murphy 1988).
Data Analysis
All telephone and web survey responses were entered directly into a database managed by DatStat Illume (Version 4.5, DatStat Inc., Seattle, WA).
We compared the characteristics of parents and adolescents who answered via the web to those with email who answered by telephone and to those without email who answered by telephone using χ2 test statistics adjusted for clustering by hospital or, when there were small expected values, Fisher's exact tests. We compared the mean time to complete the survey by telephone or by web for parents and for adolescents 14–17 years of age by student's t-test. Because the time for completion of the web-based survey was captured by noting the time when it was begun and when finished, we excluded the time data for parents exceeding 120 minutes and for adolescents exceeding 80 minutes. We compared the mean responses of the functional outcome measures in this group by mode of response using t-tests, and we calculated mean differences adjusted for confounders using linear regression. Adjustment was based on child age, injury type, and baseline value of the response in question. We used paired t-tests to compare the mean responses of the functional outcomes on the parents who completed the survey by both the telephone and web modes.
RESULTS
During the study period, 5,311 eligible children (2,940 with TBI and 2,371 controls with arm injuries) were treated at the participating hospitals (Figure 1). Of these, 2,873 were randomly selected for participation, and attempts were made to contact their families; 926 were enrolled in the study. Follow-up surveys were completed by 896 (96.8 percent) parents. There were 239 adolescents who were age 14 years or older at the 3-month follow-up and thus were eligible to complete the adolescent self-report survey; follow-up surveys were completed by 227 adolescents (95.0 percent). Email addresses were provided by 712 parents (76.9 percent) and 135 (56.5 percent) adolescents at the time of study enrollment.
Figure 1.
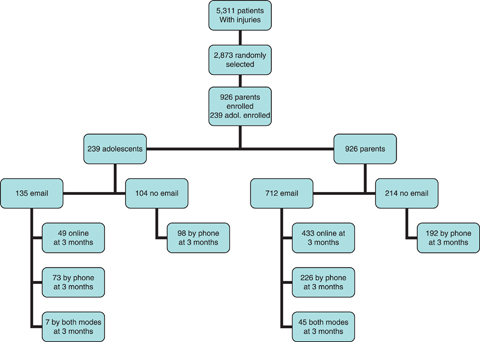
Flow of Patients in the Study
COMPARISON OF PARENT RESPONDENTS
The 3-month follow-up survey was completed by 98.9 percent (n = 704) of parents who had email and by 89.7 percent (n = 192) of parents without email (p = .001) at the time of initial enrollment in the study. Overall, 67.9 percent (n = 433 online only+45 both modes = 478) of those with email addresses completed the 3-month follow-up survey online, and 32.1 percent (n = 226) completed the interview only by telephone; all of the parents without email at enrollment completed the 3-month follow-up survey by telephone.
There were no significant differences in child age or gender, or parent age among these three groups (Table 1). Children whose parents completed the survey online were more likely to be white than those completing by telephone, regardless of email access. However, those respondents without email were significantly more likely to be Hispanics than in the other groups.
Table 1.
Characteristics of 851 Parents Completing the 3-Month Follow-Up Survey by Method
| Respondents with Email | Respondents without Email | ||||
|---|---|---|---|---|---|
| Telephone | Online | p* | Telephone | p* | |
| N | 226 | 433 | 192 | ||
| Age of child (years) (%) | .40 | .19 | |||
| 0–4 | 27.9 | 31.2 | 30.2 | ||
| 5–9 | 16.8 | 24.0 | 23.4 | ||
| 10–14 | 26.1 | 27.9 | 25.0 | ||
| 15–17 | 29.2 | 16.9 | 21.4 | ||
| Child gender (%) | .40 | .56 | |||
| Male | 61.5 | 64.9 | 67.7 | ||
| Female | 38.5 | 35.1 | 32.3 | ||
| Parent gender (%) | .32 | .31 | |||
| Male | 18.1 | 14.6 | 10.9 | ||
| Female | 81.9 | 85.4 | 89.1 | ||
| Child race (%) | .03 | .03 | |||
| White | 63.7 | 75.2 | 37.9 | ||
| Black | 7.1 | 1.6 | 6.8 | ||
| Hispanic | 7.1 | 2.1 | 35.8 | ||
| Asian | 3.5 | 2.1 | 1.0 | ||
| Other/multiple | 18.6 | 19.0 | 18.4 | ||
| Household income (%) | .37 | .03 | |||
| <U.S.$30k | 21.7 | 8.8 | 52.1 | ||
| U.S.$30–60k | 19.5 | 16.4 | 19.8 | ||
| U.S.$60–100k | 24.8 | 24.9 | 10.4 | ||
| >U.S.$100k | 29.2 | 46.7 | 9.4 | ||
| Refused/dnk | 4.9 | 3.2 | 8.3 | ||
| Parent education (%) | .01 | .002 | |||
| High school or lower | 25.2 | 8.5 | 60.8 | ||
| Some college | 31.4 | 27.7 | 24.9 | ||
| College | 24.3 | 37.0 | 9.0 | ||
| Postgraduate | 19.0 | 26.8 | 5.3 | ||
| Parent employment (%) | .66 | .02 | |||
| Not working for pay | 34.5 | 32.1 | 46.1 | ||
| Working for pay | 65.5 | 67.9 | 53.9 | ||
| Residence (%) | .11 | .17 | |||
| Urban | 92.4 | 97.2 | 92.7 | ||
| Rural | 7.6 | 2.8 | 7.3 | ||
| Hospitals (%) | .06 | .03 | |||
| CHOP | 4.0 | 2.8 | 5.7 | ||
| Other hospitals | 96.0 | 97.2 | 94.3 | ||
Note. The 45 parents completing the surveys in both modes are excluded.
Compared with web respondents.
While there were no significant differences in household income or parent employment among the two email available groups, respondents without email access had lower household incomes and were less likely to be working for pay (Table 1). Parents with email access who were Blacks, Hispanics, had lower incomes, and those who were not working were less likely to choose the web mode for completing the survey.
If the follow-up survey had been administered only by the web with access via email, this would have reduced the follow-up response rate to 76.0 percent (704 parent responders with email/926 initial participants). However, this would have eliminated all those who did not have email and responded by phone: 36.1 percent of African American parents, 73.4 percent of Hispanic parents, 55.5 percent of parents with only a high school education or less, 53.5 percent of those in the lowest income category, 29.1 percent of parents who were not working for pay, and 32.6 percent of parents living in rural areas. If those with email who did the survey by telephone (despite three email reminders) would never have completed the survey online, the response rate would have been reduced to 51.6 percent (433 online only + 45 online and phone out of the 926 initial participants) and even more parents in these categories would have been missed.
COMPARISON OF ADOLESCENT RESPONDERS
Among the 227 adolescent responders at 3 months, 49 completed the survey online, 171 by telephone, and 7 by both web and telephone. Overall, 41.5 percent (n = 49 online only + 7 both modes = 56) of those with email addresses completed the 3-month follow-up survey online, and 59.8 percent (n = 73) completed the interview by telephone; all of the adolescent responders without email at enrollment completed the 3-month follow-up survey by telephone. There was no statistically significant difference in the response rate of the adolescents by presence or absence of email access (p = .72).
There were no significant differences in the age or gender of the adolescent respondent, household income, or parent education among these three groups of adolescents (Table 2). Those responding online were more likely to be white and to live in urban areas than those completing by telephone, regardless of email access. Those without email access were less likely to have the parental respondent to be working for pay than those responding online.
Table 2.
Characteristics of 220 Adolescents Completing the 3-Month Follow-Up Survey by Method
| Respondents with Email | Respondents without Email | ||||
|---|---|---|---|---|---|
| Telephone | Online | p* | Telephone | p* | |
| N | 73 | 49 | 98 | ||
| Age of child (months) (%) | 189.5 (13.4) | 192.0 (13.6) | .37 | 190.3 (14.6) | .62 |
| Child gender (%) | .02 | .72 | |||
| Male | 63.0 | 75.5 | 74.5 | ||
| Female | 37.0 | 24.5 | 25.5 | ||
| Parent gender (%) | .90 | .38 | |||
| Male | 19.2 | 18.4 | 13.3 | ||
| Female | 80.8 | 81.6 | 86.7 | ||
| Child race (%) | .58 | .004 | |||
| White | 69.9 | 75.5 | 60.2 | ||
| Black | 5.5 | 0 | 7.2 | ||
| Hispanic | 4.1 | 2.0 | 17.3 | ||
| Asian | 2.7 | 2.0 | 0 | ||
| Other/multiple | 17.8 | 20.5 | 15.3 | ||
| Household income (%) | .72 | .28 | |||
| <U.S.$30k | 17.8 | 12.3 | 20.4 | ||
| U.S.$30–60k | 13.7 | 10.2 | 20.4 | ||
| U.S.$60–100k | 21.9 | 22.4 | 23.5 | ||
| >U.S.$100k | 45.2 | 53.1 | 28.6 | ||
| Refused/dnk | 1.4 | 2.0 | 7.1 | ||
| Parent education (%) | .12 | .28 | |||
| High school or lower | 27.4 | 10.2 | 29.6 | ||
| Some college | 27.4 | 30.6 | 30.6 | ||
| College | 26.0 | 38.8 | 24.5 | ||
| Postgraduate | 19.2 | 20.4 | 15.3 | ||
| Parent employment (%) | .83 | .07 | |||
| Not working for pay | 20.5 | 18.4 | 37.8 | ||
| Working for pay | 79.5 | 81.6 | 62.2 | ||
| Residence | .04 | .10 | |||
| Urban | 90.4 | 100 | 92.8 | ||
| Rural | 9.6 | 0 | 7.2 | ||
| Hospitals (%) | .65 | .67 | |||
| CHOP | 5.5 | 2.0 | 4.1 | ||
| Other hospitals | 94.5 | 98.0 | 95.9 | ||
Note. The seven adolescents completing the surveys in both modes are excluded.
Compared with web respondents.
Administering the survey only by web with access by email would have reduced the follow-up response rate to 54.0 percent of adolescents (129 adolescent responders with email/239 initial participants). However, this would have eliminated 63.6 percent of African American adolescents, 81.0 percent of Hispanic adolescents, 53.7 percent of adolescents whose parents had only a high school education or less, 60.7 percent of those whose parents were not working for pay, and 50.0 percent of those living in rural areas.
COMPARISON OF AMOUNT OF TIME TO COMPLETE THE SURVEY
The amount of time for parents to complete the survey online was significantly shorter than completion by telephone (Table 3). Time for completion was substantially longer for Spanish-speaking parents than for English speakers.
Table 3.
Comparison of Mean Time to Complete the Survey by Telephone or by Web for Parents and for Adolescents 14–17 Years of Age
| Telephone Minutes (SD) | Web Minutes (SD) | p | |
|---|---|---|---|
| All parents | |||
| Both languages | 32.5 (10.7) | 23.3 (12.6) | <.0001 |
| English | 30.6 (9.4) | 23.3 (12.6) | <.0001 |
| Spanish | 44.3 (11.4) | 26.0 (—)* | — |
| Parents with email addresses | |||
| Both languages | 30.7 (10.6) | 23.3 (12.6) | <.0001 |
| English | 30.0 (9.2) | 23.3 (12.6) | <.0001 |
| Spanish | 53.2 (23.1) | 26.0 (—)* | — |
| All adolescents | |||
| Both languages | 18.5 (5.9) | 17.6 (12.4) | .48 |
| English | 18.4 (5.9) | 17.6 (12.4) | .52 |
| Spanish | 22.5 (4.9) | — | — |
| Adolescents with email addresses† | |||
| Both languages | 17.7 (4.3) | 17.6 (12.4) | .89 |
| English | 17.7 (4.4) | 17.6 (12.4) | .92 |
| Spanish | 19.0 (—)* | — | — |
No SD given because only one respondent in the cell and no statistical test conducted.
We excluded parents who completed the survey in >120 minutes and adolescents who completed the survey in >80 minutes.
Among adolescents, time for completion of the telephone survey was not significantly different than that for online completion.
COMPARISON OF REPORTED FUNCTIONAL OUTCOME AT 3 MONTHS BY MODE OF RESPONSE
We compared the adjusted mean scores for the main outcome measures at 3 months after injury as reported by the three groups of parent respondents. The differences by reporting mode in the adjusted means were less than one standard deviation of the measure in all instances, although after adjustment for child's age, baseline scores, and type of injury, some of these differences were statistically significant (Table 4).
Table 4.
Comparison of Parent Phone with Web Parent Respondents at 3-Month Follow-Up on Selected Measures
| Respondents with Email | Respondents without Email | ||||
|---|---|---|---|---|---|
| Adjusted Mean (SD)* | Adjusted Mean (SD)* | ||||
| [Unadjusted Mean] | [Unadjusted Mean] | ||||
| Measure | Phone (n = 226) | Web (n = 433) | p** | Phone (n = 192) | p** |
| Peds QL Std score 2 to <5 years | 88.8 (16.6) | 88.2 (11.8) | .69 | 86.1 (8.9) | .53 |
| [87.7] | [87.4] | [86.4] | |||
| Peds QL Std score ≥5 years | 83.9 (5.1) | 81.3 (17.3) | .06 | 77.0 (36.0) | .10 |
| [81.3] | [81.0] | [75.8] | |||
| ABAS communication <2 years | 9.8 (1.0) | 10.0 (1.5) | .30 | 10.4 (4.9) | .64 |
| [10.2] | [10.1] | [10.8] | |||
| ABAS self-care <2 years | 8.8 (6.7) | 8.0 (0.8) | .60 | 8.8 (4.9) | .31 |
| [9.1] | [7.9] | [9.3] | |||
| ABAS communication 2–4 years | 10.7 (1.2) | 11.3 (2.5) | .07 | 9.1 (5.4) | .16 |
| [10.5] | [11.4] | [8.6] | |||
| ABAS self-care 2–4 years | 6.7 (1.2) | 6.8 (3.4) | .89 | 5.9 (1.8) | .07 |
| [6.7] | [6.6] | [6.0] | |||
| ABAS communication ≥5 years | 10.4 (1.3) | 11.0 (1.7) | .01 | 9.7 (3.5) | .01 |
| [10.3] | [10.9] | [9.5] | |||
| ABAS self-care ≥5 years | 9.9 (2.6) | 10.4 (1.7) | .04 | 8.9 (3.5) | .005 |
| [9.9] | [10.3] | [9.0] | |||
| CASP ≥5 years | 95.3 (8.9) | 94.5 (5.2) | .29 | 90.7 (5.8) | .001 |
| [94.8] | [94.5] | [89.2] | |||
| Impact on family | 23.1 (15.0) | 22.8 (22.9) | .66 | 27.6 (11.0) | .0001 |
| [23.8] | [22.8] | [28.8] | |||
| Pediatric symptom | 7.5 (1.4) | 6.7 (3.9) | .01 | 8.9 (2.5) | <.000 |
| Checklist ≥2 years | [7.9] | [7.1] | [8.8] | 1 | |
Adjusted for age baseline measures and injury type. The adjusted mean used the mean values across all groups for each covariate.
p values based on the comparison of each of the telephone groups with the web respondents.
ABAS, Adaptive Behavior Assessment System; CASP, Child and Adolescent Scale of Participation; Peds QL, Pediatric Quality of Life scale.
COMPARISON OF RESPONSES AMONG THOSE COMPLETING 3-MONTH FOLLOW-UP SURVEY BY BOTH MODES
There were 45 parents among the initial group of 75 participants enrolled in the study who agreed to do the 3-month follow-up survey by both modes. The responses by mode were very similar to one another, with only one being significantly different by mode (Table 5). All were within 0.5 SD of the test norms.
Table 5.
Comparison of Responses at 3-Month Follow-Up on Selected Measures between Telephone and Web for 45 Parent Respondents Who Completed Survey by Both Modes
| Unadjusted Mean (SD) | |||
|---|---|---|---|
| Measure | Phone | Web | p |
| Peds QL Std score 2–4 years | 89.4 (12.5) | 89.2 (13.3) | .93 |
| Peds QL Std score ≥5 years | 78.8 (18.6) | 80.4 (18.5) | .23 |
| ABAS communication <2 years | 11.0 (1.9) | 9.5 (2.4) | .07 |
| ABAS self-care <2 years | 9.7 (2.7) | 8.3 (2.3) | .05 |
| ABAS communication 2–4 years | 10.0 (2.5) | 10.6 (3.1) | .29 |
| ABAS self-care 2–4 years | 7.1 (2.3) | 6.0 (1.4) | .22 |
| ABAS communication ≥5 years | 10.6 (2.7) | 10.6 (2.9) | .88 |
| ABAS self-care ≥5 years | 10.0 (3.1) | 10.6 (3.3) | .37 |
| CASP ≥5 years | 94.2 (10.2) | 93.4 (11.5) | .07 |
| Impact on family | 21.7 (9.4) | 21.8 (8.8) | .97 |
| Pediatric symptom checklist | 8.1 (5.9) | 7.7 (6.1) | .13 |
ABAS, Adaptive Behavior Assessment System; CASP, Child and Adolescent Scale of Participation; Peds QL, Pediatric Quality of Life scale.
DISCUSSION
This study of completion of surveys on the web versus by telephone indicates that a “digital divide” continues to exist not only in access to email but also to some degree in the use of the web for completion of surveys among those with email. Time to do the online survey was less for parents than doing it by telephone, although there were no such observed differences for adolescents. While the differences by survey mode in reports by parents of functional outcome information about their children appear to be small, some of these differences were statistically significant and indicate that survey mode should be considered in any analysis of such data.
Our study found that race, income, and education were strongly associated with reported access to email, as has been shown previously in many studies (Chakraborty and Bosman 2005). While the majority of people in the United States now have access to the Internet, with high-speed connections available in 86 million homes in 2008 (Commission 2010), use of the Internet, including use related to health care, among those with Internet access has been found to be associated with income, education, and race (Beckjord et al. 2007; Fairle 2007; Martin and Robinson 2007; Hargittai 2008; Atkinson et al. 2009;). Black and Hispanic parents with email access in our study were substantially less likely to complete the survey online than were White parents. Hispanics are less likely to use the Internet to seek health information (Pena-Purcell 2008). Exclusive use of the web mode for the follow-up survey would have excluded a large proportion of low-income, less-educated, rural, and minority parents and would have resulted in a sample that was not representative of the population of injured children. Availability of the web mode for survey responses is cost saving, but it will require cautious interpretation of the results.
Surprising to us was that only a minority of adolescents with email access completed the survey online. Adolescents are typically early adopters of technology, and the use of cell phones, text messaging, and social network sites may be rapidly replacing email as the method of communication in this age group (Lenjnieks 2008). In 2008, four out of five teens were reported to carry a cell phone (Lenjnieks 2008). Many adolescents only use email that is accessed within social network sites; this is not accessible to people outside of those sites and thus cannot be used for Internet-based surveys.
The Internet-based survey was quicker to complete than the telephone survey for parents although not for adolescents. Faster completion of surveys online compared to telephone has been shown in some prior studies (Rankin et al. 2008), while other studies have shown no difference in time to completion (Parks et al. 2006), and some have found that web surveys took longer than telephone surveys (Fricker et al. 2005). These different findings may be related to the types of questions on the survey, such as use of open-ended questions (Fricker et al. 2005), or how the survey is formatted (Dillman and Smyth 2007).
To our knowledge, our study is the first to compare information on health-related quality of life and functioning reported by parents about their children using different modes for the survey. While the reliability of such information has been examined for self-report by adults (Graham et al. 2006; Graham and Papandonatos 2008;), it has not been examined for parents reporting on their children. There were small differences by mode, all of which were less than one standard deviation of the norms for the tests. However, some of these differences were statistically significant and analyses using both modes may need to take mode into account in the analyses. Among the small group of 45 parents who reported using both modes, there was only one significant difference in the outcome measures and differences were all <0.5 standard deviation of the norms.
This study does have some important limitations. The method of survey completion mode was not randomized and only a small number of respondents were asked to complete the survey by both modes. The majority of respondents live in the Pacific Northwest and thus the results may not be generalizable to all areas of the country. We only conducted this study among English and Spanish speakers, thereby limiting our ability to generalize our findings to other ethnic groups. Finally, we assumed that having an email address translated to having email access. It is possible that some parents with an email address chose not to provide this information at study entry, and thus we may be underestimating the overall access of parents to email.
In conclusion, the use of Internet-based surveys by parents appeared to provide information on their children that was similar to that obtained by a traditional telephone-based survey. Given the cost savings associated with this mode, greater use of the Internet, supplemented by telephone for those without email, or email nonrespondents, appears to be a valuable tool for collecting information for research studies.
Acknowledgments
Joint Acknowledgment/Disclosure Statement: This study was funded by a grant (grant number R49 CE 001021) from the National Center for Injury Prevention and Control and Centers for Disease Control and Prevention. The study sponsor had no role in the review or approval of the manuscript.
Disclosures: None.
Disclaimers: None.
SUPPORTING INFORMATION
Additional supporting information may be found in the online version of this article:
Appendix SA1: Author Matrix.
Please note: Wiley-Blackwell is not responsible for the content or functionality of any supporting materials supplied by the authors. Any queries (other than missing material) should be directed to the corresponding author for the article.
REFERENCES
- Aquilino WS. Interview Mode Effects in Surveys of Drug and Alcohol Use: A Field Experiment. Public Opinion Quarterly. 1994;58:210–40. [Google Scholar]
- Atkinson NL, Saperstein SL, Pleiss J. Using the Internet for Health-Related Activities: Findings from a National Probability Sample. Journal of Medical Internet Research. 2009;11(1):e4. doi: 10.2196/jmir.1035. [DOI] [PMC free article] [PubMed] [Google Scholar]
- Beckjord EB, Finney Rutten LJ, Squiers L, Arora NK, Volckmann L, Moser RP, Hesse BW. Use of the Internet to Communicate with Health Care Providers in the United States: Estimates from the 2003 and 2005 Health Information National Trends Surveys (HINTS) Journal of Medical Internet Research. 2007;9(3):e20. doi: 10.2196/jmir.9.3.e20. [DOI] [PMC free article] [PubMed] [Google Scholar]
- Bedell G. Research Update: The Child and Adolescent Scale of Participation. Brain Injury Professional. 2006;3(4):14. [Google Scholar]
- Chakraborty J, Bosman MM. Measuring the Digital Divide in the United States: Race, Income and Personal Computer Ownership. The Professional Geographer. 2005;57(3):395–410. [Google Scholar]
- Commission FC. 2010. High-Speed Services for Internet Access: Status as of December 31, 2008, Industry Analysis and Technology Division. Wireline Competition Bureau.
- Curtin R, Presser S, Singer E. Changes in Telephone Survey Non-Response over the Past Quarter Century. Public Opinion Quarterly. 2005;69:87–98. [Google Scholar]
- de Leeuw ED, van der Zouwen J. Data Quality in Telephone and Face to Face Surveys: A Comparative Meta-Analysis. In: Groves RM, et al., editors. Telephone Survey Methodology. New York: Wiley; 1988. pp. 273–299. [Google Scholar]
- Dillman DA, Smyth JD. Design Effects in the Transition to Web-Based Surveys. American Journal of Preventive Medicine. 2007;32(5, Suppl):S90–6. doi: 10.1016/j.amepre.2007.03.008. [DOI] [PubMed] [Google Scholar]
- Fahimi M, Link M, Mokdad A, Schwartz DA, Levy P. Tracking Chronic Disease and Risk Behavior Prevalence as Survey Participation Declines: Statistics from the Behavioral Risk Factor Surveillance System and Other National Surveys. Preventing Chronic Disease. 2008;5(3):A80. [PMC free article] [PubMed] [Google Scholar]
- Fairle RW. Explaining Differences in Access to Home Computers and the Internet: A Comparison of Latino Groups to Other Ethnic and Racial Groups. Electronic Commerce Research. 2007;7:265–91. [Google Scholar]
- Fricker S, Galesic M, Tourangeau R, Yan T. An Experimental Comparison of Web and Telephone Surveys. Public Opinion Quarterly. 2005;69(3):370–92. [Google Scholar]
- Galesic M, Tourangeau R, Couper MP. Complementing Random-Digit-Dial Telephone Surveys with Other Approaches to Collecting Sensitive Data. American Journal of Preventive Medicine. 2006;31(5):437–43. doi: 10.1016/j.amepre.2006.07.023. [DOI] [PubMed] [Google Scholar]
- Graham AL, Papandonatos GD. Reliability of Internet- versus Telephone-Administered Questionnaires in a Diverse Sample of Smokers. Journal of Medical Internet Research. 2008;10(1):e8. doi: 10.2196/jmir.987. [DOI] [PMC free article] [PubMed] [Google Scholar]
- Graham AL, Papandonatos GD, Bock BC, Cobb NK, Baskin-Sommers A, Niaura R, Abrams DB. Internet- vs. Telephone-Administered Questionnaires in a Randomized Trial of Smoking Cessation. Nicotine and Tobacco Research. 2006;8(Suppl 1):S49–57. doi: 10.1080/14622200601045367. [DOI] [PMC free article] [PubMed] [Google Scholar]
- Hargittai E. The Digital Reproduction of Inequality. In: Grusky DB, editor. Socail Stratification. Class, Race and Gender in Sociological Perspective. Boulder, CO: Westview Press; 2008. pp. 936–44. [Google Scholar]
- Harrison PL, Oakland T. Adaptive Behavior Assessment System Manual. San Antonio, TX: Harcourt Assessment; 2003. [Google Scholar]
- Jellinek MS, Murphy JM. Screening for Psychosocial Disorders in Pediatric Practice. American Journal of Diseases of Children. 1988;142(11):1153–7. doi: 10.1001/archpedi.1988.02150110031013. [DOI] [PubMed] [Google Scholar]
- Lenjnieks C. 2008. A Generation Unplugged. Research Report, Harris Interactive, 2009.
- Link MW, Mokdad AH. Alternative Modes for Health Surveillance Surveys: An Experiment with Web, Mail, and Telephone. Epidemiology. 2005a;16(5):701–4. doi: 10.1097/01.ede.0000172138.67080.7f. [DOI] [PubMed] [Google Scholar]
- Link MW. Effects of Survey Mode on Self-Reports of Adult Alcohol Consumption: A Comparison of Mail, Web and Telephone Approaches. Journal of Studies on Alcohol. 2005b;66(2):239–45. doi: 10.15288/jsa.2005.66.239. [DOI] [PubMed] [Google Scholar]
- Martin SP, Robinson JP. The Income Digital Divide: Trends and Prediction for Levels of Internet Use. Social Problems. 2007;54:1–22. [Google Scholar]
- McCarthy ML, MacKenzie EJ, Durbin DR, Aitken ME, Jaffe KM, Paidas CN, Slomine BS, Dorsch AD, Berk RA, Christensen JR, Ding R for the Children's Health After Trauma Study Group. The Pediatric Quality of Life Inventory: An Evaluation of its Reliability and Validity for Children with Traumatic Brain Injury. Archives of Physical Medicine and Rehabilitation. 2005;86(10):1901–9. doi: 10.1016/j.apmr.2005.03.026. [DOI] [PubMed] [Google Scholar]
- McCarthy ML, MacKenzie EJ, Durbin DR, Aitken ME, Jaffe KM, Paidas CN, Slomine BS, Dorsch AM, Christensen JR, Ding R for the Children's Health After Trauma Study Group. Health-Related Quality of Life during the First Year Post Traumatic Brain Injury. Archives of Pediatrics and Adolescent Medicine. 2006;160:252–60. doi: 10.1001/archpedi.160.3.252. [DOI] [PubMed] [Google Scholar]
- McMorris BJ, Petrie RS, Catalano RF, Fleming CB, Haggerty KP, Abbott RD. Use of Web and In-Person Survey Modes to Gather Data from Young Adults on Sex and Drug Use: An Evaluation of Cost, Time, and Survey Error Based on a Randomized Mixed-Mode Design. Evaluation Review. 2009;33(2):138–58. doi: 10.1177/0193841X08326463. [DOI] [PMC free article] [PubMed] [Google Scholar]
- Parks KA, Pardi AM, Bradizza CM. Collecting Data on Alcohol Use and Alcohol-Related Victimization: A Comparison of Telephone and Web-Based Survey Methods. Journal of Studies on Alcohol. 2006;67(2):318–23. doi: 10.15288/jsa.2006.67.318. [DOI] [PubMed] [Google Scholar]
- Pena-Purcell N. Hispanics' Use of Internet Health Information: An Exploratory Study. Journal of the Medical Library Association. 2008;96(2):101–7. doi: 10.3163/1536-5050.96.2.101. [DOI] [PMC free article] [PubMed] [Google Scholar]
- Rankin KM, Rauscher GH, McCarthy BM, Erdal S, Lada P, Il'yasova D, Davis F. Comparing the Reliability of Responses to Telephone-Administered versus Self-Administered Web-Based Surveys in a Case-Control Study of Adult Malignant Brain Cancer. Cancer Epidemiology, Biomarkers and Prevention. 2008;17(10):2639–46. doi: 10.1158/1055-9965.EPI-08-0304. [DOI] [PMC free article] [PubMed] [Google Scholar]
- Santuzzi NR, Brodnik MS, Rinehart-Thompson L, Klatt M. Patient Satisfaction: How Do Qualitative Comments Relate to Quantitative Scores on a Satisfaction Survey? Quality Management in Health Care. 2009;18(1):3–18. doi: 10.1097/01.QMH.0000344589.61971.41. [DOI] [PubMed] [Google Scholar]
- Simon G, Rutter C, Crosier M, Scott J, Operskalski BH, Ludman E. Are Comparisons of Consumer Satisfaction with Providers Biased by Nonresponse or Case–Mix Differences? Psychiatric Services. 2009;60(1):67–73. doi: 10.1176/appi.ps.60.1.67. [DOI] [PMC free article] [PubMed] [Google Scholar]
- Stein RE, Jessop DJ. The Impact on Family Scale Revisited: Further Psychometric Data. Journal of Developmental and Behavioral Pediatrics. 2003;24(1):9–16. [PubMed] [Google Scholar]
- Tourangeau R. Survey Research and Societal Change. Annual Review of Psychology. 2004;55:775–801. doi: 10.1146/annurev.psych.55.090902.142040. [DOI] [PubMed] [Google Scholar]
- Varni JW, Seid M, Kurtin P. PedsQL 4.0: Reliability and Validity of the Pediatric Quality of Life Inventory Version 4.0 Generic Core Scales in Healthy and Patient Populations. Medical Care. 2001;39(8):800–12. doi: 10.1097/00005650-200108000-00006. [DOI] [PubMed] [Google Scholar]
- Wilson KR, Wallin JS, Reiser C. Social Stratification and the Digital Divide. Social Science Computer Review. 2003;21(2):133–43. [Google Scholar]
Associated Data
This section collects any data citations, data availability statements, or supplementary materials included in this article.