Abstract
In rapid scan EPR the magnetic field is scanned through the signal in a time that is short relative to electron spin relaxation times. Previously it was shown that the slow scan lineshape could be recovered from triangular rapid scans by Fourier deconvolution. In this paper a general Fourier deconvolution method is described and demonstrated to recover the slow scan lineshape from sinusoidal rapid scans. Since an analytical expression for the Fourier transform of the driving function for a sinusoidal scan was not readily apparent, a numerical method was developed to do the deconvolution. The slow scan EPR lineshapes recovered from rapid triangular and sinusoidal scans are in excellent agreement for lithium phthalocyanine, a trityl radical, and the nitroxyl radical, tempone. The availability of a method to deconvolute sinusoidal rapid scans makes it possible to scan faster than is feasible for triangular scans because of hardware limitations on triangular scans.
Keywords: deconvolution, direct detection, lithium phthalocyanine, rapid scan, sinusoidal scan, tempone, trityl
1. Introduction
Development of rapid scan magnetic resonance started in the 1970s as an alternative to pulse, continuous-wave, and stochastic excitation techniques in NMR [1; 2]. The method has relatively high sensitivity, as in pulse NMR, but permits selective scans that edit out strong solvent peaks [1]. The sequential excitation of spin packets, as in continuous wave (CW) NMR, helps to reduce cross-talk between spins belonging to different lines in the spectrum. Rapid scan EPR means that transition through resonance occurs in a time that is short relative to electron spin relaxation times. This causes oscillation in the recorded signal. The slow scan signal can be recovered by deconvolution [1], provided that the excitation of the spin system produces a linear response [1; 3]. A linear system can be completely described by its impulse response, which is the free induction decay (FID) for the magnetic resonance case. The output signal for a linear system is the convolution of the input with the impulse response. The equations derived for the NMR experiments are specific to linear scans [1; 2].
There are several advantages of EPR rapid scans [4–6]. (i) The entire spectrum is covered during the fast scan, so all spins are excited and contribute to the detected signal. (ii) For a specified resonator quality factor, Q, the scan rate and intensity of the excitation field (B1) can be selected to optimize the number of signal averages per unit time. (iii) Direct detection gives the absorption signal without the need for integration of the first-derivative signal that is conventionally recorded in slow-scan CW EPR. (iv) For EPR imaging with magnetic field gradients the signal-to-noise for the absorption spectrum decreases approximately linearly with increasing gradient instead of the approximately quadratic decrease for the first-derivative spectrum.
The driving function for a rapid scan, d(t), is given by Eq. (1).
| (1) |
where ω(t) = −γe b(t) − ωs(t), where b(t) and ωs(t) are the time varying components of the external magnetic field and source frequency, respectively, and γe = −1.76086×10+7 s−1 G−1 is the electron gyromagnetic ratio. The rapid scan NMR experiments were performed with linear scans [2] so the input, driving function, that was used to recover the impulse response by Fourier deconvolution had the form dlin(t) = exp{jat2/2} (Eq. (1)), where ω(t) = at and a is the frequency scan rate in rad/s2 [1].
For rapid scan EPR [4–11] it has been shown that the slow scan signals could be recovered from triangular field scans [4], using a procedure analogous to that demonstrated for NMR. Producing a fast triangular field scan that encompasses a broad EPR spectrum is a hardware challenge. Linearity of the scan requires response to higher harmonics of the scan frequency, which in turn requires higher voltages. With sinusoidal scans, the scan coils can be series resonated, thereby reducing the driver voltage and power requirements. This provides a strong incentive for sinusoidal rapid scans. However, the lack of a deconvolution procedure for sinusoidal rapid scans has impeded its development. In this report a general method is described for calculating the slow scan spectrum from the rapid scan signal for any monotonically increasing or decreasing waveform, and the method is applied to sinusoidal scans.
2. Sinusoidal Deconvolution
2.1 Theory
The response of a linear spin system, r(t), to excitation in the form of driving function d(t) is the convolution of its impulse response, h(t) with d(t) Eq. (2).
| (2) |
The experimental rapid scan signal is direct-detected in quadrature by phase sensitive detection with either a double-balanced mixer [12] or an RF-biased crystal [13] using the constant source frequency as a reference, which yields s(t). The resonance frequency of the spin system changes as the field is swept. Post-processing is used to convert s(t) to r(t), which is the signal that would have been observed if the reference frequency had been swept proportional to the swept field. This is accomplished by multiplying the complex conjugate of the detected signal by the driving function, d(t).
| (3) |
The slow-scan lineshape, H(ω), is the Fourier transform of the FID (the impulse response h(t)). Fourier transformation of Eq. (2) and solving for H(ω) gives
| (4) |
where upper case letters designate the Fourier transforms. The calculation of H(ω) rather than h(t) is advantageous because deconvolution in the time domain corresponds to division in the frequency domain. This process is commonly called Fourier deconvolution.
The rapid scan EPR experiments differ from the rapid scan NMR experiments [1; 2] because the magnetic field is scanned, which changes the Larmor frequency, while the reference frequency that is used in the detection is the constant source frequency. For the half cycle of a sinusoidal scan in which the magnetic field increases, the time-dependent contribution to the external magnetic field is bm(t) = −Bmcos (2πfmt). Conversion to the corresponding increase in the Larmor frequency gives ω(t) = γeBmcos (2πfmt), which is substituted into Eq. (1) to give the driving function, Eq. (5)
| (5) |
where Bm is half the peak-to-peak amplitude of the scan and fm is the scan frequency. For the half cycle with decreasing field the algebraic sign on ω(t) would be reversed, which changes the plus sign in Eq. (5) to minus.
In this paper deconvolution is used to calculate the impulse response of the spins based on the known input (the driving function) and the measured output signal. Unlike the triangular scan case, an analytical expression for the Fourier transform of the driving function for a half cycle of a sinusoidal scan is not available, so numerical Fourier transformation was used to find D(ω).
2.2 Modified Driving Function
The method described in Eq. (2 – 5) yields the deconvolved spectrum for the complete half-cycle of the sinusoidal driving function, and no further post-processing is required. However, post-processing was used to remove undesirable oscillations that resulted from the form of the functions.
|D(ω)| is the absolute value of the Fourier transform of Eq. (5). The phase of dsin(t) [Eq. (5)] changes monotonically with time, so |D(ω)| should be a smooth function. However, because of the abrupt start and end of one half-cycle of a sine wave, |D(ω)| has unwanted high-frequency oscillations as seen in the red line in Fig. 1b. Smoothing of the abrupt beginning and end of the driving function by apodization, which is often used to suppress oscillations, significantly distorts the driving function, so a different numerical method was developed. For data analysis, the magnetic field scan profile for a half period of the sinusoid was modified as shown in Fig. (1a). The central 85% of the scan that is most useful for spectroscopy was not changed. Tangential lines were added at both ends, extending the total time to 3/2 the period of the sine wave. The result is a linear scan with a sinusoidal central segment (Fig. 1a). To make the slope continuous at the transition, the slope of the extensions is the slope of the sinusoid at the transition, which minimizes distortions in the Fourier transform. The modified driving function was calculated from the magnetic field scan profile in Fig. 1a (blue line) substituted into Eq. (5). The Fourier transform of the modified driving function is designated as D’(ω). The absolute values of the Fourier transforms of the driving functions for the sinusoidal half-cycle |D(ω)| and for the extended field scan profiles in Fig. 1a |D’(ω)| are shown in Fig. 1b. The x-axis of Fig. 1b was converted from frequency to field units (B=−ω/γe) to facilitate comparison with the experimental scan range. At the extremes of |D(ω)| there are amplitude oscillations of about 7%. If D(ω) is used in calculating H(ω), a correspondingly large oscillation is introduced. Extension of the field scan profile (Fig. 1a) increases the frequency range, improves frequency resolution, and avoids the oscillatory behavior in the central region of interest in |D(ω)|. Only the region of D’(ω), that corresponds to the central 85% of the experimental scan is used in the data analysis.
Fig. 1.
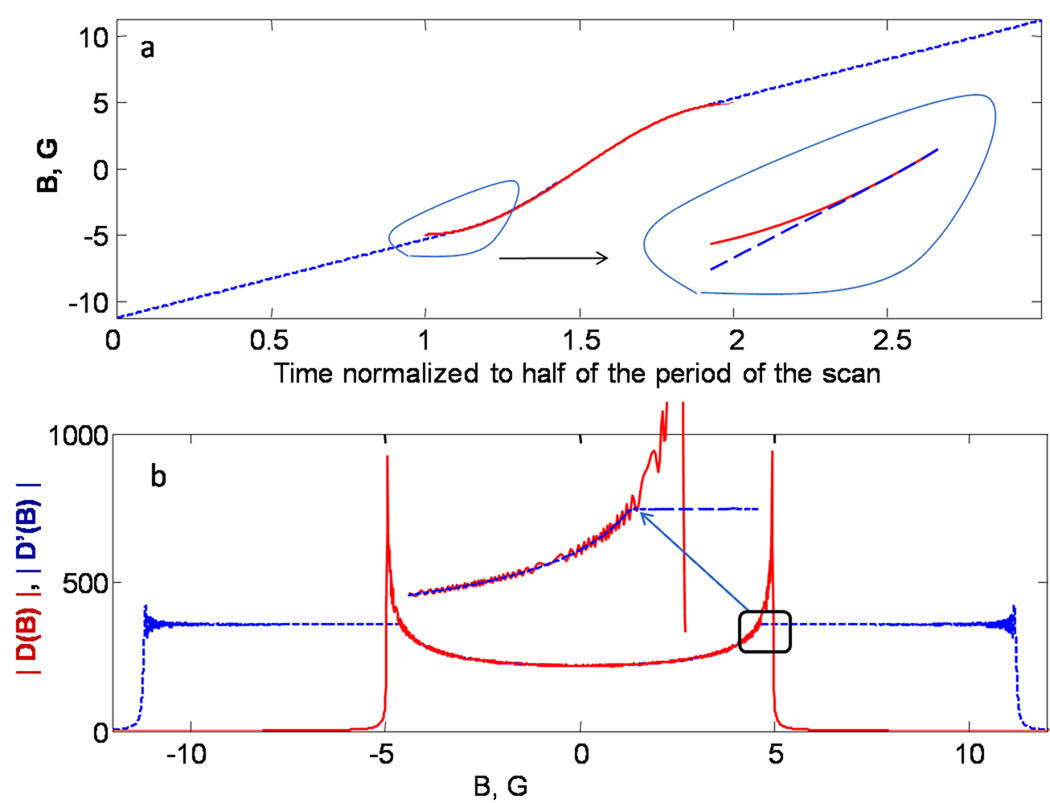
(a) The modified magnetic field scan profile (blue dashed line) is compared with the experimental sinusoidal scan (red curve). The insert shows the transition from sinusoidal to linear scan in detail. (b) Absolute value of the Fourier transforms of the driving functions for the sinusoidal (red) |D(B)| and modified field scan profiles (dashed blue) |D’(B)|. The insert shows that |D’(B)| coincides with |D(B)| between about −4.25 and 4.25 G, but does not exhibit oscillatory behavior. To emphasize the correspondence between the y-axis of (a) and the x-axis of (b), both axes are labeled in gauss.
2.3 Data sampling
In order to avoid distortion of the deconvoluted EPR lines, the rapid scan spectra must be sampled at sufficiently short time intervals. The sampling period must be less than δt= π/(−γe × width) where width is the span of the modified magnetic field scan profile. For the example shown in Fig 1a the width is 22.4 G so the sampling period must be 8 ns or less. If experimental data are recorded at a longer sampling interval, the data must be numerically interpolated to increase the time-domain resolution.
2.4 Noise
To express the impact of deconvolution on the noise, it is convenient to rewrite Eq. (4) in magnetic field units as
| (6) |
where B = −ω/γe is the magnetic field and N(B) represents noise. For white noise N(B) = constant N. Since |D’(B)| varies with magnetic field (frequency) (Fig. 1b), the noise in the deconvoluted EPR spectrum, H’(B), depends on the position in the scan. At the central point in the scan, the scan rate is fastest, the absolute value of the Fourier transform of the driving function is smallest (see Fig. 1b), and noise is largest. The difference in noise between locations in the scan can be characterized as the ratio λ(B) = |D(B)|/|D(0)| (Fig. 1b). For example, λ = 1.3, 1.38, or 1.52 for 80, 85, or 90% of the full scan width, respectively. The variation in noise as a function of position in the deconvoluted spectrum can also be understood in terms of data acquisition times. In the regions where the scan rate is slower, data acquisition times per gauss are longer, which decreases noise.
In many applications of Fourier deconvolution the stability of the solution is impacted by zeros in the divisor. Since the amplitude of the Fourier transform of the driving function does not approach zero, division by zero is not a source of instability in the sinusoidal scan deconvolution.
3. Experimental
3.1 Sample preparation
Lithium phthalocyanine (LiPc) prepared electrochemically following procedures in the literature [14; 15] was provided by Prof. Swartz, Dartmouth University. Multiple small crystals were placed in a quartz 3-mm OD tube with 0.5 mm wall thickness. The tube was purged with gaseous nitrogen to remove oxygen and flame sealed. A solution (0.2 mM) of Nycomed trityl-CD3 (methyl tris(8-carboxy-2,2,6,6-tetramethyl (d3)-benzo[1,2-d:4,5-d’]bis(1,3)dithiol-4-yl)- tri sodium salt) in water in a 4mm O.D. quartz tube was purged extensively with gaseous nitrogen and then flame sealed. A 0.43 mM solution of tempone-d16 (CDN Isotopes) in water was purged extensively with nitrogen and flame sealed.
3.2 Spectroscopy
Data were recorded on the previously described 250 MHz spectrometer [12] with the wire cross-loop resonator designed for rapid scans [16]. To accurately compare sinusoidal scan deconvolution with the well-tested triangle scan deconvolution, a composite waveform was produced using an arbitrary waveform generator, Tektronix AWG 2041. The waveform (Fig. 2) consisted of two full triangular cycles followed by two full sinusoidal cycles. The sinusoidal and triangular waveforms had the same amplitude and frequency. The signal from the AWG was connected to the external input port of the coil driver described in reference [17]. The coil driver converts the voltage waveform to a current waveform in the rapid scan coils. Signals for a sample of LiPc were acquired during the up-field segment of the last half cycle of the triangular and sinusoidal scans using Bm = 5 G, fm = 1.50 kHz. Sinusoidal scans for the trityl and nitroxyl samples were acquired with Bm = 2.5 G, fm = 1.50 kHz or Bm = 18.8 G, fm = 4.00 kHz, respectively.
Fig. 2.
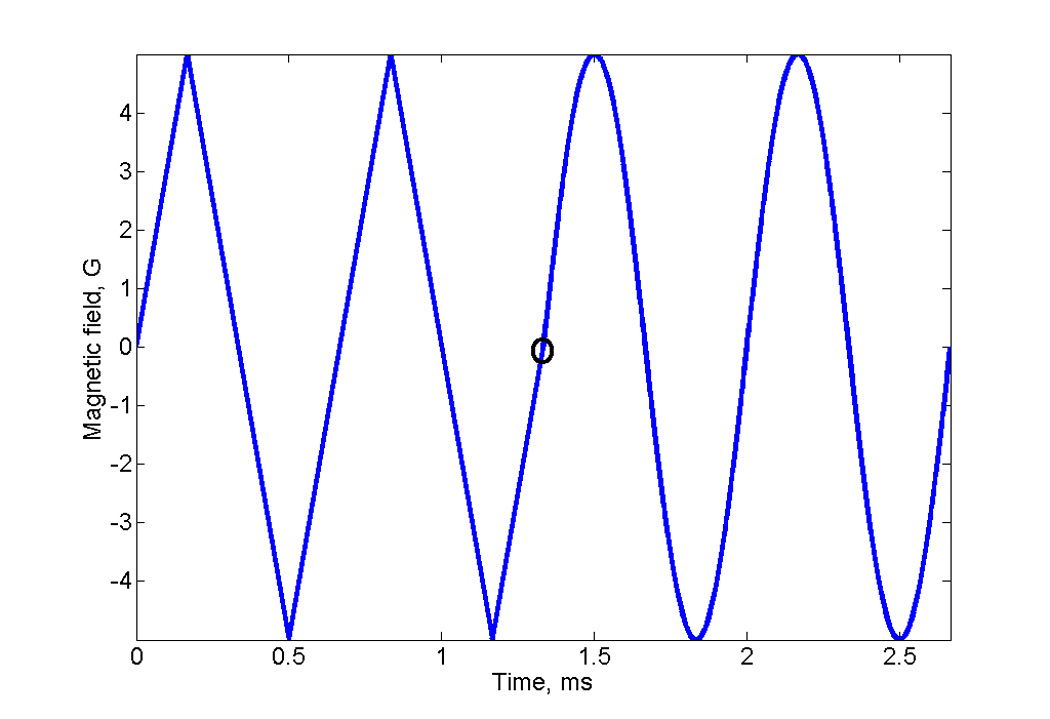
Composite magnetic field profile for rapid scans of LiPc, consisting of two cycles of triangular scan followed by two cycles of sinusoidal scan. The transition between the triangular and sinusoidal scans is marked with a circle.
Fig. 3 shows segments of the triangular and sinusoidal rapid scans for LiPc. Spectra were measured at approximately the external magnetic field that positions the signals in the center of the scans. The sinusoidal scan (trace 2) exhibits more oscillations and lower peak amplitude than the triangular scan because of the faster scan rate at the center of the sinusoidal scan. In the half-cycle with increasing magnetic field the absorption signal is positive and the dispersion signal goes positive before it goes negative (Fig. 10.6 in [18]), as is shown.
Fig. 3.
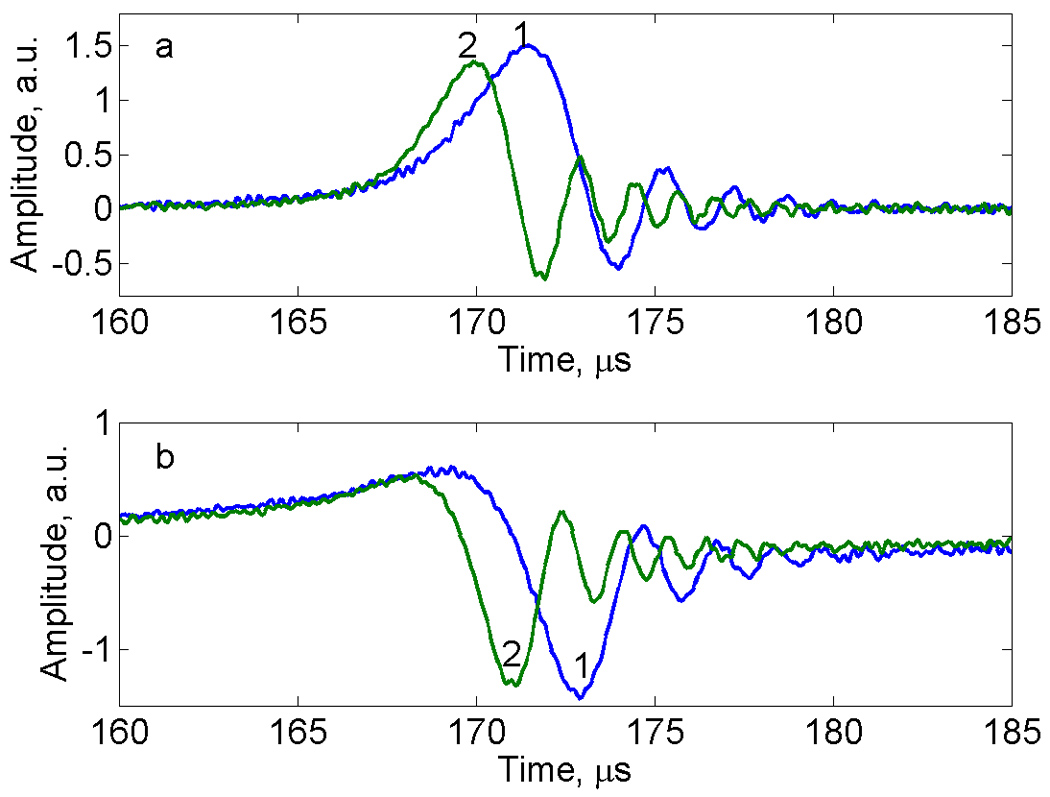
Central 10% of rapid scan (a) absorption and (b) dispersion signals for LiPc measured with up-field triangular, trace 1, or sinusoidal, trace 2, scans. For each scan, the x axis is relative to the beginning of the half cycle. Since the signal was not exactly centered in the scan, resonance occurs at slightly different times in the scans.
3.3 Results of deconvolution
Slow-scan spectra were obtained from triangular rapid scan signals as previously reported [1; 4]. Sinusoidal rapid scans were deconvoluted using the method described in this paper. The spectra obtained by the two methods are in excellent agreement as shown in Fig. 4.
Fig. 4.
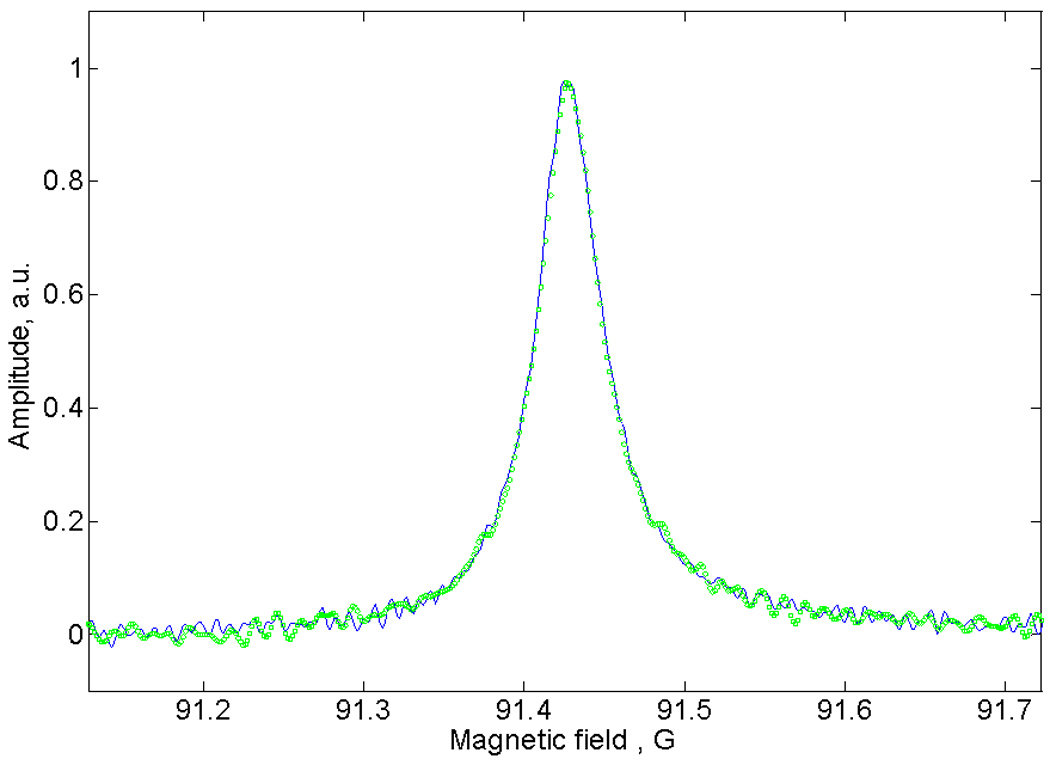
Segments of the slow scan absorption spectra of LiPc obtained by deconvolution of the triangular (blue solid) and sinusoidal (small green circles) scans shown in Fig. 3.
Rapid scan EPR signals were measured for 50 static magnetic field offsets ranging from −4.7 to +4.7 G relative to the field that positioned the signal in the center of the 10 G scan. Deconvoluted spectra were fitted with a Lorenzian lineshape to obtain line intensities and corresponding relaxation times. For both triangular and sinusoidal scans, the signal amplitudes and relaxation times were independent of the position in the scan with relative standard deviations of about 2.5% or 2.2%, respectively, for the central 85% of the scan. There were no systematic trends in the deviations. Outside the 85% range (±4.25 G), lineshapes for both the triangular and sinusoidal scans were distorted, and the fitting parameters showed larger deviations from the expected values for both amplitudes and relaxation times. There are several reasons for the distortion at the extremes of the scans. For both sinusoidal and triangular scans, as the signal gets closer to the extremes of the scan the lines for the up- and down-field scans begin to overlap. The overlap problem is less for sinusoidal scans than for triangular scans with the same scan width. For example, resonance for a peak that is at 85% of the scan width occurs earlier in the sinusoidal scan, so more time is available for spin-spin relaxation before the beginning of the next excitation. A problem that is specific to the triangular scans is that the waveform is not perfectly linear near the extremes, whereas the sinusoidal waveform does not distort near the extremes. A potential problem with the sinusoidal scans is that there may be power saturation of the signal when the scan rate becomes very slow near the extremes. The problem of saturation at the extremes of the scan could be decreased by reducing the amplitude of B1. The drawback to this approach is the resulting decrease in the EPR signal intensity in the faster scan rate region of the sinusoidal scan.
The sinusoidal deconvolution method was tested on an aqueous solution of trityl-CD3. The EPR spectrum of this sample includes multiple 13C hyperfine lines. A comparison of the deconvolution results for triangular and sinusoidal scans is shown in Fig. 5. The linewidths of the signals agree with that obtained in traditional slow scans. The positions and relative intensities of the hyperfine lines in the two spectra are in excellent agreement with the known hyperfine coupling constants for the radical, which confirms the linearity of the triangular scans and fidelity of the sinusoidal scans. Note that the noise level in the deconvoluted spectrum is constant throughout the triangular scan, but noise is higher in the center of the sinusoidal scan than in the extremes, as discussed above.
Fig. 5.
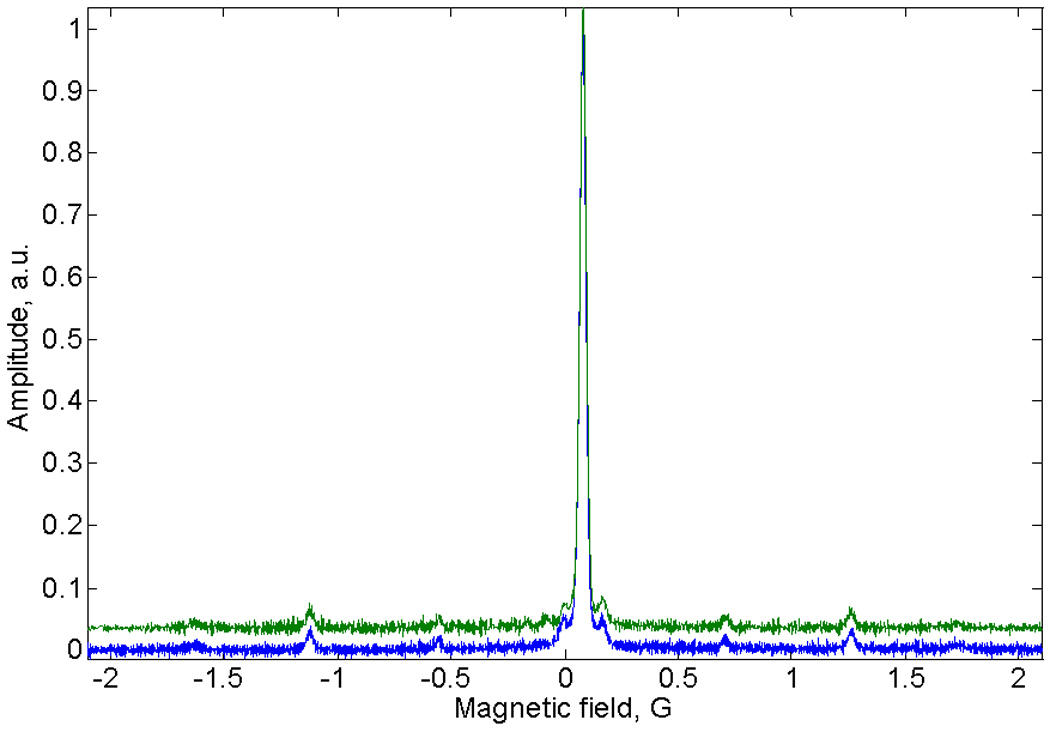
EPR spectra of trityl-CD3 obtained by deconvolution of sinusoidal (upper, green line) or triangular (lower, blue dashed line) rapid scans. 85% of the full scan width is displayed.
Sinusoidal deconvolution also was tested using a 0.43 mM aqueous solution of tempone-d16. To record all three lines of the spectrum requires a wider scan than for LiPc or trityl. Rapid scan data for a half-cycle are shown in Fig. 6a. There are more rapid-scan oscillations on the nitrogen hyperfine line in the center of the spectrum than for the lines at higher or lower field because the scan rate is faster in the center of the scan. The deconvoluted signal agrees well with the first integral of the conventional CW spectrum (Fig. 6b).
Fig. 6.
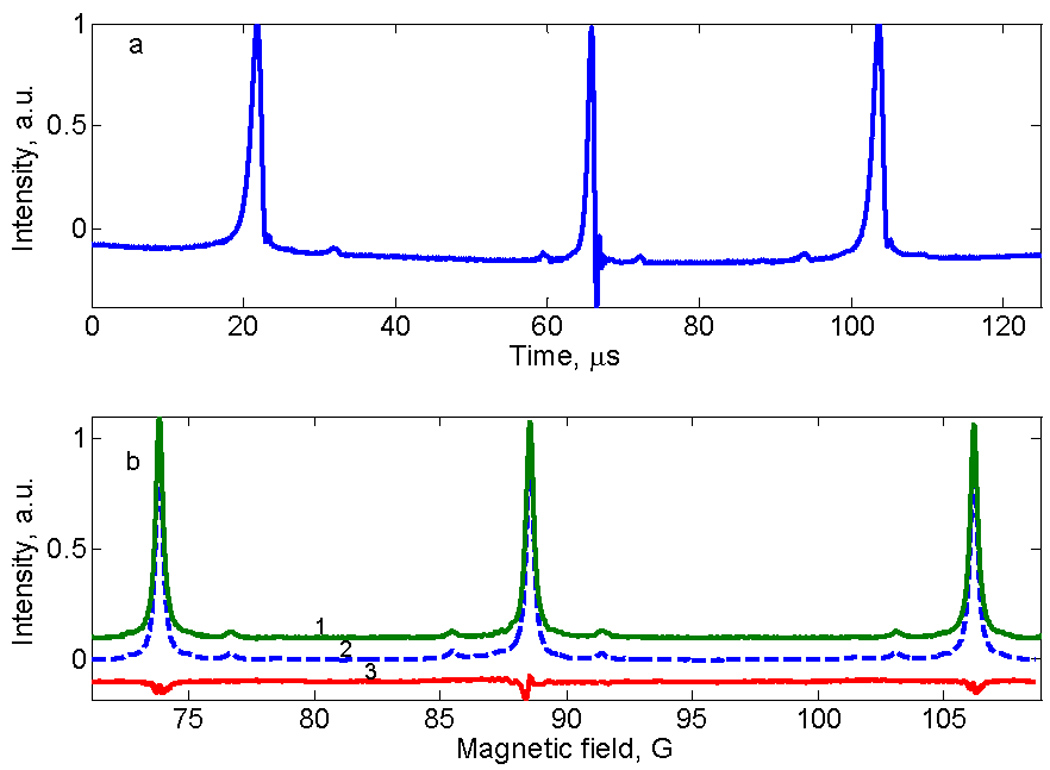
EPR spectra of aqueous tempone-d16. a) Down-field half cycle of the sinusoidal rapid scan. b) Comparison of the sum of spectra obtained by deconvolution of up-field and down-field signals (trace 1, green) with CW spectrum (trace 2, blue dashed line), and the difference between traces 1 and 2 (trace 3, red).
These results demonstrate that sinusoidal rapid scan signals can be deconvoluted to recover the slow-scan spectra. Sinusoidal scans with resonated coils will facilitate faster scan rates than can currently be achieved with triangular scans.
Acknowledgments
Funding from the National Institutes of Health NIBIB EB00557 and National Science Foundation IDBR 0753018 is gratefully acknowledged. Professor Harold Swartz, Dartmouth University, graciously provided LiPc that was prepared with funding from NIBIB EB002180 for the EPR Center for the Study of Viable Systems. The trityl-CD3 radical was a generous gift from Nycomed Innovations AB to Professor Howard Halpern, University of Chicago, who supplied it for this study, as a collaborative project under NIBIB EB002034 for the Center for EPR Imaging in Vivo Physiology. We thank Josef Dadok for providing additional details of the experiments described in Ref. [2]. Preliminary work on this project was done by Tomasz Czechowski.
Footnotes
Publisher's Disclaimer: This is a PDF file of an unedited manuscript that has been accepted for publication. As a service to our customers we are providing this early version of the manuscript. The manuscript will undergo copyediting, typesetting, and review of the resulting proof before it is published in its final citable form. Please note that during the production process errors may be discovered which could affect the content, and all legal disclaimers that apply to the journal pertain.
References
- 1.Gupta RK, Ferretti JA, Becker ED. Rapid scan Fourier transform NMR spectroscopy. J. Magn. Reson. 1974;13:275–290. [Google Scholar]
- 2.Dadok J, Sprecher RF. Correlation NMR spectroscopy. J. Magn. Reson. 1974;13:243–248. [Google Scholar]
- 3.Winter J. Spin Resonance of Conduction Electrons, Magnetic Resonance in Metals. Oxford: Clarendon Press; 1971. pp. 155–156. [Google Scholar]
- 4.Joshi JP, Ballard JR, Rinard GA, Quine RW, Eaton SS, Eaton GR. Rapid-Scan EPR with Triangular Scans and Fourier Deconvolution to Recover the Slow-Scan Spectrum. J. Magn. Reson. 2005;175:44–51. doi: 10.1016/j.jmr.2005.03.013. [DOI] [PubMed] [Google Scholar]
- 5.Tseitlin M, Czechowski T, Eaton SS, Eaton GR. Regularized Optimization (RO) Reconstruction for Oximetric EPR Imaging. J. Magn. Reson. 2008;194:212–221. doi: 10.1016/j.jmr.2008.07.002. [DOI] [PMC free article] [PubMed] [Google Scholar]
- 6.Tseitlin M, Dhami A, Eaton SS, Eaton GR. Comparison of Maximum Entropy and Filtered Back-Projection Methods to Reconstruct Rapid-Scan EPR Images. J. Magn. Res. 2007;184:157–168. doi: 10.1016/j.jmr.2006.09.027. [DOI] [PMC free article] [PubMed] [Google Scholar]
- 7.Stoner JW, Szymanski D, Eaton SS, Quine RW, Rinard GA, Eaton GR. Direct-detected rapid-scan EPR at 250 MHz. J. Magn. Res. 2004;170:127–135. doi: 10.1016/j.jmr.2004.06.008. [DOI] [PubMed] [Google Scholar]
- 8.Subramanian S, Koscielniak J, Devasahayam N, Pursely RH, Pohida TJ, Krishna M. A New Strategy for Fast CW EPR Imaging: Direct Detection with Simultaneous Rapid-Scan and Rotating Gradients. J. Magn. Reson. 2007;186:212–219. doi: 10.1016/j.jmr.2007.01.023. [DOI] [PMC free article] [PubMed] [Google Scholar]
- 9.Tseitlin M, Czechowski T, Quine RW, Eaton SS, Eaton GR. Background Removal Procedure for Rapid Scan EPR. J. Magn. Reson. 2009;196:48–53. doi: 10.1016/j.jmr.2008.10.012. [DOI] [PMC free article] [PubMed] [Google Scholar]
- 10.Tseitlin M, Dhami A, Quine RW, Rinard GA, Eaton SS, Eaton GR. Electron Spin T2 of a Nitroxyl Radical at 250 MHz Measured by Rapid Scan EPR. Appl. Magn. Reson. 2006;30:651–656. [Google Scholar]
- 11.Hyde JS, Strangeway RA, Camenisch TG, Ratke JJ, Froncisz W. W-Band Frequency-Swept EPR. J. Magn. Reson. 2010;205:93–101. doi: 10.1016/j.jmr.2010.04.005. [DOI] [PMC free article] [PubMed] [Google Scholar]
- 12.Quine RW, Rinard GA, Eaton SS, Eaton GR. A pulsed and continuous wave 250 MHz electron paramagnetic resonance spectrometer. Magn. Reson. Engineer. 2002;15:59–91. [Google Scholar]
- 13.Joshi JP, Eaton GR, Eaton SS. Impact of Resonator on Direct-Detected Rapid-Scan EPR at 9.8 GHz. Appl. Magn. Reson. 2005;29:239–249. [Google Scholar]
- 14.Turek P, Andre JJ, Giraudeau A, Simon J. Preparation and study of a lithium phthalocyanine radical: optical and magnetic properties. Chem. Phys. Lett. 1987;134:471–476. [Google Scholar]
- 15.Grinberg VO, Smirnov AI, Grinberg OY, Grinberg SA, O'Hara JA, Swartz HM. Practical conditions and limitations for high spatial resolution of multi-site EPR oximetry. Appl. Magn. Reson. 2005;28:69–78. [Google Scholar]
- 16.Rinard GA, Quine RA, Biller JR, Eaton GR. A Wire Crossed-Loop-Resonator for Rapid Scan EPR. Concepts Magn. Reson. B, Magn. Reson. Engineer. 2010;37B:86–91. doi: 10.1002/cmr.b.20161. [DOI] [PMC free article] [PubMed] [Google Scholar]
- 17.Quine RW, Czechowski T, Eaton GR. A Linear Magnetic Field Scan Driver. Conc. Magn. Reson. B (Magn. Reson. Engin.) 2009;35B:44–58. doi: 10.1002/cmr.b.20128. [DOI] [PMC free article] [PubMed] [Google Scholar]
- 18.Weil JA, Bolton JR. Electron Paramagnetic Resonance: Elementary Theory and Practical Applications. New Jersey: John Wiley Hoboken; 2007. [Google Scholar]


