

Abstract
Amyotrophic lateral sclerosis is a relentless and devastating adult-onset neurodegenerative disease with no known cure. In mice with amyotrophic lateral sclerosis, CD4+ T lymphocytes and wild-type microglia potentiate protective inflammatory responses and play a principal role in disease pathoprogression. Using this model, we demonstrate that endogenous T lymphocytes, and more specifically regulatory T lymphocytes, are increased at early slowly progressing stages, augmenting interleukin-4 expression and protective M2 microglia, and are decreased when the disease rapidly accelerates, possibly through the loss of FoxP3 expression in the regulatory T lymphocytes. Without ex vivo activation, the passive transfer of wild-type CD4+ T lymphocytes into amyotrophic lateral sclerosis mice lacking functional T lymphocytes lengthened disease duration and prolonged survival. The passive transfer of endogenous regulatory T lymphocytes from early disease stage mutant Cu2+/Zn2+ superoxide dismutase mice into these amyotrophic lateral sclerosis mice, again without ex vivo activation, were substantially more immunotherapeutic sustaining interleukin-4 levels and M2 microglia, and resulting in lengthened disease duration and prolonged survival; the stable disease phase was extended by 88% using mutant Cu2+/Zn2+ superoxide dismutase regulatory T lymphocytes. A potential mechanism for this enhanced life expectancy may be mediated by the augmented secretion of interleukin-4 from mutant Cu2+/Zn2+ superoxide dismutase regulatory T lymphocytes that directly suppressed the toxic properties of microglia; flow cytometric analyses determined that CD4+/CD25+/FoxP3+ T lymphocytes co-expressed interleukin-4 in the same cell. These observations were extended into the amyotrophic lateral sclerosis patient population where patients with more rapidly progressing disease had decreased numbers of regulatory T lymphocytes; the numbers of regulatory T lymphocytes were inversely correlated with disease progression rates. These data suggest a cellular mechanism whereby endogenous regulatory T lymphocytes are immunocompetent and actively contribute to neuroprotection through their interactions with microglia. Furthermore, these data suggest that immunotherapeutic interventions must begin early in the pathogenic process since immune dysfunction occurs at later stages. Thus, the cumulative mouse and human amyotrophic lateral sclerosis data suggest that increasing the levels of regulatory T lymphocytes in patients with amyotrophic lateral sclerosis at early stages in the disease process may be of therapeutic value, and slow the rate of disease progression and stabilize patients for longer periods of time.
Keywords: regulatory T lymphocytes, microglia, inflammation, IL-4, FoxP3
Introduction
Neuroinflammation is a prominent pathological feature in amyotrophic lateral sclerosis (ALS), a rapidly progressive disorder that selectively destroys motoneurons resulting in death, and is characterized by infiltrating lymphocytes, possibly related to the increased chemokine (C–C motif) ligand 2 (CCL2) levels, and the morphological activation of microglia (Engelhardt et al., 1993; Alexianu et al., 2001; McGeer and McGeer, 2002; Henkel et al., 2004, 2006, 2009; Turner et al., 2004; Zhang et al., 2005, 2006; Boillée et al., 2006b; Appel et al., 2010). The controversial role of T lymphocytes in ALS was resolved by our demonstration that their presence in mutant Cu2+/Zn2+ superoxide dismutase (mSOD1) ALS mice plays an endogenous neuroprotective function by augmenting the protective potentials of microglia and attenuating their toxic responses (Beers et al., 2008). Another study using mSOD1 mice bred with different T lymphocyte-deficient mice reached the similar conclusion that T lymphocytes mediate a beneficial inflammatory response; in both studies, T lymphocyte deficiency led to the attenuation of microglial protective responses and survival (Beers et al., 2008; Chiu et al., 2008). Banerjee et al. (2008) also concluded that the passive transfer of ex vivo activated CD4+ T lymphocytes into mSOD1 mice improved neurological function and life expectancy. More recently, a T lymphocyte co-stimulatory pathway was demonstrated to be upregulated in the blood of patients with ALS; modulating this co-stimulatory pathway in ALS mice delayed disease onset and reduced toxic microglial inflammatory responses (Lincecum et al., 2010).
The suppressive effects of CD4+CD25+FoxP3+ regulatory T lymphocytes (Tregs) on the adaptive and innate immune systems have been documented (Sakaguchi et al., 2005, 2008; Tiemessen et al., 2007). The passive transfer of ex vivo activated Tregs was shown to suppress toxic microglial responses, upregulate glial-derived neurotrophic factor and transforming growth factor-β, and protected neurons in a model of Parkinson’s disease (Reynolds et al., 2007, 2010). Treg-mediated suppression involves multi-cellular clusters consisting of responder T lymphocytes, antigen-presenting cells and membrane-bound and/or soluble inhibitory molecules. Tregs suppress T lymphocyte proliferation, downregulate pro-inflammatory cytokine production [interferon-γ (IFN-γ) and tumour necrosis factor-α] and directly inhibit interleukin (IL)-2 messenger RNA transcription. Tregs secrete anti-inflammatory cytokines (IL-4, IL-10 and IL-13) and neurotrophic factors, transform a pro-inflammatory Th1 response to an anti-inflammatory Th2 mediated response and attenuate toxic microglial responses; Tregs have been shown to directly differentiate macrophages towards an alternatively activated (M2) state (Avidan et al., 2004; Reynolds et al., 2007; Tiemessen et al., 2007).
There was also controversy as to whether the proliferation and activation of microglia in ALS promoted survival or exacerbated neuronal death (Moisse and Strong, 2006). We and others demonstrated that wild-type microglia or microglia expressing less mSOD1 promoted neuroprotection and extended survival of mSOD1 mice (Beers et al., 2006; Boillée et al., 2006b). In vitro studies utilizing primary microglia/motoneuron co-cultures provided evidence that wild-type microglia were less neurotoxic than mSOD1 microglia due to their enhanced release of neurotrophic factors and attenuated release of free radicals and pro-inflammatory cytokines (Weydt et al., 2004; Beers et al., 2006; Xiao et al., 2007). In microglia/motoneuron co-cultures, IL-4 promoted motoneuron survival by suppressing classically activated (M1) microglial activation, inducing an M2 protective phenotype, reducing the release of the reactive oxygen species and enhancing insulin-like growth factor-1 secretion (Zhao et al., 2006). Marden et al. (2007) determined that dysregulated redox stress in ALS mice caused by nicotinamide adenine dinucleotide phosphate oxidase subunits Nox1 and Nox2, expressed in microglia, significantly influenced the progression of motoneuron disease caused by mSOD1 expression; deletion of either Nox gene significantly slowed disease progression and improved survival. Therefore, T lymphocytes and microglia, through their distinctive temporal and spatial contributions, can have both neuroprotective and cytotoxic functions depending on their different phenotypic activation states and the physiological conditions they encounter (Schwartz and Shechter, 2010).
To pursue the role of T lymphocytes in the ALS pathogenic process, and to determine the cellular mechanisms whereby distinct subpopulations of T lymphocytes and their interactions with microglia enhance life expectancy in ALS, we demonstrate that increased numbers of endogenous Tregs and M2 microglia were associated with the stable phase of disease progression, whereas Th1 lymphocytes and M1 microglia predominate during the rapidly progressing phase, suggesting a shift from protection to toxicity. Without ex vivo activation, the passive transfer of mSOD1 Tregs into ALS mice lacking functional T lymphocytes extended the stable phase of disease progression and prolonged survival. More importantly, decreased numbers of Tregs in the blood of ALS patients with ALS correlated with faster progressing disease.
Materials and methods
Mice
mSOD1G93A and recombination activating gene-2 (RAG2) knockout mice, both on a C57Bl/6 genetic background, were bred and maintained in the Methodist Research Institute’s animal facility. All animals were housed in microisolator cages with access to food and water ad libitum, and all animals were specific pathogen free; sentinel mice were tested quarterly. All experimental procedures involving animals were approved by the Methodist Research Institute’s Institutional Animal Care and Use Committee in compliance with National Institutes of Health guidelines. Disease symptoms and course were assessed using the Beers, Appel, Simpson, and Henkel (BASH) scoring system (Beers et al., 2006, 2008). Specific cytokines/chemokines/neurotrophic factor messenger RNA levels were assessed at disease onset (11 weeks), the stable disease phase (14 and 16 weeks), the point at which disease progression rapidly accelerates (18 weeks), the rapidly progressing phase (20 weeks), and end stage disease; age-matched wild-type mice served as controls.
Polymerase chain reaction screening for mSOD1 and RAG2 mutations
Transgenic mSOD1G93A animals were identified and copy number verified by quantitative polymerase chain reaction as previously described (Beers et al., 2008). The presence or absence of the RAG2 gene was determined by polymerase chain reaction as previously described (Beers et al., 2008). The polymerase chain reaction products were resolved by 1.0% agarose/ethidium bromide gel electrophoresis and photographed under UV illumination. The mSOD1 transgenic mice were on the C57Bl/6 background, all from Jackson Laboratories.
Flow cytometry
Blood, cell suspensions from spleen and lymph nodes were isolated from lethally anaesthetized mSOD1 and age-matched wild-type mice at 11, 14, 16, 18 and 20 weeks of age, and at end stage disease, and sent for flow cytometric analyses (The Methodist Hospital Research Institute’s Core Flow Cytometry Laboratory). The panel of antibodies (BD Biosciences) used to evaluate the leucocytes from mice included CD3, CD4, CD8, CD25, FoxP3 and IL-4. Human blood samples were obtained in compliance with an approved Methodist Research Institute Institutional Review Board. Human blood samples were evaluated using CD3, CD4, CD8, CD25 and FoxP3 antibodies (BD Biosciences). Data collection was performed on a LSRII flow cytometer (BD Biosciences) and analysed with FACSDiva (BD Biosciences) and FlowJo (Tree Star) software.
T lymphocyte isolation and passive transfers
T lymphocytes were isolated from the blood, spleen and lymph nodes (axillary, inguinal and superficial cervical) using a cell strainer, pre-filter and CD4+ T lymphocytes and CD4+/CD25+ Tregs were separated using the Miltenyi MACS magnetic columns [CD4+T lymphocytes (130-095-248), CD4+CD25+ and CD4+CD25− T lymphocytes (130-091-041)] according to the manufacturer’s instructions. Purity was confirmed by flow cytometry. Isolated T lymphocyte subpopulations were passively transferred into 70-day-old mSOD1/RAG2−/− mice via tail vein injections and repeated every 28 days. Total leucocytes (2 × 10⁸) were isolated from the spleens and lymph nodes of 14-week-old mSOD1 mice. From the total leucocytes, 2 × 10⁷ were CD4+ T lymphocytes, and of these cells, 2–3 × 10⁶ were CD4+/C25+ Tregs. Thus, approximately 1–1.5% of the total leucocytes population was Tregs or 10–15% from the CD4+ T lymphocyte population; there were consistently 2–3 times more mSOD1 Tregs isolated from mSOD1 mice than similarly isolated wild-type Tregs from age- and genetic background-matched wild-type mice. Analysis of the isolated CD4+/C25+ Tregs by flow cytometry determined that this population of cells was 90–95% CD4+/C25+ T lymphocytes; thus, this population contained few CD4+/CD25− effector T lymphocytes (Teffs). Furthermore, flow cytometry revealed that >80% of the mSOD1 CD4+/C25+ T lymphocytes were FoxP3+. Ten-week-old mSOD1/RAG2−/− mice were passively transferred with 2 × 10⁷ wild-type or mSOD1 CD4+ T lymphocytes, or with 2–3 × 10⁶ mSOD1 Tregs, from 14-week-old mSOD1 or age-matched wild-type mice.
Quantitative reverse transcriptase polymerase chain reaction
RNA was isolated from homogenized frozen spinal cord tissue or cell cultures using TRIzol® (Gibco) and purified with RNeasy® (Qiagen) according to the manufacturer’s recommendations. The concentrations were determined spectrophotometrically (Beckman DU-64). Quantitative reverse transcriptase polymerase chain reaction was performed on 10 ng of messenger RNA (or 2 ng of culture messenger RNA) as previously described (Henkel et al., 2006; Beers et al., 2008). Primer efficiency was assessed by analysing a dilution series of messenger RNA. The relative expression level of each messenger RNA was calculated using the ΔΔCt method normalizing to β-actin and relative to the control samples. The presence of one product of the correct size was verified by gel electrophoresis and melting curve analyses.
Cell culture
Primary adult microglia were prepared from spinal cord tissues of 18-week-old mSOD1G93A mice as well as wild-type mice by modification of a non-enzymatic procedure (Aloisi et al., 2000; Frank et al., 2006). Briefly, mice were lethally anaesthetized and perfused intracardially with 40–50 ml of ice-cold glucose–potassium–sodium (GKN) buffer [8 g/l NaCl, 0.4 g/l KCl, 3.56 g/l Na2HPO4 12H2O, 0.78 g/l NaH2PO4 2H2O and 2 g/l D(+)-glucose, pH 7.4]. Spinal cord tissues were mechanically dissociated by passing through a 70 µm cell strainer using a 10 ml syringe plunger, and then strained through a 40-µm filter. After centrifugation at 350 g for 10 min at 4°C, dissociated tissue was resuspended in 2 ml of 70% isotonic Percoll and overlaid with 3 ml of 35% Percoll and 2 ml of phosphate-buffered saline following a 30-min centrifugation at 800 g, 20°C. Microglia were obtained from the 35%:70% interface, washed and resuspended in Roswell Park Memorial Institute (RPMI) medium supplemented with 10% foetal bovine serum, 25 mM 4-(2-hydroxyethyl)-1-piperazineethanesulfonic acid, 1 mM sodium pyruvate, ×1 non-essential amino acids, 55 µM 2-mercaptoethanol, 100 U/ml penicillin and 100 µg/ml streptomycin.
Tregs and Teffs were obtained from lymph nodes (superficial cervical, axillary, inguinal lymph nodes) and spleen of 14-week-old mSOD1G93A mice as well as wild-type littermates. Tregs and Teffs were isolated using mouse regulatory T-cell isolation kits (Miltenyi Biotec) following the manufacturer’s instructions. The purity of the resulting T-cell populations was confirmed to be >95% by flow cytometry.
Primary adult microglia (1 × 10⁴) were co-cultured with Tregs or Teffs (1 × 10⁴) in 96-well U-bottom plates in complete Roswell Park Memorial Institute (RPMI) medium with 0.5 µg/ml anti-CD3 antibody (eBioscience) and 100 U/ml IL-2 (BD Biosciences). In the inhibitory experiments, blocking antibodies of IL-4 (150 ng/ml, R&D Systems) or IL-10 (10 µg/ml, eBioscience) were added to the co-cultures after plating. Two days later, cells were lysed to extract RNA with RNeasy® Micro kit (Qiagen) to detect NOX2 and IL-10. Supernatant was collected for detecting IL-4 protein using an enzyme-linked immunosorbent assay kit from eBioscience.
To assay whether mSOD1 Tregs can functionally suppress mSOD1 microglia, microglia were isolated from the spinal cords of 18-week-old untreated mSOD1 mice that were entering the rapidly progressing disease phase; microglia at this time point had reduced expression of Ym1 and increased expression of NOX2 messenger RNA. The mSOD1 Tregs were isolated from 100-day-old mSOD1 mice because these animals are on the stable disease phase and have increased numbers of functional Tregs. Thus, the assay determined whether Tregs isolated from stable phase mSOD1 mice are able to suppress the neurotoxic microglia.
Immunohistochemistry
The mice were lethally anaesthetized and perfused with phosphate-buffered saline (pH 7.4) followed by 3% neutral paraformaldehyde. Sections (30 µm) were cut from the spinal cord and washed three times in phosphate-buffered saline. The sections were blocked for endogenous peroxidase activity (0.3% H2O2 in distilled water, 30 min). The sections were pretreated with normal serum for 1 h at room temperature to block the non-specific IgG binding sites. The primary antibodies were diluted in phosphate-buffered saline containing normal serum and incubated overnight at 4°C. As a negative control, the primary antibodies were omitted during the reaction. After rinsing in phosphate-buffered saline, the sections were incubated with a biotinylated secondary IgG for 2 h at room temperature. The immunostained sections were examined using a Zeiss Imager-Z1m microscope equipped with a Zeiss AxioCam MRc5 colour camera, a Zeiss AxioCam MRm black and white camera and a Zeiss digital image analysis system (Karl Zeiss).
Patients
After receiving written informed consent, peripheral whole blood was drawn from 54 patients diagnosed with definite or probable sporadic ALS according to revised El Escorial criteria of the World Federation of Neurology (Brooks, 1994). The cohort consisted of 31 males and 23 females, ranging in age from 35 to 74 years (mean age of 59 ± 10 SD), with 28% of the patients having bulbar region disease onset, whereas the remaining 72% had limb onset. The patients were evaluated at the MDA/ALS Clinic at the Methodist Neurological Institute from 2000 to 2010 using the Appel ALS functional status score (Haverkamp et al., 1995). Based on the Appel ALS score, the ALS patients were separated into slowly (a disease progression rate of <1.5 Appel ALS points/month) versus rapidly (a disease progression rate of ≥1.5 Appel ALS points/month) progressing patients. Additional peripheral blood samples were donated by 33 healthy control volunteers (13 males and 20 females; ages ranged from 31 to 73 years with a mean age of 54 ± 11 SD) after giving written informed consent. The control volunteers did not have histories of infectious diseases or other disorders.
Statistical analyses
Data were analysed by two-tailed Student’s t-test on Excel software. Data are expressed as mean ± SE; P < 0.05 was considered statistically significant. Differences in onset and survival times were computed using Kaplan–Meier survival statistics (log rank sum test, Number Cruncher Statistical Systems). Disease progression and the in vitro studies were analysed by a one-way ANOVA with repeated measures (SigmaStat). Differences between groups were analysed using a two-way ANOVA (SigmaStat).
Results
Regulatory T lymphocytes are increased in mSOD1mice
Since CD4+ T lymphocytes provide neuroprotection by modulating the trophic/cytotoxic balance of glia (Beers et al., 2008; Chiu et al., 2008), and since they play a prominent role in slowing the rate of progression in ALS mice, specific T lymphocyte populations in blood, spleens and lymph nodes from the C57Bl/6 strain of mSOD1G93A ALS mice were temporally analysed by flow cytometry and compared with their wild-type littermates. Analyses were performed at disease onset (11 weeks), the stable disease phase (14 and 16 weeks), the point at which disease progression begins to rapidly accelerate (18 weeks), the rapidly progressing phase (20 weeks) and end stage disease (∼23 weeks; Fig. 1A and Supplementary Fig. 1A). Total leucocytes counts were initially elevated in blood, spleen and lymph nodes of mSOD1 mice but decreased as disease progressed (Supplementary Fig. 1B–D). CD3+ and CD4+ T lymphocytes were increased in the blood of mSOD1 mice at 16 weeks through end stage disease compared with their wild-type littermates (Supplementary Fig. 1E and F). CD8+ T lymphocytes were only increased in the blood of end stage mSOD1 mice (Supplementary Fig. 1G). In spleens, CD3+, CD4+ and CD8+ T lymphocytes increased in mSOD1 mice at end stage disease (Supplementary Fig. 1H–J). In lymph nodes, CD3+ and CD4+ T lymphocytes were also increased at 18 weeks in mSOD1, but CD8+ T lymphocytes were only increased at 18 weeks (Supplementary Fig. 1K–M).
Figure 1.

Flow cytometric analyses showed the temporal changes of T lymphocyte sub-populations in blood and lymph nodes of mSOD1 mice. (A) Graph of the disease progression curve and time points (arrows) when flow cytometry and quantitative reverse transcriptase polymerase chain reaction assays were performed on wild-type and mSOD1 mice. Each time point represents the mean of n = 3 mSOD1 and n = 3 wild-type (WT) littermate mice. (B) CD4+CD25+ cells were increased in the blood of mSOD1 mice at each time point examined except at end stage disease. (C) Including end stage disease, CD25+FoxP3+ cells were increased in the blood of mSOD1 mice at each time point examined. (D) The FoxP3 fluorescence/cell intensity in the blood suggests that the Tregs have a suppressive function at 11 through 16 weeks, but these suppressive capabilities are possibly lost at 18 weeks through end stage disease. (E) In lymph nodes, CD4+CD25+ cells were increased between 16 and 20 weeks, but returned to wild-type levels at end stage disease. (F) CD25+FoxP3+ cells followed a similar pattern as CD4+CD25+ cells in lymph nodes compared with wild-type mice. (G) As occurred in the blood, the FoxP3 fluorescence/cell intensity in the lymph nodes suggests that the Tregs have a suppressive function between 11 and 16 weeks, but possibly lose this capability at 18 weeks through to end stage disease. ES= end stage; *P≤0.05, mSOD1 compared with wild-type mice; **P ≤ 0.01, mSOD1 compared with wild-type mice; and # P ≤ 0.05, 16 week compared with 18 week mSOD1 mice.
CD4+CD25+ and CD25+FoxP3+ Tregs were increased in the blood of mSOD1 mice at every time point analysed, peaking at 16 weeks (Fig. 1B and C). FoxP3 fluorescent intensity, an assessment of the level of FoxP3 expression in lymphocytes, was increased in blood CD25+FoxP3+ Tregs at 11, 14 and 16 weeks, but was at wild-type levels at 18 weeks and thereafter (Fig. 1D); expression of FoxP3 at low levels induces a limited Tregs phenotype without suppressive functions, which is only gained once FoxP3 is highly expressed (Sakaguchi et al., 2010). In spleens of mSOD1 mice, CD4+CD25+ Tregs were increased at 11 weeks, and then decreased at 16 weeks, but gradually recovered thereafter (Supplementary Fig. 1N). FoxP3 fluorescent intensity was not different in cells isolated from spleens (data not shown). In lymph nodes, CD4+CD25+ and CD25+FoxP3+ Tregs were increased between 16 and 20 weeks; CD25+FoxP3+ Tregs were only increased in the spleens of mSOD1 mice at end stage disease (Fig. 1E and F; Supplementary Fig. 1O). As in blood, the fluorescent intensity of CD25+ Tregs was increased in ALS mice lymph nodes at 11, 14 and 16 weeks, but was at wild-type levels at 18 weeks (Fig. 1G); in both blood and lymph nodes, FoxP3 intensity levels began to diminish at 16 weeks. Thus, although the total leucocytes counts were waning, or possibly inhibited, as disease progression accelerated, specific subpopulations of lymphocytes changed, suggesting that a single time point does not adequately reflect an animal’s immune status.
Markers for subsets of T lymphocyte and their prototypic cytokines are temporally and differentially expressed in spinal cords of mSOD1 mice during disease progression
Because FoxP3+ cells were detected in the periphery of mSOD1 mice during the stable disease phase (Fig. 1A), and to determine if these cells are possibly infiltrating the CNS, spinal cord messenger RNA from mSOD1 mice was assayed by quantitative reverse transcriptase polymerase chain reaction for the presence of FoxP3. FoxP3 messenger RNA was increased in mSOD1 mice at 11 through to 16 weeks, prior to and during the stable disease phase, compared with their wild-type littermates (Fig. 2A). However, as disease progression began to accelerate and disease burden increased, FoxP3 messenger RNA decreased. Therefore, the temporal expression of FoxP3 messenger RNA levels in the lumbar spinal cords of mSOD1 mice reflected the numbers of Tregs, and their fluorescent intensities, in the blood and lymph nodes over the same time points.
Figure 2.

Quantitative reverse transcriptase polymerase chain reaction analyses revealed the temporal and differential expression of markers for subsets of T lymphocytes and their prototypic cytokines during disease progression. (A) FoxP3 messenger RNA, currently the most reliable marker of Tregs, was increased in the spinal cords of mSOD1 mice at 11, 14 and 16 weeks of age, but was at wild-type levels at 18 weeks through to end stage (ES) disease. (B) The messenger RNA for IL-4, the prototypic Th2 released cytokine that is also released by Tregs, was first increased during the stable disease phase, then abruptly dropped at the beginning of the rapidly progressing phase, but was still elevated until end stage disease. (C) IL-10 messenger RNA, another Tregs and Th2 released cytokine, was increased during the stable phase of disease; IL-10 abruptly decreased at the beginning of the rapidly progressing disease phase and continued to decline until end stage disease. (D) The message for Gata-3, a master transcription factor expressed in Th2 lymphocytes, was suppressed at 18 weeks through to end stage disease. (E) In contrast to Gata-3, T-bet messenger RNA, a master transcription factor expressed in Th1 lymphocytes, was increased at 14 through to 18 weeks, and then increased further at 20 weeks and end stage disease. (F) The messenger RNA for IFN-γ, the prototypic pro-inflammatory cytokine released by Th1 cells, was increased at 18 and 20 weeks, and at end stage disease. n = 3 mSOD1 and n = 3 wild-type littermate mice at each time point. *P ≤ 0.05, mSOD1 compared with wild-type mice; **P ≤ 0.01, mSOD1 compared with wild-type mice; #P ≤ 0.05, 11 week compared with 14 week mSOD1 mice; ##P ≤ 0.01, 11 week compared with 14 week mSOD1 mice; &P ≤ 0.01, 14 week compared with 16 week mSOD1 mice; $P ≤ 0.05, 16 week compared with 18 week mSOD1 mice; $$P ≤ 0.01, 16 week compared with 18 week mSOD1 mice; +P ≤ 0.05, 18 week compared with 20 week mSOD1 mice; and ++P ≤ 0.01, 18 week compared with 20-week mSOD1 mice.
Since the message for FoxP3 was elevated during the stable phase of disease progression, messenger RNAs for specific anti-inflammatory cytokines were assayed for whether they were increased during the stable phase of disease progression. Both IL-4 and IL-10 messenger RNAs were increased in the spinal cords of mSOD1 mice during the stable disease phase (Fig. 2B and C). Although the messenger RNA for IL-4 remained elevated until end stage disease, IL-10 returned to wild-type levels at 20 weeks and was suppressed below wild-type levels at end stage disease. In addition, to determine whether messenger RNAs for these prototypic cytokines were increased due to the infiltration of Th2 lymphocytes, the lumbar spinal cords of these animals were assessed for levels of Gata-3 messenger RNA, a master transcription factor preferentially expressed by Th2 lymphocytes (Zhu and Paul, 2010); Gata-3 has also been found to be expressed in neurons, astrocytes and microglia (Wallach et al., 2009). Gata-3 was not increased in the lumbar region of mSOD1 mice spinal cords compared with the lumbar region of wild-type mice; Gata-3 expression was not elevated at any time point examined (Fig. 2D). However, Gata-3 messenger RNA levels were suppressed in the lumbar regions of mSOD1 mice beginning at 18 weeks, and extended through end stage disease, compared with the respective region in wild-type mice; of all of the quantitative reverse transcriptase polymerase chain reaction studies performed, only the Gata-3 result showed a suppression at 18 weeks through end stage disease in ALS mice compared with wild-type mice with the single exception of IL-10, which was below wild-type levels at end stage disease.
One complement to the Gata-3/Th2 component of the immune system is T-bet/Th1. T-bet, also known as T-box 21 (Tbx21), is a master transcription factor preferentially expressed in Th1 lymphocytes (Zhu and Paul, 2010). To determine if Th1 lymphocytes are infiltrating the lumbar spinal cords of ALS mice, their lumbar cords were assessed for levels of T-bet messenger RNA. The message for T-bet was increased in the lumbar spinal cords of mSOD1 mice at 14 and 16 weeks compared with the lumbar regions of wild-type mice, and increased further at 18 weeks through end stage disease (Fig. 2E). The messenger RNA for IFN-γ, the prototypic pro-inflammatory cytokine released by T-bet/Th1 lymphocytes, was increased in mSOD1 mice at 18 and 20 weeks, and at end stage disease (Fig. 2F). IL-12 messenger RNA, produced primarily by activated inflammatory cells including microglia and dendritic cells, which acts to differentiate naïve CD4+ T lymphocytes into IFN-γ secreting Th1 cells, was increased beginning at 16 weeks and remained elevated throughout the disease course (Supplementary Fig. 2A). The message for IL-17, the pro-inflammatory cytokine produced by Th17 cells, was not detected in spinal cords of mSOD1 or wild-type mice at any time point (data not shown).
Glia messenger RNAs are temporally and differentially expressed in the lumbar spinal cords of mSOD1 mice during disease progression
Since we previously demonstrated that morphological markers of glial ‘activation’ do not accurately predict the functional markers of ‘activation’, we assessed the levels of Ym1 messenger RNA as a marker for M2 protective microglia in the lumbar spinal cords of mSOD1 mice compared with age-matched wild-type mice (Beers et al., 2008). Ym1 was increased at 11 weeks in mSOD1 mice, peaked between 14 and 16 weeks, then decreased at 18 weeks through end stage disease, but remained elevated compared with wild-type mice (Fig. 3A). CD206, also known as the mannose receptor, c type 1 or MRC1, was assayed as another marker for M2 microglia (Colton et al., 2006; Tiemessen et al., 2007; Gordon and Martinez, 2010). The message levels of CD206 reliably mirrored that of Ym1 messenger RNA, but to a slightly lower ‘fold increase’ over the course of disease in mSOD1 mice; CD206 peaked at 14 weeks with a 4-fold increase, whereas Ym1, also peaking at 14 weeks, had a 25-fold increase in the messenger RNA expression level at this time point (Fig. 3B). Another marker of protective microglia, fractalkine receptor (CX3CR1) messenger RNA, expressed on microglia, dendritic cells and T lymphocyte subsets, and which has been shown to protect motoneurons by suppressing microglial toxicity, mirrored levels of Ym1 and CD206 (Fig. 3C) (Cardona et al., 2006).
Figure 3.

Quantitative reverse transcriptase polymerase chain reaction analyses showed a differential expression of glial messenger RNAs during disease progression in the spinal cords of mSOD1 mice. (A) Ym1 messenger RNA, a reliable marker of M2 macrophages/microglia, was increased in spinal cords of mSOD1 mice at 11 through to 16 weeks of age, and remained elevated through to end stage (ES) disease compared with wild-type mice. (B) CD206, another marker of M2 microglia, mirrored that of Ym1. (C) CX3CR1 (fractalkine receptor) messenger RNA, expressed in microglia, dendritic cells and T lymphocyte subsets, and has been shown to protect motoneurons by suppressing microglial toxicity, was increased in spinal cords of mSOD1 mice at 11 through to 16 weeks of age, and remained elevated through to end stage disease compared with wild-type mice. (D) NOX2 messenger RNA, the prototypic subunit of nicotinamide adenine dinucleotide phosphate oxidase found in macrophages/microglia producing O2−, was increased at 14 and 16 weeks of age, and was dramatically increased at 18 weeks (18-fold), the beginning of the rapidly progressing disease phase (Beers et al., 2008). Notice the scale of the ordinate in this graph. (E) IL-1β messenger RNA expression pattern, released by microglia, was increased at 14 and 16 weeks of age in spinal cords of mSOD1 mice compared with wild-type mice, and was increased further at 18 weeks, the beginning of the rapidly progressing disease phase (Beers et al., 2008), through to end stage disease. (F) The messenger RNA level for IL-6, another Th1-induced cytokine that completely inhibits the generation of FoxP3+ Tregs and possibly key factor that transforms Tregs/Th2 and M2 responses into Th1/M1 responses, was increased at 16 through to 20 weeks of age. n = 3 mSOD1 and n = 3 wild-type littermate mice at each time point. *P ≤ 0.05, mSOD1 compared with wild-type mice; **P ≤ 0.01, mSOD1 compared with wild-type mice; #P ≤ 0.05, 11-week mSOD1 mice compared with 14-week mSOD1 mice; ##P ≤ 0.01, 11-week mSOD1 mice compared with 14-week mSOD1 mice; &P ≤ 0.05, 14-week mSOD1 mice compared with 16-week mSOD1 mice; $P ≤ 0.01, 16-week mSOD1 mice compared with 18-week mSOD1 mice; $$P ≤ 0.01, 16-week mSOD1 mice compared with 18-week mSOD1 mice; +P ≤ 0.05, 18-week mSOD1 mice compared with 20-week mSOD1 mice; ‡P ≤ 0.05, 20-week mSOD1 mice compared with end stage mSOD1 mice; and ‡‡P ≤ 0.01, 20-week mSOD1 mice compared with end stage mSOD1 mice.
Because CD4+ T lymphocytes protect facial motoneurons, possibly through brain-derived neurotrophic factor, we temporally assessed the levels of brain-derived neurotrophic factor messenger RNA in the spinal cords of mSOD1 mice (Serpe et al., 2005). Brain-derived neurotrophic factor was increased in the spinal cords of mSOD1 mice at 14 and 16 weeks, but returned to wild-type levels at 18 weeks (Supplementary Fig. 3A). In contrast, the messenger RNA for glial-derived neurotrophic factor, another neurotrophic factor, was increased at 11 weeks, peaked at 16 weeks, declined slightly until end stage disease, but remained above wild-type levels (Supplementary Fig. 3B). The neuroprotective cytokine transforming growth factor-β was increased in mSOD1 mice beginning at 14 weeks and increased throughout the disease course (Supplementary Fig. 3C).
We also determined if specific toxic M1 microglial factors were elevated when disease progression accelerated (Fig. 1A). NOX2, the subunit of nicotinamide adenine dinucleotide phosphate (NADPH) oxidase found in macrophages producing superoxide anions (O2−), increased rapidly in mSOD1 mice beginning at 14 weeks and was markedly elevated at end stage disease (Fig. 3D). Similarly, the messenger RNA for IL-1β, released by toxic M1 macrophages and microglia, was increased at 14 weeks and continued to increase until end stage disease (Fig. 3E). Tumour necrosis factor-α messenger RNA, also released by M1 microglia, was modestly increased between 16 and 20 weeks, and then spiked at end stage disease (Supplementary Fig. 3D). The message for IL-6, although thought of as a Th1 produced cytokine, but is predominantly produced by activated astrocytes in the CNS, was elevated between 16 and 20 weeks, possibly decreasing the number of Tregs over this same time period (Fig. 3F) (Van Wagoner and Benveniste, 1999).
T lymphocyte co-stimulatory, toll-like receptor 2, dendritic and phagocytic macrophage phenotypic marker messenger RNAs are also increased in the lumbar spinal cords of mSOD1 mice during the rapidly progressing disease phase
Full T lymphocyte activation requires interaction between CD28 on the surface of T lymphocytes with CD80 or CD86 on antigen-presenting cells. CD28 messenger RNA was increased at 11 and 14 weeks in mSOD1 mice, returned to wild-type levels at 16 weeks and then increased again at 18 weeks through to end stage disease (Supplementary Fig. 4A). CD80 expression levels peaked at 14 weeks in mSOD1 mice, dropped slightly at 16 weeks, was at wild-type levels at 18 weeks, and then increased again at 20 weeks and end stage disease (Supplementary Fig. 4B). In contrast, CD86 increased after 18 weeks (Supplementary Fig. 4C). CTLA-4 messenger RNA, a co-stimulatory molecule on the surface of Tregs that also binds CD80 or CD86, was not detected in the spinal cords of either mSOD1 or wild-type mice (data not shown).
The messenger RNA for CD11c, a dendritic cell marker, was increased at 14 weeks and continued to increase at every other time point assayed (Supplementary Fig. 4D). A possible pathway to activate dendritic cells is through toll-like receptors. Compared with their wild-type littermates, toll-like receptor-2 messenger RNA levels mirrored the CD11c messenger RNA pattern (Supplementary Fig. 4E). In addition, toll-like receptor-4 messenger RNA levels were increased in mSOD1 mice (Supplementary Fig. 4F). This suggests the presence of an infectious agent or ‘rogue protein’; possibly the release of misfolded mSOD1 from motoneurons and astrocytes (Urushitani et al., 2006; Appel et al., 2010; Zhao et al., 2010). CD68 messenger RNA levels, a lysosomal-associated membrane protein found on phagocytic cells, were increased in the spinal cords of mSOD1 mice at all time points (Supplementary Fig. 4G). A possible chemokine responsible for the recruitment of leucocytes to areas of CNS injury is chemokine (C-C motif) ligand 2 (CCL2) and its temporal messenger RNA expression pattern was similar to the CD68 messenger RNA pattern (Supplementary Fig. 4H).
mSOD1 regulatory T lypmphocytes augment neuroprotection and extend the stable disease phase
To determine if endogenous mSOD1 CD4+ T lymphocytes with enhanced numbers of Tregs and without ex vivo activation are capable of providing neuroprotection, mSOD1/RAG2−/− mice were passively transferred with CD4+ T lymphocytes from stable disease phase mSOD1 mice or age-matched wild-type mice and compared with their mSOD1/RAG2+/− littermates; all mice were specific pathogen free and did not display clinical signs of other illnesses such as graft versus host disease (Fig. 1A) (Banerjee et al., 2008; Beers et al., 2008; Chiu et al., 2008). Disease progression was unchanged between mSOD1/RAG2−/− mice passively transferred with wild-type CD4+ T lymphocytes and mSOD1/RAG2+/− littermates (Fig. 4A; Supplementary Fig. 5A) (Beers et al., 2008). mSOD1/RAG2−/− mice receiving wild-type CD4+ T lymphocytes had disease onset (data not shown), duration (time from onset until death) and survival times similar to those of mSOD1/RAG2+/− mice; previous studies documented that mSOD1/RAG2+/− mice survive similarly to mSOD1 mice (Fig. 4B and C; Supplementary Fig. 5B and C) (Beers et al., 2008).
Figure 4.

Tregs provide a cellular mechanism that extends the stable disease phase and prolongs survival in mSOD1/RAG2−/− mice. Total mSOD1 CD4+ T lymphocytes and CD4+CD25+ Tregs were harvested from mSOD1 mice during the stable disease phase (100–115 days of age), and total wild-type CD4+ T lymphocytes were isolated from 100- to 115-day-old wild-type (WT) mice. Neither the total mSOD1 CD4+ T lymphocytes nor the total wild-type CD4+ T lymphocytes were expanded ex vivo. (A) The stable disease phase in ALS mice, represented by the plateau in the disease progression curve, was extended 2 weeks following the passive transfer of total mSOD1 CD4+ T lymphocytes (purple curve) into mSOD1/RAG2−/− mice (n = 10) compared with mSOD1/RAG2−/− mice receiving age-matched total wild-type CD4+ T lymphocytes (dark blue curve; n = 6; P < 0.001). The stable disease phase did not differ between mSOD1/RAG2−/− mice passively transferred with total wild-type CD4+ T lymphocytes. The passive transfer of mSOD1 Tregs further extended the stable disease phase by 1.5 weeks in mSOD1/RAG2−/− mice (green curve; n = 6) compared with mSOD1/RAG2−/− mice passively transferred with total mSOD1 CD4+ T lymphocytes (purple curve; P = 0.028). The passive transfer of mSOD1 Tregs extended the stable disease phase by 100% compared with the passive transfer of wild-type CD4+ T lymphocytes. mSOD1 Tregs extended the stable disease phase by 8 weeks compared with untreated mSOD1/RAG2−/− mice (red curve; n = 14). (B) The passive transfer of total mSOD1 CD4+ T lymphocytes (purple curve) or mSOD1 Tregs (green curve) into mSOD1/RAG2−/− mice prolonged survival compared with mSOD1/RAG2−/− mice passively transferred with total wild-type CD4+ T lymphocytes (dark blue curve; P < 0.001 and P = 0.001, respectively). Passive transfer of total mSOD1 CD4+ T lymphocytes or mSOD1 Tregs into mSOD1/RAG2−/− mice prolonged survival by 38 days (26%) compared with untreated mSOD1/RAG2−/− mice (red curve, P < 0.001 and P < 0.001, respectively). Passive transfer of total mSOD1 CD4+ T lymphocytes into mSOD1/RAG2−/− mice did not prolong survival compared with mSOD1/RAG2−/− mice receiving mSOD1 Tregs. (C) Passive transfer of total mSOD1 CD4+ T lymphocytes (purple bar) or mSOD1 Tregs (green bar) into mSOD1/RAG2−/− mice extended duration compared with mSOD1/RAG2−/− mice passively transferred with total wild-type CD4+ T lymphocytes (dark blue bar; P = 0.003 and P = 0.018, respectively). Passive transfer of total mSOD1 CD4+ T lymphocytes or mSOD1 Tregs into mSOD1/RAG2−/− mice extended duration by 36 days (50%) and 33 days (46%) compared with untreated mSOD1/RAG2−/− mice (red bar; P < 0.001 and P < 0.001, respectively). Because disease onset was not different among all groups, disease duration was not different between mSOD1/RAG2−/− mice passively transferred with total mSOD1 CD4+ T lymphocytes and mSOD1/RAG2−/− mice receiving mSOD1 Tregs. (D) At 20 weeks of age, the passive transfer of mSOD1 CD4+ (purple bar) or CD4+/CD25+ T lymphocytes (green bar) increased the FoxP3 expression levels in the spinal cords of mSOD1/RAG2−/− mice compared with untreated wild-type (yellow bar) or untreated mSOD1 mice (blue bar), or compared with mSOD1/RAG2−/− mice receiving wild-type CD4+ T lymphocytes (dark blue bar). (E) Gata-3 messenger RNA was suppressed in spinal cords of 20-week-old mSOD1/RAG2−/− mice receiving wild-type CD4+ T lymphocytes (dark blue bar) compared with wild-type mice (yellow bar); similar results were obtained with untreated mSOD1 mice (blue bar). (F) T-bet messenger RNA was increased in spinal cords of both 20-week-old mSOD1/RAG2−/− mice receiving wild-type CD4+ T lymphocytes (dark blue bar) and untreated mSOD1 mice (blue bar) compared with wild-type mice (yellow bar). (G) The passive transfer of mSOD1 CD4+ (purple bar) or CD4+/CD25+ T lymphocytes (green bar) increased the messenger RNA levels of IL-4 in the spinal cords of 20-week-old mSOD1/RAG2−/− mice compared with untreated wild-type (yellow bar) or untreated mSOD1 mice (blue bar), or compared with mSOD1/RAG2−/− mice receiving wild-type CD4+ T lymphocytes (dark blue bar). (H) The passive transfer of wild-type CD4+ (purple bar) increased the messenger RNA levels of IFN-γ in the spinal cords of 20-week-old mSOD1/RAG2−/− mice compared with untreated wild-type (yellow bar); similar results were obtained with untreated mSOD1 mice (blue bar). However, the passive transfer of mSOD1 CD4+ (purple bar) or CD4+/CD25+ T lymphocytes (green bar) decreased the messenger RNA levels of IFN-γ in 20-week-old mSOD1/RAG2−/− mice. (I) The spinal cords of 20-week-old mSOD1/RAG2−/− mice passively transferred with mSOD1 CD4+ (purple bar) or CD4+/CD25+ T lymphocytes (green bar) had increased levels of Ym1, a marker of M2 microglia/macrophages, compared with untreated wild-type (yellow bar) or untreated mSOD1 mice (blue bar), or compared with mSOD1/RAG2−/− mice receiving wild-type CD4+ T lymphocytes (dark blue bar). (J) As a marker of toxic microglia/macrophages, NOX2 messenger RNA was decreased in the spinal cords of 20-week-old mSOD1/RAG2−/− mice passively transferred with mSOD1 CD4+ (purple bar) or CD4+/CD25+ T lymphocytes (green bar) compared with untreated wild-type (yellow bar) or untreated mSOD1 mice (blue bar) or compared with mSOD1/RAG2−/− mice receiving wild-type CD4+ T lymphocytes (dark blue bar). KO= knock out.
Passively transferring mSOD1 CD4+ T lymphocytes harvested from mSOD1 donor mice during the stable disease phase with an enhanced number of Tregs extended the stable disease phase of recipient mSOD1/RAG2−/− mice by 2 weeks compared with mice receiving wild-type CD4+ T lymphocytes (Fig. 4A). Stable phase mSOD1 CD4+ T lymphocytes prolonged duration and survival times compared with mSOD1/RAG2−/− mice transferred with wild-type CD4+ T lymphocytes (an 11 and 20% increase, respectively) or mSOD1/RAG2+/− mice (a 14 and 21% increase, respectively); onset times among the three groups were not different (Fig. 4B and C; Supplementary Fig. 5B and C). As a control, the transfer of mSOD1 CD4+ T lymphocytes harvested from rapidly progressing 20-week-old mSOD1 mice, lacking the increased number of Tregs, into recipient mSOD1/RAG2−/− mice did not extend the stable phase; these mice had duration and survival times similar to mSOD1/RAG2−/− mice passively transferred with wild-type CD4+ T lymphocytes (data not shown).
To ensure that the mSOD1 Tregs in the mSOD1 CD4+ T lymphocyte population were responsible for extending the stable phase and prolonging survival, CD4+CD25+ Tregs were isolated from the total population of stable phase mSOD1 CD4+ T lymphocytes and transferred into recipient mSOD1/RAG2−/− mice without ex vivo expansion; there were consistently 2–3 times more mSOD1 Tregs isolated from mSOD1 mice than similarly isolated wild-type Tregs from age- and genetic background-matched wild-type mice. mSOD1 Tregs further extended the stable disease phase by 1.5 weeks compared with total mSOD1 CD4+ T lymphocytes (Fig. 4A). The survival times between mSOD1/RAG2−/− mice receiving stable phase mSOD1 Tregs and mSOD1/RAG2−/− mice receiving total stable phase mSOD1 CD4+ T lymphocytes were equivalent (Fig. 4B and C). mSOD1 CD4+/CD25− Teffs were passively transferred into mSOD1/RAG2−/− mice. However, these mice quickly became sick, without ALS-like signs of disease, and were sacrificed; Tregs are critical for the prevention of autoimmunity and maintenance of self-tolerance.
Since FoxP3, Gata-3 and T-bet messenger RNAs were differentially expressed in mSOD1 mice during the stable phase, and since the passive transfer of mSOD1 CD4+ or CD4+/CD25+ T lymphocytes prolonged survival, their messenger RNA levels were assessed in spinal cords of 20-week-old mSOD1/RAG2−/− mice passively transferred with wild-type CD4+, mSOD1 CD4+ or mSOD1 CD4+/CD25+ T lymphocytes and compared with age-matched wild-type and mSOD1 mice; mice receiving passive transfers of T lymphocytes were sacrificed at 20 weeks of age because this is the time point where untreated mSOD1 mice are well into the rapidly progressing disease phase. The passive transfer of wild-type CD4+ T lymphocytes into mSOD1/RAG2−/− mice did not alter the messenger RNA levels of FoxP3 compared with wild-type or mSOD1 mice (Fig. 4D). FoxP3 messenger RNA levels were increased in mSOD1/RAG2−/− mice receiving mSOD1 CD4+ T lymphocytes compared with either mSOD1 mice or mSOD1/RAG2−/− mice passively transferred with wild-type CD4 T lymphocytes (Fig. 4D). At 20 weeks of age, the passive transfer of mSOD1 CD4+/CD25+ T lymphocytes into mSOD1/RAG2−/− mice further increased FoxP3 messenger RNA levels compared with mSOD1/RAG2−/− mice receiving mSOD1 CD4+ T lymphocytes (Fig. 4D). These results suggest an increase in the number of FoxP3 expressing cells in the spinal cords of these mice.
In contrast to the increased message levels of FoxP3, the passive transfer of wild-type CD4+ T lymphocytes into mSOD1/RAG2−/− mice decreased the messenger RNA levels of Gata-3 compared with wild-type mice at 20 weeks (Fig. 4E); Gata-3 levels in mSOD1/RAG2−/− mice following the passive transfer of wild-type CD4+ T lymphocytes were similar to untreated mSOD1 mice. Although the passive transfer of mSOD1 CD4+ and mSOD1 CD4+/CD25+ T lymphocytes did elevate Gata-3 levels compared with mSOD1 mice, the Gata-3 levels in these mice did not increase above the assessed levels in wild-type mice. These results suggest that any contaminating lymphocytes in the repetitive passive transfers did not contribute to a Th2 response.
As was shown earlier, T-bet messenger RNA was increased in 20-week-old untreated mSOD1 mice compared with wild-type mice, and the passive transfer of wild-type CD4+ T lymphocytes into mSOD1/RAG2−/− mice did not alter these levels (Fig. 4F). However, the passive transfer mSOD1 CD4+ T lymphocytes into mSOD1/RAG2−/− mice did decrease the messenger RNA levels of T-bet compared with wild-type or mSOD1 mice. The passive transfer of mSOD1 CD4+/CD25+ T lymphocytes into mSOD1/RAG2−/− mice further reduced the T-bet message levels compared with mSOD1/RAG2−/− mice receiving passive transfers of mSOD1 CD4+ T lymphocytes most likely due to the limited numbers of T-bet expressing lymphocytes in the mSOD1 CD4+/CD25+ T lymphocyte pool.
Similar expression patterns to FoxP3 were obtained when the spinal cords of these animals were assessed for IL-4 messenger RNA levels. IL-4 messenger RNA levels were increased in the spinal cords of 20-week-old mSOD1/RAG2−/− mice receiving mSOD1 CD4+ T lymphocytes compared with either mSOD1 mice or mSOD1/RAG2−/− mice passively transferred with wild-type CD4+ T lymphocytes (Fig. 4G). The passive transfer of mSOD1 CD4+/CD25+ T lymphocytes into mSOD1/RAG2−/− mice further increased IL-4 messenger RNA levels compared with mSOD1/RAG2−/− mice receiving mSOD1 CD4+ T lymphocytes. However, the opposite was detected for the message levels of INF-γ. The messenger RNA levels for IFN-γ were decreased in mSOD1/RAG2−/− mice receiving mSOD1 CD4+ T lymphocytes compared with either mSOD1 mice or mSOD1/RAG2−/− mice passively transferred with wild-type CD4+ T lymphocytes (Fig. 4H). The passive transfer of mSOD1 CD4+/CD25+ T lymphocytes into mSOD1/RAG2−/− mice further decreased IFN-γ messenger RNA levels compared with mSOD1/RAG2−/− mice receiving mSOD1 CD4+ T lymphocytes. Thus, increased IL-4, and possibly the reduced toxicity due to the suppressive effects of the Tregs, may have contributed to the prolonged survival of mSOD1/RAG2−/− mice passively transferred with mSOD1 CD4+ or mSOD1 CD4+/CD25+ T lymphocytes.
How the passive transfer of wild-type or mSOD1 CD4+ T lymphocytes, or mSOD1 Tregs, into mSOD1/RAG2−/− mice affected the phenotype of microglia was assessed by measuring the messenger RNA levels of Ym1 and NOX2 (Fig. 4I and J). Although passively transferring wild-type CD4+ T lymphocytes did not increase the levels of Ym1 in the spinal cord of mSOD1/RAG2−/− mice at 20 weeks compared with mSOD1 mice, the levels of Ym1 were increased in 20-week mSOD1/RAG2−/− mice receiving mSOD1 CD4+ T lymphocytes compared with mSOD1 mice or mSOD1/RAG2−/− mice passively transferred with wild-type CD4+ T lymphocytes (Fig. 4I). Passively transferring mSOD1 Tregs into mSOD1/RAG2−/− mice further increased the expression of Ym1 compared with mSOD1/RAG2−/− mice receiving mSOD1 CD4+ T lymphocytes.
The increase in the M2 phenotypic marker Ym1 was associated with the reduction in the messenger RNA for the M1 marker NOX2 (Fig. 4J). The passive transfer of wild-type CD4+ T lymphocytes did not alter the levels of NOX2 messenger RNA in the spinal cord of mSOD1/RAG2−/− mice at 20 weeks compared with mSOD1 mice. However, the NOX2 expression levels were decreased in 20-week mSOD1/RAG2−/− mice receiving mSOD1 CD4+ T lymphocytes compared with mSOD1 mice or mSOD1/RAG2−/− mice passively transferred with wild-type CD4+ T lymphocytes (Fig. 4J). In accord with the increased Ym1 messenger RNA levels following the passive transfer mSOD1 Tregs into mSOD1/RAG2−/− mice, the passive transfer mSOD1 Tregs further decreased the expression of NOX2 compared with mSOD1/RAG2−/− mice receiving mSOD1 CD4+ T lymphocytes. Thus, not only are the markers of Tregs sustained following the repetitive passive transfer of mSOD1 T lymphocytes, the phenotypic markers of M2 microglia are sustained following the passive transfer of these lymphocytes.
CD3+/CD4+ T lymphocytes are present in the lumbar spinal cords of mSOD1 mice
Immunohistochemical examination of lumbar spinal cord sections from end stage disease mSOD1/RAG2−/− mice passively transferred with either wild-type or mSOD1 CD4+ T lymphocytes revealed the presence of CD3+/CD4+ T lymphocytes; CD3+ T lymphocytes were not detected in the lumbar spinal cords of untreated mSOD1/RAG2−/− mice (Fig. 5A). The T lymphocytes were mainly clustered in the ventral grey matter, but scattered T lymphocytes were observed throughout each lumbar spinal cord section; sections contained 17.1 ± 1.3 CD4+ T lymphocytes. The numbers of CD4+ T lymphocytes were similar between mSOD1/RAG2−/− mice passively transferred with either wild-type or mSOD1 CD4+ T lymphocytes; however, there were fewer CD3+ T lymphocytes in these two groups compared with mSOD1/RAG2+/− mice, most likely due to the lack of the previously documented presence of CD8+ T lymphocytes (Fig. 5A, compare panel A2 with panels A3 and A4) (Beers et al. 2008).
Figure 5.

CD3+/CD4+ T lymphocytes were observed in lumbar spinal cord sections of ALS mice. (A) CD3+ T lymphocytes were not detected in lumbar spinal cord of untreated mSOD1/RAG2−/− mice (A1) but were detected in lumbar spinal cords of mSOD1/RAG2+/− mice (A2) and mSOD1/RAG2−/− mice passively transferred with total wild-type or mSOD1 CD4+ T lymphocytes (A3 and A4). At 105-days-old, during the stable disease phase, CD4+ cells were detected in the lumbar spinal cords of mSOD1/RAG2−/− mice passively transferred with CD4+CD25+ T lymphocytes (A5). (B) CD11b immunohistochemistry demonstrated that morphological microglial activation was attenuated in untreated end stage disease mSOD1/RAG2−/− mice (B1) (Beers et al., 2008). Microglial morphology was similar among end stage disease mSOD1/RAG2+/− mice (B2) and end stage disease mSOD1/RAG2−/− mice passively transferred with total wild-type or mSOD1 CD4+ T lymphocytes (B3 and B4). Microglia are morphologically activated at 23 weeks of age, rapidly progressing phase, in mSOD1/RAG2−/− mice passively transferred with stable phase mSOD1 Tregs (B5). Microglia in the lumbar spinal cords of end stage disease mSOD1/RAG2−/− mice passively transferred with stable phase mSOD1 Tregs appeared less morphologically activated (B6). Scale bars= (A) 100 µm; (B) 50 µm.
Examination of lumbar spinal cord sections from 105-day-old (stable disease phase) mSOD1/RAG2−/− mice passively transferred with stable phase mSOD1 Tregs revealed the presence of CD3+/CD4+ T lymphocytes (Fig. 5A, panel 5). CD3+ cells were not detected in lumbar spinal cord sections of mSOD1/RAG2−/− mice passively transferred with mSOD1 Tregs at 23 weeks of age, during the rapidly progressing disease phase or at end stage disease; at these time points, CD4+CD25+ cells were detected in blood, but were FoxP3-, by flow cytometric analyses (data not shown). These data suggest that the passively transferred Tregs are possibly eliminated through apoptosis/necrosis or are no longer recruited to the spinal cords of these mice (Banerjee et al., 2008). Thus, since FoxP3 messenger RNA expression levels were increased at 20 weeks of age in the spinal cords mSOD1/RAG2−/− mice passively transferred with mSOD1 Tregs (Fig. 4D), and since CD3+ T lymphocytes were not detected in the spinal cords of 23-week-old mSOD1/RAG2−/− mice passively transferred with mSOD1 Tregs (Fig. 5A, panel 5), the elimination process could have occurred during this 3 week interval.
Using CD11b antibodies, immunohistochemical examination of lumbar spinal cord sections from end stage disease mSOD1/RAG2−/− mice passively transferred with wild-type or mSOD1 CD4+ T lymphocytes revealed similar microglial morphologies (Fig. 5B). Furthermore, passive transfer of wild-type or mSOD1 CD4+ T lymphocytes into mSOD1/RAG2−/− mice had microglial morphologies indistinguishable from those observed in mSOD1/RAG2+/− mice. Microglia in the lumbar spinal cords of 15-week-old (stable disease phase) or 23-week-old (rapidly progressing disease phase) mSOD1/RAG2−/− mice passively transferred with stable phase mSOD1 Tregs were morphologically similar to disease staged matched mSOD1/RAG2−/− mice passively transferred with either wild-type or mSOD1 CD4+ T lymphocytes (Fig. 5B); however, microglia in the lumbar spinal cords of end stage disease mSOD1/RAG2−/− mice passively transferred with stable phase mSOD1 Tregs appeared less morphologically activated than end stage disease mSOD1/RAG2−/− mice passively transferred with either wild-type or mSOD1 CD4+ T lymphocytes, suggesting a morphologically incomplete reversion to a state observed in untreated mSOD1/RAG2−/− mice (Fig. 5B). CD11b staining of lumbar spinal cord sections from end stage disease mSOD1/RAG2−/− mice confirmed an attenuated microglial activated morphology (Beers et al., 2008).
IL-4 is co-expressed with FoxP3 in mouse regulatory T lypmphocytes
Since IL-4 messenger RNA was increased in the lumbar spinal cords of mSOD1 mice during the stable disease phase, and since the passive transfer of mSOD1 CD4+/CD25+ T lymphocytes extended the stable phase and prolonged survival of recipient mSOD1/RAG2−/− mice, we asked whether the selected mSOD1 CD4+/CD25+ T lymphocytes used for the passive transfers, and for the subsequent in vitro studies, co-expressed IL-4. We isolated CD4+/CD25+ T lymphocytes from lymph nodes and spleens from 108-day-old stable phase mSOD1 mice and age-matched wild-type mice in an identical manner as used for the passive transfer studies, and then analysed 50 000 lymphocytes from both mSOD1 and wild-type mice by flow cytometry using antibodies to CD4, CD25, FoxP3 and IL-4; flow cytometric gates were established based on unstained cells. These analyses revealed that >80% of the CD4+/CD25+T lymphocytes were FoxP3+ in both mSOD1 and wild-type T lymphocyte pools. Furthermore, these analyses demonstrated that IL-4 was co-expressed with FoxP3 in both mSOD1 and wild-type CD4+/CD25+ T lymphocytes; 95% of the CD4+/CD25+/FoxP3+ lymphocytes from mSOD1 and wild-type mice were IL-4+ (Fig. 6A and B). In mSOD1 mice, CD4+/CD25+/FoxP3−/IL-4+, which may contain Th2 lymphocytes, represented 6% of the total selected T lymphocytes, whereas in wild-type mice, these T lymphocytes represented 3% of the total selected T lymphocytes. More importantly, re-gating the flow cytometric results showed that there were 57% more FoxP3+/IL-4high T lymphocytes in mSOD1 CD4+/CD25+ T lymphocytes than with wild-type CD4+/CD25+ T lymphocytes; re-gating these results also demonstrated that there were few FoxP3-/IL-4highT lymphocytes in the selected pools of T lymphocytes from mSOD1 and wild-type mice (Fig. 6C and D).
Figure 6.

IL-4 and FoxP3 are co-expressed in CD4+/CD25+ T lymphocytes. (A and B) CD4+/CD25+ T lymphocytes were isolated in an identical manner from the spleens and lymph nodes of mSOD1 and wild-type (WT) mice as used flow the repetitive passive transfer studies. Using antibodies to CD4, CD25, FoxP3 and IL-4, flow cytometric analyses demonstrated on the single cell level the co-expression IL-4 and FoxP3 in CD4+/CD25+ T lymphocytes in mSOD1 and wild-type mice. (C and D) Moving the gates up, there are more IL-4+ high/FoxP3+ T lymphocytes in mSOD1 CD4+/CD25+ T lymphocytes than with wild-type CD4+/CD25+ T lymphocytes. (E and F) To eliminate possible IL-4 expression alterations in the pool of CD+/CD25+ T lymphocytes, we also prepared fresh lymph node cell suspensions from mSOD1 and wild-type mice. The cells were immediately subjected to flow cytometric analyses using antibodies to CD3, CD4, CD25, FoxP3 and IL-4. Again, IL-4 was found to be co-expressed with FoxP3 on a single cell level in CD3+/CD4+/CD25+ T lymphocytes. (G and H) Moving the gates up, there are more IL-4+ high/FoxP3+ T lymphocytes in mSOD1 CD3+/CD4+/CD25+ T lymphocytes than with wild-type CD3+/CD4+/CD25+ T lymphocytes. The numbers in each quadrant in each of the eight flow cytometry panels reflect the percentages of the total number of live cells in that quadrant.
To eliminate possible alterations in IL-4 expression in the pool of CD4+/CD25+ T lymphocytes due to the prolonged isolation times used to select these lymphocytes, we also prepared fresh cell suspensions from lymph nodes dissected from 105-day-old stable phase mSOD1 and wild-type mice, and immediately subjected these cells to flow cytometric analyses using antibodies to CD3, CD4, CD25, FoxP3 and IL-4. These analyses again revealed that IL-4 was co-expressed by CD3+/CD4+/CD25+/FoxP3+ T lymphocytes in the lymph nodes of mSOD1 and wild-type mice (Fig. 6E and F). In these lymph nodes, 3% of the total mSOD1 cells were CD3+/CD4+/CD25+/FoxP3+/IL-4+, whereas 2% of the wild-type lymph node cells were CD3+/CD4+/CD25+/FoxP3+/IL-4+; 80% of the mSOD1 FoxP3+ T lymphocytes were IL-4+ and 53% of the wild-type FoxP3+ T lymphocytes were IL-4+. Again, re-gating these results showed that there were 200% more CD3+/CD4+/CD25+/FoxP3+/IL-4high T lymphocytes in mSOD1 mice lymph nodes than wild-type lymph nodes (Fig. 6G and H). Thus, these results suggest that the extended stable disease phase and the enhanced survival of mSOD1/RAG2−/− mice receiving repetitive passive transfers of mSOD1 CD4+/CD25+ T lymphocytes may be due to the increased numbers of CD4+/CD25+ T lymphocytes from stable phase mSOD1 mice and because these T lymphocytes have an increased number of FoxP3+/IL-4high T lymphocytes; there were consistently 2–3 times more mSOD1 Tregs isolated from mSOD1 mice than similarly isolated wild-type Tregs from age- and genetic background-matched wild-type mice. Furthermore, in mice on a C57Bl/6 genetic background, it appears that Tregs co-express FoxP3 and IL-4 on a single cell level.
Tregs suppress the toxic and enhance the protective attributes of microglia
Since IL-4 was shown to be co-expressed in mSOD1 Tregs and to determine whether IL-4 released by mSOD1 and wild-type mice Tregs is a potential mechanism for how T lymphocytes may modulate the protective versus toxic responses of microglia, freshly isolated adult 100-day-old wild-type or mSOD1 Teffs and Tregs were co-cultured with primary adult 130-day-old microglia obtained from wild-type or mSOD1 mice. The Teffs and Tregs were obtained during the stable disease phase in mSOD1 mice. Culturing wild-type microglia with either wild-type Teffs or wild-type Tregs did not alter the NOX2 messenger RNA levels assayed by quantitative reverse transcriptase polymerase chain reaction; the NOX2 levels expressed in wild-type microglia were at baseline. When cultured alone, mSOD1 microglia expressed 693% more NOX2 messenger RNA than primary wild-type microglia (data not shown). When co-cultured with Teffs, mSOD1 microglia expressed more NOX2 messenger RNA than wild-type microglia co-cultured with wild-type Teffs (Fig. 7A). When co-cultured with Tregs, NOX2 expression in mSOD1 microglia was decreased to levels detected in wild-type microglia co-cultured with wild-type Tregs; T lymphocytes expressed undetectable levels of NOX2 (data not shown).
Figure 7.

Tregs suppress toxic microglial responses through a mechanism involving the upregulation of IL-4. Wild-type (WT) and mSOD1 primary microglia (mc) were harvested from 130-day-old mice. Wild-type and mSOD1 T lymphocytes were obtained from 100-day-old mice. (A) Co-culturing mSOD1 Teffs with mSOD1 microglia increased NOX2 messenger RNA expression compared with wild-type microglia co-cultured with wild-type Teffs (*P = 0.021). Co-culturing wild-type microglia with wild-type Tregs did not change the expression of NOX2 compared with wild-type microglia co-cultured with wild-type Teffs (#P ≥ 0.05). mSOD1 Tregs obtained from stable disease phase mSOD1 mice reduced the NOX2 messenger RNA expression from mSOD1 microglia to levels detected in wild-type microglia/Tregs co-cultures. mSOD1 microglia/Tregs expressed less NOX2 messenger RNA than mSOD1 microglia/Teffs (**P = 0.022). (B) IL-4 levels in the supernatant from wild-type Teffs/microglia were not different than the supernatant IL-4 levels from mSOD1 Teffs / microglia co-cultures (#P ≥ 0.05). Co-culturing stable phase mSOD1 Tregs with mSOD1 microglia increased the amount of IL-4 in the supernatant compared with wild-type microglia/Tregs co-cultures (*P = 0.007). (C) Although anti-IL-4 blocking antibodies (Ab) did not alter the expression levels on NOX2 messenger RNA in mSOD1 microglia/Teffs co-cultures, they increased the NOX2 messenger RNA expression in mSOD1 microglia/Tregs compared with untreated mSOD1 microglia/Tregs co-cultures (*P = 0.0008) and were not different from mSOD1 microglia/Teffs co-cultures treated with anti-IL-4 antibodies (##P ≥ 0.05), suggesting that the suppressive effects of mSOD1 Tregs was mediated through an IL-4 mechanism (Zhao et al., 2006). (D) IL-10 messenger RNA was increased in mSOD1 microglia/Tregs co-cultures compared with wild-type microglia/Tregs (*P = 0.032) or mSOD1 microglia/Teffs co-cultures (**P = 0.004). (E) Both wild-type Tregs and mSOD1 Tregs had increased IL-10 messenger RNA levels compared with wild-type Teffs (*P < 0.001 and **P = 0.008) or mSOD1 Teffs (&P = 0.0004 and &&P = 0.008). (F) Again, mSOD1 Tregs reduced the level of NOX2 messenger RNA expression in mSOD1 microglia/Tregs co-cultures compared with mSOD1 microglia/Teffs (*P < 0.001), but the anti-IL-10 blocking antibodies did not reverse NOX2 messenger RNA expression in mSOD1 microglia/Tregs compared with untreated mSOD1 microglia/Tregs co-cultures (#P ≥ 0.05), suggesting that the suppressive effects of mSOD1 Tregs did not involve IL-10.
Because IL-4 and IL-10 messenger RNA levels were elevated during the stable disease phase in mSOD1 mice (Fig. 2B and C), we investigated whether these cytokines were responsible for the suppression of NOX2 microglial messenger RNA expression. IL-4 protein in the supernatants of microglia co-cultured with either Teffs or Tregs was assayed by enzyme-linked immunosorbent assay; in the absence of T lymphocytes, microglia did not express detectable levels of IL-4 messenger RNA (Zhao et al., 2006). Teffs co-cultured with adult primary mSOD1 or wild-type microglia produced equivalent amounts of IL-4 protein (Fig. 7B). The supernatants of wild-type microglia co-cultured with wild-type Tregs contained increased levels of IL-4. When mSOD1 microglia were co-cultured with mSOD1 Tregs, the supernatants contained more IL-4. To demonstrate whether IL-4 from Tregs contributed to the suppressed microglial NOX2 messenger RNA expression, an anti-IL-4 blocking antibody was added to the co-cultures. The anti-IL-4 antibody reversed the suppressive effects of IL-4 induced by the Tregs and the NOX2 messenger RNA levels rose to levels detected in co-cultures with Teffs (Fig. 7C).
Since Tregs are known to produce IL-10, we next asked whether IL-10 released by Tregs plays a role in suppressing microglial toxic functions (Sakaguchi et al., 2008). IL-10 messenger RNA levels were at baseline when wild-type microglia were co-cultured with wild-type Teffs; wild-type microglia expressed minimal IL-10 messenger RNA (data not shown). When mSOD1 microglia were co-cultured with mSOD1 Teffs, the levels of IL-10 messenger RNA were not increased from that detected in the wild-type microglia/wild-type Teffs co-cultures (Fig. 7D). When wild-type microglia were co-cultured with wild-type Tregs, the IL-10 messenger RNA level was increased and were further increased when mSOD1 microglia were co-cultured with mSOD1 Tregs; wild-type and mSOD1 Teffs expressed equivalent levels of IL-10 messenger RNA (Fig. 7E). Conversely, stable phase mSOD1 Tregs expressed increased IL-10 messenger RNA levels compared with age-matched wild-type Tregs. Anti-IL-10 blocking antibodies did not block the NOX2 messenger RNA suppressive effects of Tregs in co-cultures of microglia and T lymphocytes as previously described using anti-IL-4 antibodies (Fig. 7F), suggesting that the protective effects of microglia can be predominantly modulated by Tregs through their release of IL-4.
Regulatory T lypmphocytes are decreased in the blood of patients with amyotrophic lateral sclerosis with rapidly progressing disease
Since Tregs were increased during the stable disease phase in ALS mice, and since the passive transfer of endogenous mSOD1 CD4+ T lymphocytes isolated during this phase lengthened disease duration by extending the stable disease phase, thus prolonging survival, flow cytometric analyses were used to determine whether Tregs numbers in the blood of patients with ALS were also associated with slower disease progression. Freshly drawn blood samples from 54 patients with the clinical diagnosis of definite or probable sporadic ALS and 33 volunteer subjects were analysed for their percentages of CD3+, CD4+, CD8+ or CD4+CD25+ Tregs. The percentage of CD3+, CD4+, CD8+ or Tregs in the blood was not different between patients with ALS and controls (data not shown). However, when the patients with ALS were separated into slowly versus rapidly progressing patients based on the rate of disease progression using the Appel ALS score, there were 27% fewer CD4+ T lymphocytes in the rapidly progressing patients with ALS (≥1.5 Appel ALS points/month) compared with the slowly progressing patients with ALS (<1.5 Appel ALS points/month); slowly progressing patients with ALS had the same percentage of CD4+ T lymphocytes as controls (50 000 cells were counted; in the volunteers, there were 6755 CD4+ T lymphocytes, and in the slow and fast progressing patients there were 6395 and 4650 CD4+ T lymphocytes, respectively) (Fig. 8A). There were 31% fewer CD4+CD25+ Tregs in rapidly progressing patients than slowly progressing patients; there was no difference in the percentage of CD4+CD25+ Tregs in slowly progressing patients with ALS compared with volunteer subjects (in the same number of cells, there were 422 CD4+/CD25+ T lymphocytes in the control volunteers, and 413 and 287 CD4+/CD25+ T lymphocytes in the slow versus fast progressing patients with ALS, respectively) (Fig. 8B). Most importantly, the percentage of CD4+CD25+ Tregs in the blood of patients with ALS were inversely correlated with the rate of disease progression; the greater the number of CD4+CD25+ Tregs the slower the rate of disease progression (Fig. 8C). These results suggest an association between the greater the percentage of Tregs in the blood with the rate at which a patient with ALS progresses.
Figure 8.

Decreased numbers of Tregs in blood are inversely correlated with a rapid rate of progression in patients with ALS. (A) Using the Appel ALS (AALS) scoring system, there were 27% fewer CD4+ T lymphocytes in rapidly progressing patients with ALS (a disease progression rate of ≥1.5 Appel ALS points/month) compared with slowly progressing patients with ALS (a disease progression rate of <1.5 Appel ALS points/month; P = 0.02). Rapidly progressing patients had fewer CD4+ T lymphocytes than volunteer subjects (P = 0.009). (B) There were 31% fewer CD4+CD25+ Tregs in rapidly progressing patients (≥1.5 Appel ALS points/month) compared with slowly progressing patients (<1.5 Appel ALS points/month) (P = 0.02); volunteer control subjects had 47% more CD4+CD25+ Tregs than rapidly progressing patients (P = 0.003). (C) There was a linear inverse correlation between the number of CD4+CD25+ Tregs in the blood of patients with ALS and rate of disease progression (P = 0.03).
Discussion
This study demonstrates an association between the numbers of Tregs in the blood and lymph nodes, and FoxP3 messenger RNA in the spinal cord, with the stable disease progression phase in mSOD1 mice. Specifically, CD4+CD25+ and CD25+FoxP3+ Tregs were increased during the disease stable phase, and then decreased with accelerating disease burden. Without ex vivo expansion, the passive transfer of T lymphocytes, and more specifically Tregs, obtained from donor mSOD1 animals during the stable phase directly extended the stable disease progression phase and prolonged survival of recipient mSOD1/RAG2−/− mice. The enhanced neuroprotection derived from stable phase Tregs may be attributable to the release of IL-4 and maintenance of M2 microglia; the neuroprotection may also be attributable to the release of glial-derived neurotrophic factor and brain-derived neurotrophic factor, neurotrophic factors previously shown to directly protect neurons (Serpe et al., 2005; Reynolds et al., 2007; Tiemessen et al., 2007). Furthermore, flow cytometric analyses confirmed that the CD4+CD25+ T lymphocytes isolated from stable phase mSOD1 mice and used for the repetitive passive transfer studies indeed co-expressed FoxP3 and IL-4 on a single cell level; Gata-3 messenger RNA levels suggest that T lymphocytes with a Th2 phenotype may have a limited pathogenic role in the lumbar spinal cords of mSOD1 mice, although they may have a greater role in the peripheral compartment. Thus, as disease progresses, there is an operational transformation from a supportive Tregs/M2 effect to an injurious Th1/M1 response, indicating that lymphocytes obtained at early time points are immunocompetent and actively contribute to neuroprotection through their release of IL-4 and neurotrophic factors, and interactions with microglia; T lymphocytes are necessary in part by rendering resident microglia capable of neural maintenance and repair (Fig. 9) (Kipnis and Schwartz, 2005). More importantly, these observations were extended into the ALS patient population where decreased numbers of Tregs in the blood of patients with ALS were correlated with faster disease progression.
Figure 9.

In ALS mice, there is a transformation from protective stabilizing effects of Tregs and M2 microglia to an injurious Teffs and M1 microglial response. The presence of Tregs shifts the balance of microglia responses from cytotoxicity to increased neuroprotection.
The data presented in this report indicate that wild-type CD4+ T lymphocytes are neuroprotective because the repetitive passive transfer of these lymphocytes into mSOD1/RAG2−/− mice restored the stable disease phases and survival times of these mice. Furthermore, the passive transfer of mSOD1 CD4+ T lymphocytes provided additional beneficial protection because they contained greater numbers of CD4+/CD25+/FoxP3+ lymphocytes that co-expressed higher levels of IL-4. Moreover, the passive transfer of a lymphocyte population enriched for CD4+/CD25+ lymphocytes, which increased the numbers of FoxP3+ and IL-4high T lymphocytes, further extended the stable disease phase and prolonged survival. Therefore, these data suggest that the higher the content of IL-4 expressing Tregs, the greater the neuroprotection in mSOD1 mice.
The elevation of Tregs, M2 cells and neurotrophic factors in the spinal cords of mSOD1 mice at disease onset suggests a protective/repair response; the early increased levels of glial-derived neurotrophic factor and FoxP3 messenger RNAs mirrors the upregulation of glial-derived neurotrophic factor following the adoptive transfer of ex vivo activated Tregs into a mouse model of Parkinson’s disease (Reynolds et al., 2007). The increase of Tregs in the spinal cords of stable phase mSOD1 mice is paralleled by the increase in IL-4 and IL-10 messenger RNAs, probably released by the Tregs, resulting in the induction of M2 microglia. Thus, these initial responses led to slowing and stabilization of the disease pathoprogression. Although IL-4 messenger RNA levels are reduced from earlier time points, they are still elevated in mSOD1 mice at end stage disease compared with wild-type mice. We previously demonstrated that CD4+ T lymphocytes are present at end stage disease in mSOD1 mice; we rigorously counted lymphocytes in lumbar spinal cord sections and provided evidence that not only are CD4+ T lymphocytes increasing but also are CD8+ lymphocytes (Beers et al., 2008). These CD4+ T lymphocytes are probably a mixture of Th1 and Th2 Teffs. Th2 lymphocytes are possibly recruited to sites of injury in mSOD1 mice providing the limited IL-4 messenger RNA level. Furthermore, the Ym1 messenger RNA data coincide well with the IL-4 data. Thus, M2 cells are not completely eliminated, but their numbers, or possibly their phenotypic abilities to suppress inflammation, are reduced to levels that are less effective in the presence of a pro-inflammatory milieu that occurs during the rapidly progressing disease phase, and at end stage disease.
Because Gata-3 was restored to wild-type levels in mSOD1/RAG2−/− mice receiving repetitive passive transfers of mSOD1 CD4+ or CD4+/CD25+ T lymphocytes, these results may be interpreted to suggest that there is an infiltration of T lymphocytes with a Th2 phenotype into the lumbar spinal cords of these mice due to the presence of CD4+/CD25+/FoxP3-/IL-4+ lymphocytes in the pool of selected mSOD1 CD4+ or CD4+/CD25+ T lymphocytes, but the results more likely suggest that due to these treatments, the Gata-3 levels were not suppressed in other CNS cells such as microglia and astrocytes, just as it is not suppressed in untreated 16-week-old mSOD1 mice, and because the Gata-3 messenger RNA levels did not rise above untreated wild-type mice levels; the passive transfer of wild-type CD4+ T lymphocytes into mSOD1/RAG2−/− mice did not restore the Gata-3 messenger RNA levels, or increase the messenger RNA level of FoxP3 and IL-4 in the lumbar spinal cords of these mice (Wallach et al., 2009). In contrast, the repetitive passive transfers of mSOD1 CD4+ or CD4+/CD25+ T lymphocytes did increase the messenger RNA levels of both FoxP3 and IL-4 above wild-type levels in lumbar spinal cords of these 20-week-old treated mSOD1/RAG2−/− mice. Thus, if the IL-4 was produced solely by Th2 lymphocytes present in the selected pool of CD4+/CD25+ T lymphocytes, then the IL-4 messenger RNA expression in the spinal cords of these mice would have been greater in the mSOD1 CD4+ T lymphocytes than in the CD4+/CD25+ T lymphocytes. Nevertheless, the small numbers of CD4+/CD25+/FoxP3-/IL-4+ Th2 lymphocytes in the pool of selected and repetitively passively transferred mSOD1 CD4+/CD25+ T lymphocytes may have contributed in a limited manner to the extended stable disease phase and prolonged survival of treated mSOD1/RAG2−/− mice; however, this interpretation does not negate the enhanced neuroprotective role of IL-4 and the greater contribution provided by the augmented numbers of the CD4+/CD25+/FoxP3+/IL-4+ T lymphocytes in this pool. Furthermore, this interpretation is not intended to reflect the inflammatory response that occurs in the cervical spinal cords of mSOD1 mice. Earlier studies reported that mSOD1 mice first developed hindlimb tremors, then progressive hindlimb weakness with rapidly deteriorating gaits, which eventually culminated in paralysis of one or both hindlimbs; forelimb weakness occurred later if at all and in some mice, disease progressed so rapidly that they were sacrificed before any signs of forelimb involvement were observed (Gurney et al., 1994; Wong et al., 1995; Bruijn et al., 1997). Because of these observations, we recently evaluated whether there were differential protective versus injurious inflammatory responses in the cervical and lumbar spinal cords that could explain the temporally distinct clinical disease courses between the limbs of these mice (Beers et al., 2010). In that report, we detected a 2- to 3-fold increase in Gata-3 messenger RNA levels in the cervical regions of 14- and 16-week-old mSOD1 mice compared with their respective lumbar regions; this level was also increased compared with the Gata-3 levels detected in the cervical regions of wild-type mice. Therefore, under pathological stress induced by the overexpression of mSOD1, there are distinct regional and temporal differences in the neuroinflammatory responses that occur in the spinal cords of mSOD1 mice, possibly due to the heterogeneity of the microglial and infiltrating T lymphocyte responses between the cervical and lumbar regions.
At 18 weeks, there is a transformation from a neuroprotective Tregs/Th2 and M2 response to an injurious Th1/M1 response leading to the acceleration of disease. Indeed, the temporal patterns for CD28, CD80, CD86 and chemokine (C–C motif) ligand 2 (CCL2) messenger RNAs suggest a switch in the adaptive/innate immune responses. This transformation is represented by increased microglial messenger RNA expression levels of NOX2, IL-1β and by IL-12, as well as by the increased Th1 levels of T-bet and IFN-γ. The transformation from protection to toxicity may coincide with the expression of IL-6; IL-6 completely inhibits the generation of FoxP3+ Tregs (Bettelli et al., 2006). Since IL-6 can be produced by activated CNS astrocytes, in addition to Th1 lymphocytes, and since astrocytosis is known to occur during disease progression, astrocytes may be one cellular source of IL-6 that may contribute to the inhibition of Tregs in mSOD1 mice (Van Wagoner and Benveniste, 1999; Alexianu et al., 2001; Beers et al., 2008, 2010). Thus, IL-6 may be a key factor that transforms Tregs/Th2 and M2 responses into Th1/M1 responses. Interestingly, IL-6 and transforming growth factor-β messenger RNAs are expressed between 16 and 20 weeks, which may indicate the presence of pro-inflammatory Th17 cells, but IL-17 expression, the product of a Th17 cell response, was not detected; multiple IL-17 primer sets were used and amplified IL-17 in experimental autoimmune encephalomyelitis mice. These results indicate a dialogue among motoneurons, microglia, astrocytes, and the accompanying infiltrating lymphocytes (Appel et al., 2010). Understanding this cellular dialogue may reveal how to manipulate the immune system to extend the stable phase and inhibit the induction of the rapidly accelerating disease phase.
The passive transfers of 90–95% pure stable phase mSOD1 Tregs into recipient mSOD1/RAG2−/− mice resulted in the extension of the stable phase by 3.5 weeks (88% increase) and prolonged mean survival times by 18 days compared with age-matched wild-type CD4+ T lymphocytes, possibly due to the increased Tregs production of IL-4 and/or trophic factors; disease onset was not different between the groups but the passive transfer of mSOD1 Tregs into younger mSOD1/RAG2−/− mice may delay disease onset (Banerjee et al., 2008). It should be emphasized, and contrasted with a previous report, that the isolated Tregs were not ex vivo expanded (Banerjee et al., 2008). The passively transferred mSOD1 CD4+ or wild-type T lymphocytes remained predominantly CD4+ T lymphocytes; few CD8+ T lymphocytes were identified by flow cytometry in blood collected from mice prior to euthanasia and in spinal cord sections stained immunohistochemically with anti-CD8 antibodies. mSOD1/RAG2−/− mice passively transferred with mSOD1 CD4+ T lymphocytes harvested from rapidly progressing 20-week-old mSOD1 mice did not extend duration times or prolong survival compared with mice passively transferred with wild-type CD4+ T lymphocytes, again suggesting the immunosuppressive effects of the increased numbers of Tregs obtained from stable phase mSOD1 mice. mSOD1/RAG2−/− mice passively transferred with Teffs resulted in multi-organ damage or autoimmunity due to the lack of compensatory Tregs (Sakaguchi et al., 2010). Thus, the increased numbers of mSOD1 Tregs harvested from donor mSOD1 mice during the stable phase enhanced the M2 microglia neuroprotection. Although this study indicates that functional Tregs are present early, the Tregs are inhibited beginning at 16 weeks, with the functional consequences of this process not manifested until 18 weeks, at which time the animal enters into the rapidly progressing phase; the timing of these events coincides with when FoxP3 fluorescence/cell levels in the blood and lymph nodes are reduced to approximately wild-type levels. Furthermore, mSOD1 CD4+ lymphocytes isolated from the early stable phase mSOD1 mice results in a more protective T lymphocyte response when compared with the response induced by wild-type T lymphocytes, possibly due to enhanced numbers of Tregs sustaining IL-4 levels and an M2 microglial response. However, an alternate explanation for the enhanced protective potentials of these early disease phase isolated mSOD1 T lymphocytes may be due to an early ‘education’ process occurring in mSOD1 mice that was not available to the wild-type T lymphocytes in the wild-type host or following passive transfer into mSOD1/RAG2−/− mice.
In light of these results, the presence of Tregs was assessed in the blood of patients with sporadic ALS. The percentage of Tregs was decreased in rapidly progressing patients with sporadic ALS compared with slowly progressing patients with sporadic ALS. Compared to control populations, the percentage of Tregs in slowly progressing patients was unchanged suggesting that the normal default status of Tregs may be to protect against Th1-mediated toxicity. It is also possible that the inability to document an increase in Tregs in slowly progressing patients with ALS, as was documented during the stable disease phase in mSOD1 mice, may be due to the fact that patients are not diagnosed and available for blood testing at symptom onset or even prior to the appearance of symptoms. When we analysed our results as previously reported, separating the patients based on ALS functional rating scale revised (ALSFRS-R) >24 and ALS functional rating scale revised (ALSFRS-R) ≤24, representing lower and higher disease severity, respectively, the number of Tregs still inversely correlated with disease severity (Mantovani et al., 2009). The contradictory results obtained between the two reports are not entirely evident. However, the discrepancy may lie in the details for the analysis methods. Their analyses may have been based upon each patient serving as their own control, whereas ours were based on the means of each control group, thus reducing the potential variability.
Since IL-4 and IL-10 messenger RNAs were elevated in the spinal cords of stable phase mSOD1 mice, the suppressive effects of Tregs isolated from stable phase mSOD1 mice were assayed in primary adult microglia co-cultures. In contrast to age-matched Teffs, Tregs efficiently suppressed microglial NOX2 messenger RNA expression. More importantly, the addition of anti-IL-4 antibodies reversed the suppressive effects of Tregs on microglial NOX2 messenger RNA expression. We previously demonstrated that IL-4 suppressed superoxide and nitric oxide release, and attenuated the LPS-induced microglia-mediated motoneuron injury using primary microglial/motoneuron co-cultures; the extent of nitric oxide suppression correlated directly with the extent of motoneuron survival (Zhao et al., 2006). Using a viral vector expression of IL-4, Kiyota et al. (2010) showed that IL-4 reduced microgliosis and improved spatial learning in a mouse model of Alzheimer’s disease. Furthermore, another recent study demonstrated a critical role for T lymphocyte derived IL-4 in the regulation of cognitive functions; depletion of T lymphocytes or IL-4 skewed meningeal myeloid cells towards a pro-inflammatory phenotype and cognitive deficits, and passive transfer of T lymphocytes reversed the cognitive impairments and attenuated the pro-inflammatory response (Derecki et al., 2010). These cumulative data suggest that T lymphocytes, and more specifically Tregs, provide an immunomodulatory IL-4 signal that protects motoneurons against M1 microglial-mediated neurotoxicity and that anti-inflammatory cytokine signalling may be a potential alternative target for ameliorating the devastating effects of neurodegenerative diseases.
Since the default state of microglia is an M2 phenotype that is responsible for the maintenance of CNS homeostasis and prevention of neuronal damage, our data suggest that Tregs assist microglia in maintaining an M2 phenotype (Appel et al., 2010). The ability of Tregs to modulate microglial inflammation, cell function and specific enzymatic activities provides novel tools to manipulate ongoing microglial inflammatory responses; it is clear that there is cross-talk between the immune system and brain, and this dialogue merits our full attention (Lucin and Wyss-Coray, 2009; Appel et al., 2010). In addition, we established that endogenous T lymphocytes, and more specifically Tregs, are increased at early slowly progressing stages, suggesting a beneficial immunomodulatory response early in disease. This immunomodulatory benefit was demonstrated by the passive transfer of wild-type or mSOD1CD4+ T lymphocytes, without ex vivo activation, into ALS mice lacking functional T lymphocytes and lengthened disease duration and prolonged survival. The passive transfer of endogenous Tregs from early disease stage mSOD1 mice into ALS mice, again without ex vivo activation, was further shown to have substantially greater immunomodulatory benefit compared with ALS mice receiving wild-type or mSOD1 CD4+ T lymphocytes. The secretion of IL-4 by mSOD1 Tregs, which can directly suppress the toxic properties of microglia, represents a potential mechanism for this enhanced life expectancy; flow cytometric analyses determined that CD4+/CD25+/FoxP3+ T lymphocytes co-expressed IL-4 on a single cell level. These unique observations found in ALS mice were extended into the ALS patient population where patients with more rapidly progressing disease had decreased numbers of Tregs; the numbers of Tregs were inversely correlated with disease progression rates. Thus, these studies provided compelling evidence that the presence of Tregs are neuroprotective and support a rationale for Tregs immunotherapy in patients with ALS. However, immunotherapeutic interventions must begin early in the pathogenic process since immune dysfunction occurs at later disease stages. Furthermore, these data suggest that increasing the levels of Tregs in patients with ALS might slow the rate of disease progression and stabilize patients for longer periods of time than other currently available therapies, thus enhancing their quality of life.
Funding
National Institutes of Health (NS067153 and NS048950); Muscular Dystrophy Association; Texas Methodist Foundation; The Methodist Research Institute. The authors have no conflicting financial interests.
Supplementary material
Supplementary material is available at Brain online.
Acknowledgements
The authors thank Dr Malcolm Brenner for his expert critical review of our manuscript. We also thank Xiaoli Wang for her technical assistance and Yu Li and Audrey Ponce De Leon for their assistance with the flow cytometric assays.
Glossary
Abbreviations
- ALS
amyotrophic lateral sclerosis
- IFN-γ
interferon-γ
- IL
interleukin
- mSOD1
mutant Cu2+/Zn2+ superoxide dismutase
- RAG2
recombination activating gene-2
- Tregs
regulatory T lymphocytes
- Teffs
effector lymphocytes
References
- Alexianu ME, Kozovska M, Appel SH. Immune reactivity in a mouse model of familial ALS correlates with disease progression. Neurology. 2001;57:1282–9. doi: 10.1212/wnl.57.7.1282. [DOI] [PubMed] [Google Scholar]
- Aloisi F, De Simone R, Columba-Cabezas S, Penna G, Adorini L. Functional maturation of adult mouse resting microglia into an APC is promoted by granulocyte-macrophage colony-stimulating factor and interaction with Th1 cells. J Immunol. 2000;164:1705–12. doi: 10.4049/jimmunol.164.4.1705. [DOI] [PubMed] [Google Scholar]
- Appel SH, Beers DR, Henkel JS. T cell-microglial dialogue in Parkinson's; disease and amyotrophic lateral sclerosis: are we listening? Trends Immunol. 2010;31:7–17. doi: 10.1016/j.it.2009.09.003. [DOI] [PMC free article] [PubMed] [Google Scholar]
- Avidan H, Kipnis J, Butovsky O, Caspi RR, Schwartz M. Vaccination with autoantigen protects against aggregated beta-amyloid and glutamate toxicity by controlling microglia: effect of CD4+CD25+ T cells. Eur J Immunol. 2004;34:3434–45. doi: 10.1002/eji.200424883. [DOI] [PubMed] [Google Scholar]
- Banerjee R, Mosley RL, Reynolds AD, Dhar A, Jackson-Lewis V, Gordon PH, et al. Adaptive immune neuroprotection in G93A-SOD1 amyotrophic lateral sclerosis mice. PLoS One. 2008;3:e2740. doi: 10.1371/journal.pone.0002740. [DOI] [PMC free article] [PubMed] [Google Scholar]
- Beers DR, Henkel JS, Xiao Q, Zhao W, Wang J, Yen AA, et al. Wild-type microglia extends survival in PU.1 knockout mice with familial amyotrophic lateral sclerosis. Proc Natl Acad Sci USA. 2006;103:16021–6. doi: 10.1073/pnas.0607423103. [DOI] [PMC free article] [PubMed] [Google Scholar]
- Beers DR, Henkel JS, Zhao W, Wang J, Appel SH. CD4+ T-cells support glial neuroprotection, slow disease progression, and modify glial morphology in an animal model of inherited ALS. Proc Natl Acad Sci USA. 2008;105:15558–63. doi: 10.1073/pnas.0807419105. [DOI] [PMC free article] [PubMed] [Google Scholar]
- Beers DR, Zhao W, Liao B, Kano O, Wang J, Huang A, et al. Neuroinflammation modulates distinct regional and temporal clinical responses in ALS mice. Brain Behav Immun. 2010 doi: 10.1016/j.bbi.2010.12.008. Advance Access date 19 December [Epub ahead of print] [DOI] [PMC free article] [PubMed] [Google Scholar]
- Bettelli E, Carrier Y, Gao W, Korn T, Strom TB, Oukka M, et al. Reciprocal developmental pathways for the generation of pathogenic effector TH17 and regulatory T cells. Nature. 2006;441:235–8. doi: 10.1038/nature04753. [DOI] [PubMed] [Google Scholar]
- Boillée S, Vande Velde C, Cleveland DW. ALS: a disease of motor neurons and their nonneuronal neighbors. Neuron. 2006a;52:39–59. doi: 10.1016/j.neuron.2006.09.018. [DOI] [PubMed] [Google Scholar]
- Boillée S, Yamanaka K, Lobsiger CS, Copeland NG, Jenkins NA, Kassiotis G, et al. Onset and progression in inherited ALS determined by motor neurons and microglia. Science. 2006b;312:1389–92. doi: 10.1126/science.1123511. [DOI] [PubMed] [Google Scholar]
- Brooks BR. El Escorial World Federation of Neurology criteria for the diagnosis of amyotrophic lateral sclerosis. Subcommittee on Motor Neuron Diseases/Amyotrophic Lateral Sclerosis of the World Federation of Neurology Research Group on Neuromuscular Diseases and the El Escorial "Clinical limits of amyotrophic lateral sclerosis" workshop contributors. J Neurol Sci. 1994;124(Suppl):96–107. doi: 10.1016/0022-510x(94)90191-0. [DOI] [PubMed] [Google Scholar]
- Bruijn LI, Becher MW, Lee MK, Anderson KL, Jenkins NA, Copeland NG, et al. ALS-linked SOD1 mutant G85R mediates damage to astrocytes and promotes rapidly progressive disease with SOD1-containing inclusions. Neuron. 1997;18:327–38. doi: 10.1016/s0896-6273(00)80272-x. [DOI] [PubMed] [Google Scholar]
- Cardona AE, Pioro EP, Sasse ME, Kostenko V, Cardona SM, Dijkstra IM, et al. Control of microglial neurotoxicity by the fractalkine receptor. Nat Neurosci. 2006;9:917–24. doi: 10.1038/nn1715. [DOI] [PubMed] [Google Scholar]
- Chiu IM, Chen A, Zheng Y, Kosaras B, Tsiftsoglou SA, Vartanian TH, et al. T lymphocytes potentiate endogenous neuroprotective inflammation in a mouse model of ALS. Proc Natl Acad Sci USA. 2008;105:17913–8. doi: 10.1073/pnas.0804610105. [DOI] [PMC free article] [PubMed] [Google Scholar]
- Colton CA, Mott RT, Sharpe H, Xu Q, Van Nostrand WE, Vitek MP. Expression profiles for macrophage alternative activation genes in AD and in mouse models of AD. J Neuroinflammation. 2006;3:27. doi: 10.1186/1742-2094-3-27. [DOI] [PMC free article] [PubMed] [Google Scholar]
- Derecki NC, Cardani AN, Yang CH, Quinnies KM, Crihfield A, Lynch KR, et al. Regulation of learning and memory by meningeal immunity: a key role for IL-4. J Exp Med. 2010;207:1067–80. doi: 10.1084/jem.20091419. [DOI] [PMC free article] [PubMed] [Google Scholar]
- Engelhardt JI, Tajti J, Appel SH. Lymphocytic infiltrates in the spinal cord in amyotrophic lateral sclerosis. Arch Neurol. 1993;50:30–6. doi: 10.1001/archneur.1993.00540010026013. [DOI] [PubMed] [Google Scholar]
- Frank MG, Wieseler-Frank JL, Watkins LR, Maier SF. Rapid isolation of highly enriched and quiescent microglia from adult rat hippocampus: immunophenotypic and functional characteristics. J Neurosci Methods. 2006;151:121–30. doi: 10.1016/j.jneumeth.2005.06.026. [DOI] [PubMed] [Google Scholar]
- Gordon S, Martinez FO. Alternative activation of macrophages: mechanism and functions. Immunity. 2010;32:593–604. doi: 10.1016/j.immuni.2010.05.007. [DOI] [PubMed] [Google Scholar]
- Gurney ME, Pu H, Chiu AY, Dal Canto MC, Polchow CY, Alexander DD, et al. Motor neuron degeneration in mice that express a human Cu,Zn superoxide dismutase mutation. Science. 1994;264:1772–5. doi: 10.1126/science.8209258. [DOI] [PubMed] [Google Scholar]
- Haverkamp LJ, Appel V, Appel SH. Natural history of amyotrophic lateral sclerosis in a database population. Validation of a scoring system and a model for survival prediction. Brain. 1995;118:707–19. doi: 10.1093/brain/118.3.707. [DOI] [PubMed] [Google Scholar]
- Henkel JS, Beers DR, Siklos L, Appel SH. The chemokine MCP-1 and the dendritic and myeloid cells it attracts are increased in the mSOD1 mouse model of ALS. Mol Cell Neurosci. 2006;31:427–37. doi: 10.1016/j.mcn.2005.10.016. [DOI] [PubMed] [Google Scholar]
- Henkel JS, Beers DR, Zhao W, Appel SH. Microglia in ALS: The good, the bad, and the resting. J Neuroimmune Pharmacol. 2009;4:389–98. doi: 10.1007/s11481-009-9171-5. [DOI] [PubMed] [Google Scholar]
- Henkel JS, Engelhardt JI, Siklós L, Simpson EP, Kim SH, Pan T, et al. Presence of dendritic cells, MCP-1, and activated microglia/macrophages in amyotrophic lateral sclerosis spinal cord tissue. Ann Neurol. 2004;55:221–35. doi: 10.1002/ana.10805. [DOI] [PubMed] [Google Scholar]
- Kipnis J, Schwartz M. Controlled autoimmunity in CNS maintenance and repair: naturally occurring CD4+CD25+ regulatory T-Cells at the crossroads of health and disease. Neuromolecular Med. 2005;7:197–206. doi: 10.1385/NMM:7:3:197. [DOI] [PubMed] [Google Scholar]
- Kiyota T, Okuyama S, Swan RJ, Jacobsen MT, Gendelman HE, Ikezu T. CNS expression of anti-inflammatory cytokine interleukin-4 attenuates Alzheimer's; disease-like pathogenesis in APP+PS1 bigenic mice. FASEB J. 2010;24:3093–3102. doi: 10.1096/fj.10-155317. [DOI] [PMC free article] [PubMed] [Google Scholar]
- Lincecum JM, Vieira FG, Wang MZ, Thompson K, De Zutter GS, Kidd J, et al. From transcriptome analysis to therapeuti c anti-CD40L treatment in the SOD1 model of amyotrophic lateral sclerosis. Nat Genet. 2010;42:392–9. doi: 10.1038/ng.557. [DOI] [PubMed] [Google Scholar]
- Lucin KM, Wyss-Coray T. Immune activation in brain aging and neurodegeneration: too much or too little? Neuron. 2009;64:110–22. doi: 10.1016/j.neuron.2009.08.039. [DOI] [PMC free article] [PubMed] [Google Scholar]
- Mantovani S, Garbelli S, Pasini A, Alimonti D, Perotti C, Melazzini M, et al. Immune system alterations in sporadic amyotrophic lateral sclerosis patients suggest an ongoing neuroinflammatory process. J Neuroimmunol. 2009;210:73–9. doi: 10.1016/j.jneuroim.2009.02.012. [DOI] [PubMed] [Google Scholar]
- Marden JJ, Harraz MM, Williams AJ, Nelson K, Luo M, Paulson H, et al. Redox modifier genes in amyotrophic lateral sclerosis in mice. J Clin Invest. 2007;117:2913–9. doi: 10.1172/JCI31265. [DOI] [PMC free article] [PubMed] [Google Scholar]
- McGeer PL, McGeer EG. Inflammatory processes in amyotrophic lateral sclerosis. Muscle Nerve. 2002;26:459–70. doi: 10.1002/mus.10191. [DOI] [PubMed] [Google Scholar]
- Moisse K, Strong MJ. Innate immunity in amyotrophic lateral sclerosis. Biochim Biophys Acta. 2006;1762:1083–93. doi: 10.1016/j.bbadis.2006.03.001. [DOI] [PubMed] [Google Scholar]
- Reynolds AD, Banerjee R, Liu J, Gendelman HE, Mosley RL. Neuroprotective activities of CD4+CD25+ regulatory T cells in an animal model of Parkinson’s disease. J Leukoc Biol. 2007;82:1083–94. doi: 10.1189/jlb.0507296. [DOI] [PubMed] [Google Scholar]
- Reynolds AD, Stone DK, Hutter JA, Benner EJ, Mosley RL, Gendelman HE. Regulatory T cells attenuate Th17 cell-mediated nigrostriatal dopaminergic neurodegeneration in a model of Parkinson's; disease. J Immunol. 2010;184:2261–71. doi: 10.4049/jimmunol.0901852. [DOI] [PMC free article] [PubMed] [Google Scholar]
- Sakaguchi S. Naturally arising Foxp3-expressing CD25+CD4+ regulatory T cells in immunological tolerance to self and non-self. Nat Immunol. 2005;6:345–52. doi: 10.1038/ni1178. [DOI] [PubMed] [Google Scholar]
- Sakaguchi S, Miyara M, Costantino CM, Hafler DA. FOXP3+ regulatory T cells in the human immune system. Nat Rev Immunol. 2010;10:490–500. doi: 10.1038/nri2785. [DOI] [PubMed] [Google Scholar]
- Sakaguchi S, Yamaguchi T, Nomura T, Ono M. Regulatory T cells and immune tolerance. Cell. 2008;133:775–87. doi: 10.1016/j.cell.2008.05.009. [DOI] [PubMed] [Google Scholar]
- Schwartz M, Shechter R. Systemic inflammatory cells fight off neurodegenerative disease. Nat Rev Neurol. 2010;6:405–410. doi: 10.1038/nrneurol.2010.71. [DOI] [PubMed] [Google Scholar]
- Serpe CJ, Byram SC, Sanders VM, Jones KJ. Brain-derived neurotrophic factor supports facial motoneuron survival after facial nerve transaction in immunodeficient mice. Brain Behav Immun. 2005;19:173–80. doi: 10.1016/j.bbi.2004.07.005. [DOI] [PubMed] [Google Scholar]
- Tiemessen MM, Jagger AL, Evans HG, van Herwijnen MJ, John S, Taams LS. CD4+CD25+Foxp3+ regulatory T cells induce alternative activation of human monocytes/macrophages. Proc Natl Acad Sci USA. 2007;104:19446–51. doi: 10.1073/pnas.0706832104. [DOI] [PMC free article] [PubMed] [Google Scholar]
- Turner MR, Cagnin A, Turkheimer FE, Miller CC, Shaw CE, Brooks DJ, et al. Evidence of widespread cerebral microglial activation in amyotrophic lateral sclerosis: an [11C](R)-PK11195 positron emission tomography study. Neurobiol Dis. 2004;15:601–9. doi: 10.1016/j.nbd.2003.12.012. [DOI] [PubMed] [Google Scholar]
- Urushitani M, Sik A, Sakurai T, Nukina N, Takahashi R, Julien JP. Chromogranin-mediated secretion of mutant superoxide dismutase proteins linked to amyotrophic lateral sclerosis. Nat Neurosci. 2006;9:108–18. doi: 10.1038/nn1603. [DOI] [PubMed] [Google Scholar]
- Van Wagoner NJ, Benveniste EN. Interleukin-6 expression and regulation in astrocytes. J Neuroimmunol. 1999;100:124–39. doi: 10.1016/s0165-5728(99)00187-3. [DOI] [PubMed] [Google Scholar]
- Wallach I, Zhang J, Hartmann A, Van Landeghem FKH, Ivanova A, Klar M, et al. Erythropoietin-receptor gene regulation in neuronal cells. Pediatr Res. 2009;65:619–24. doi: 10.1203/PDR.0b013e31819ea3b8. [DOI] [PubMed] [Google Scholar]
- Weydt P, Yuen EC, Ransom BR, Möller T. Increased cytotoxic potential of microglia from ALS-transgenic mice. Glia. 2004;48:179–82. doi: 10.1002/glia.20062. [DOI] [PubMed] [Google Scholar]
- Wong PC, Pardo CA, Borchelt DR, Lee MK, Copeland NG, Jenkins NA, et al. An adverse property of a familial ALS-linked SOD1 mutation causes motor neuron disease characterized by vacuolar degeneration of mitochondria. Neuron. 1995;14:1105–16. doi: 10.1016/0896-6273(95)90259-7. [DOI] [PubMed] [Google Scholar]
- Xiao Q, Zhao W, Beers DR, Yen AA, Xie W, Henkel JS, et al. Mutant SOD1(G93A) microglia are more neurotoxic relative to wild-type microglia. J Neurochem. 2007;102:2008–19. doi: 10.1111/j.1471-4159.2007.04677.x. [DOI] [PubMed] [Google Scholar]
- Zhang R, Gascon R, Miller RG, Gelinas DF, Mass J, Hadlock K, et al. Evidence for systemic immune system alterations in sporadic amyotrophic lateral sclerosis (sALS) J Neuroimmunol. 2005;159:215–24. doi: 10.1016/j.jneuroim.2004.10.009. [DOI] [PubMed] [Google Scholar]
- Zhang R, Gascon R, Miller RG, Gelinas DF, Mass J, Lancero M, et al. MCP-1 chemokine receptor CCR2 is decreased on circulating monocytes in sporadic amyotrophic lateral sclerosis (sALS) J Neuroimmunol. 2006;179:87–93. doi: 10.1016/j.jneuroim.2006.06.008. [DOI] [PubMed] [Google Scholar]
- Zhao W, Beers DR, Henkel JS, Zhang W, Urushitani M, Julien JP, et al. Extracellular mutant SOD1 induces microglial-mediated motoneuron injury. Glia. 2010;58:231–43. doi: 10.1002/glia.20919. [DOI] [PMC free article] [PubMed] [Google Scholar]
- Zhao W, Xie W, Xiao Q, Beers DR, Appel SH. Protective effects of an anti-inflammatory cytokine, interleukin-4, on motoneuron toxicity induced by activated microglia. J Neurochem. 2006;99:1176–87. doi: 10.1111/j.1471-4159.2006.04172.x. [DOI] [PubMed] [Google Scholar]
- Zhu J, Paul WE. CD4+ T cell plasticity-Th2 cells join the crowd. Immunity. 2010;32:11–13. doi: 10.1016/j.immuni.2010.01.001. [DOI] [PMC free article] [PubMed] [Google Scholar]
Associated Data
This section collects any data citations, data availability statements, or supplementary materials included in this article.
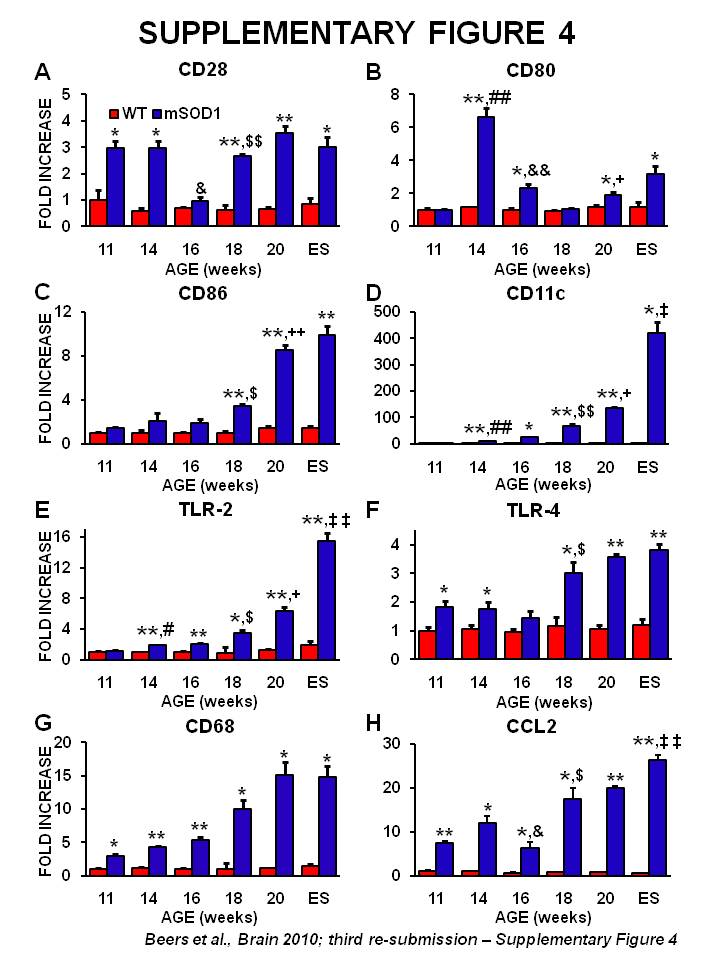