Abstract

Ketone handedness was discriminated using circular dichroism (CD) spectroscopy by monitoring the metal-to-ligand charge transfer (MLCT) bands of complexes between [CuI((S)-1)(CH3CN)2]PF6 and derivatized α-chiral cyclohexanones (4). This method was able to quantify enantiomeric excess of unknown samples using a calibration curve, giving an absolute error of ±7%. The analysis was rapid, allowing potential application of this assay in high-throughput screening (HTS).
Asymmetric synthesis is well-recognized as a cost-effective method for the production of enantiomerically pure products.1 Combinatorial methods combined with high-throughput screening (HTS) has become a tool for finding appropriate catalysts/auxiliaries for asymmetric synthesis because it allows for a large number of candidates to be rapidly examined. However, the determination of the enantiomeric excess (ee) of reaction products is a limiting factor in catalyst discovery. Chromatographic techniques are commonly used to determine ee due to their high accuracy, but the intrinsically serial analysis restricts their ultimate use in HTS.2
Optical signaling techniques are well adapted for HTS because they use instruments such as circular dichroism (CD) spectrophotometers, fluorimeters, and UV-vis spectrophotometers, which require less time for analysis compared to chromatographic techniques. Typically, a single measurement can be conducted in under a minute, allowing for rapid analysis of samples for HTS of asymmetric catalysts/auxiliaries. Due to the advantage of speed, numerous techniques using optical signaling approaches have been investigated for the determination of ee.3,4,5,6,7 These optical signaling techniques have the advantage that they can be transitioned to a microwell plate format, allowing for an even more rapid means of analysis compared to single-cuvette analyses.
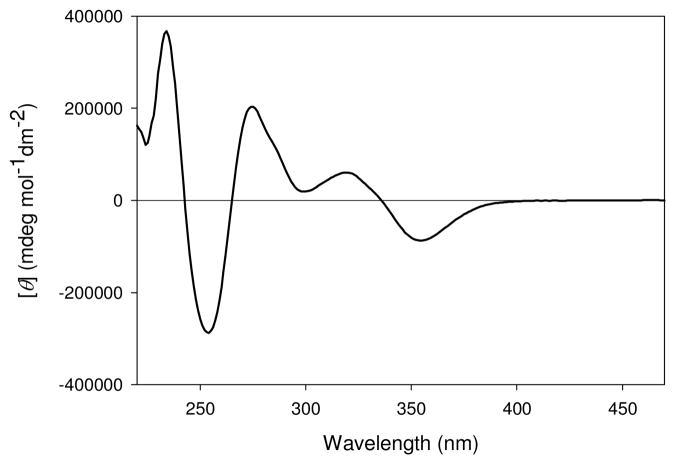
Here we demonstrate the use of CD spectroscopy to determine ee values of α-chiral cyclohexanones. An analyte binding event that would induce CD signals in wavelengths longer than 320 nm was sought because the analytes themselves, most organic functional groups, and organic solvents are CD silent in this region. This would potentially allow the technique to be used on crude reaction mixtures without purification, making the analysis step even more rapid. For these purposes, the chiral metal complex used in this study was 2,2′-bis(diphenylphosphino)-1,1′-binaphthyl (BINAP) copper (I) complex ([CuI(1)(CH3CN)2]PF6). Previous studies have shown that the CD active MLCT bands (Figure 1) are modulated by complexation of chiral analytes, allowing for enantioselective discrimination.3a,3c
Figure 1.
CD spectra of [CuI((S)-1)(CH3CN)2]PF6 (400 μM) in CH3CN.
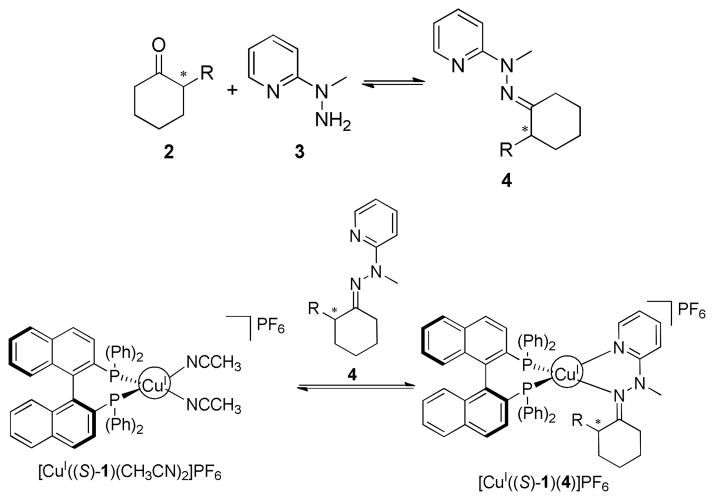
The analytes targeted in this study, α-chiral cyclohexanones (2), presented a challenge due to their limited number of functional handles to complex to the Cu(I) metal center. To create ligands, they were derivatized with 1-methyl-1-(2-pyridyl) hydrazine (3) to produce bidentate hydrazones 4 (Scheme 1).
Scheme 1.
Derivatization of α-chiral cyclohexanones (2) with 1-methyl-1-(2-pyridyl) hydrazine (3) to produce a bidentate analyte (4), followed by complexation to [CuI((S)-1)(CH3CN)2]PF6 to produce [CuI((S)-1)(4)]PF6.
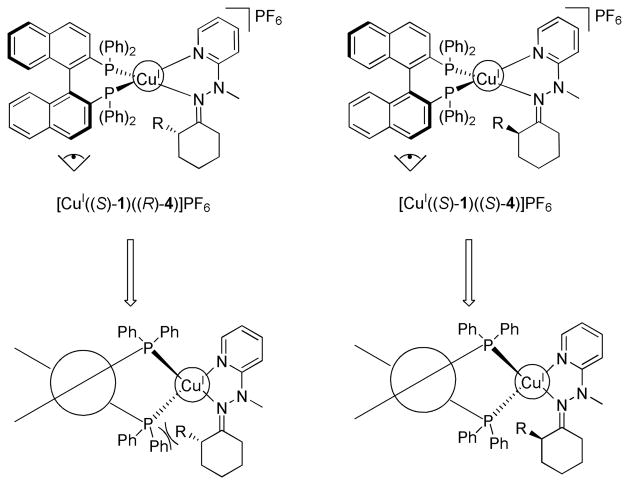
We postulated that enantioselective discrimination of 4 by the chiral BINAP complex could arise via different twist angles that the two enantiomers of 4 impart on the naphthyl rings in 1. As shown in Figure 2, (S)-4 is predicted to impart a smaller change in the twist of the two naphthyl moieties of [CuI((S)-1)(CH3CN)2]PF6. This is due to the avoidance of steric interactions between the R-group and the phosphine ligand. On the other hand, binding of the enantiomer (R)-4 induces a steric clash between the substituent in (R)-4 and the phosphine ligand, potentially inducing a larger twist to prevent such interactions. This postulate is illustrated by the Newman projection of the two diastereomeric complexes, [CuI((S)-1)((R)-4)]PF6 and [CuI((S)-1)((S)-4)]PF6 in Figure 2. As discussed below, such twists are reflected in the CD spectra, where the predicted disfavored diastereomeric complexes have a larger change in their CD signals from the initial MLCT band of [CuI((S)-1)(CH3CN)2]PF6. By monitoring this change, chiral analytes can be enantioselectively discriminated.
Figure 2.
The steric interactions allowing for enantioselective discrimination of hydrazone 4 with [CuI((S)-1)(CH3CN)2]PF6.
Because there are only a few commercially available α-chiral cyclohexanones, some of our analytes needed to be synthesized. Oxidation with pyridinium chlorochromate (PCC) of commercially available enantiomerically pure alcohols, 2-phenylcyclohexanol and 2-(2-phenylpropan-2-yl)cyclohexanol produced enantiomerically pure ketones, 2-phenylcyclohexanone and 2-(2-phenylpropan-2-yl)cyclohexanone, respectively. Using a polarimeter, the optical rotations of each ketone’s enantiomer pair were confirmed to be equal and opposite. In addition, the molar optical rotation of 2-phenylcyclohexanone had been previously reported in the literature and our sample was found to be in agreement.8
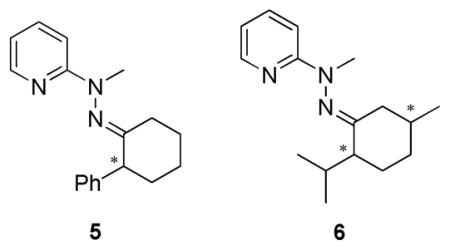
Derivatization of enantiomerically pure (R)- and (S)-2-phenylcyclohexanone with hydrazine 3 produced hydrazone 5, while 2-(2-phenylpropan-2-yl)cyclohexanone did not react with hydrazine 3. This was most likely due to the bulky substituent at the α-position of 2-(2-phenylpropan-2-yl)cyclohexanone. Fortunately, derivatization of (R,S)- and (S,R)-menthone with hydrazine 3 produced hydrazones 6 as a second analyte.
Condensation of hydrazine 3 with α-chiral ketone 2 creates two isomers (E)- and (Z)-4 (Figure 3). Through HR-MS analysis of the hydrazones 5 and 6, one peak was found for each compound, correlating to their [M+H]+. However, in the 13C NMR studies, it was observed that duplicate peaks were present, which did not correlate to the starting material. One set of peaks had a significantly smaller intensity, and chemical shifts close to the major peaks. In addition, the 1H NMR showed extra smaller sets of peaks, whose chemical shifts were also similar to the major peaks. This lead us to conclude that both (E)- and (Z)-isomers have been formed. Although two isomers were present, no purification was performed, since the relative ratio of isomers was consistent each time the reaction was conducted (see Supporting Information). Due to the steric clash between the methyl group and the R-substituent on the α-position of (Z)-4, the dominant product from the condensation was postulated to be (E)-4.
Figure 3.
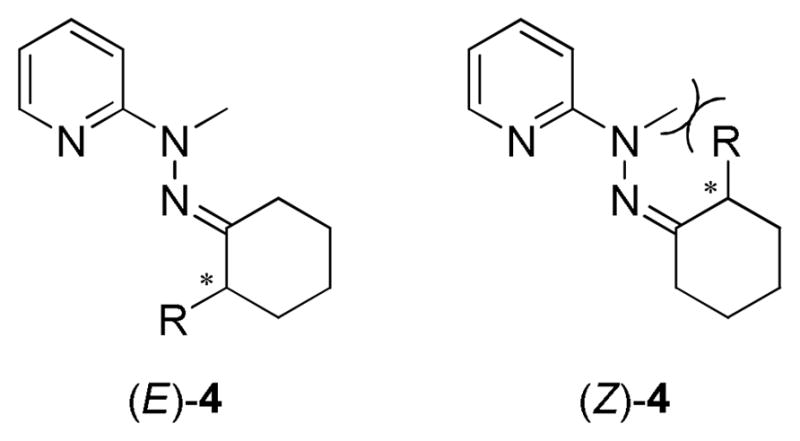
(E)- and (Z)-hydrazone produced upon derivatization of α-chiral ketone (2) with hydrazine 3.
One might argue that a technique requiring derivatization of the analyte for the determination of ee is not amenable for HTS of asymmetric catalysts/auxiliaries, but this step is a single addition to the time of analysis for all samples. The derivatization step can be carried out in parallel for all the samples requiring analysis, especially since HTS of catalysts/auxiliaries often uses microreactors. Hence, this synthetic step (5 – 26 hr) can potentially be incorporated into the asymmetric reaction scheme.
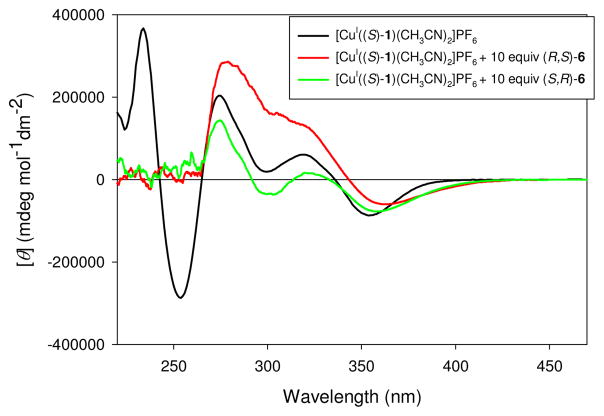
Upon obtaining derivatized enantiomerically pure hydrazones, 5 and 6, titrations with [CuI((S)-1)(CH3CN)2]PF6 were conducted to determine the assay’s ability to discriminate the enantiomers. There was no CD signal in the visible region from either enantiomers of 6, or the enantiomers of 6 with the Cu(I) source, [CuI(CH3CN)4]PF6 (see Supporting Information). A large CD signal was observed for [CuI((S)-1)(CH3CN)2]PF6, [CuI((S)-1)((R,S)-6)]PF6 and [CuI((S)-1)((S,R)-6)]PF6 (Figure 4). The MLCT bands are different for each enantiomer of 6, allowing for enantioselective discrimination.
Figure 4.
CD spectra of: [CuI((S)-1)(CH3CN)2]PF6 (401 μM) in CH3CN (—), [CuI((S)-1)(CH3CN)2]PF6 (401 μM) mixed with (R,S)-6 (4 mM) (
 ), and [CuI((S)-1)(CH3CN)2]PF6 (401 μM) mixed with (S,R)-6 (4 mM) (
 ).
).
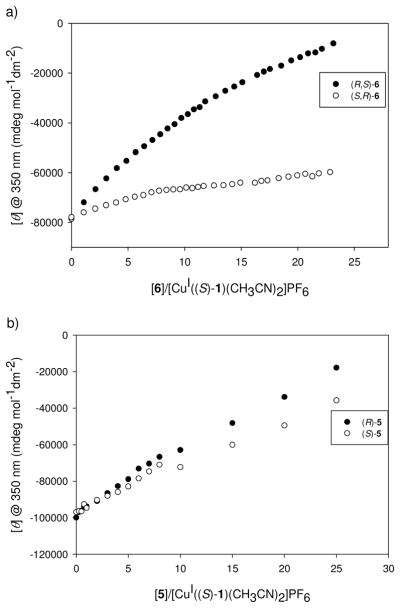
The molar ellipticity of the MLCT band at 350 nm (λmax of the MLCT band) was monitored during a titration, and the enantiomers of 6 were discriminated as shown in Figure 5a. After being able to enantioselectively discriminate 6 with [CuI((S)-1)(CH3CN)2]PF6, the scope of this study was extended to target 5. As shown in Figure 5b, hydrazone 5 was also successfully enantioselectively discriminated, although to a lesser degree.
Figure 5.
CD isotherm at 350 nm with the addition of: a) (R,S)- or (S,R)-6 (15.4 mM and 19.1 mM, respectively) into a solution of [CuI((S)-1)(CH3CN)2]PF6 (398 μM) in CH3CN. b) (R)- or (S)-5 (18.1 mM and 22.2 mM, respectively) into a solution of [CuI((S)-1)(CH3CN)2]PF6 (400 μM) in CH3CN.
The enantiomer that induced the largest signal change was (R,S)-6, which correlates to the hypothesis that the enantiomer with a (R)-α-stereocenter would lead to more steric interactions with the BINAP moiety, forcing a larger twist of the naphthyl rings, and a larger change in the MLCT band. This was also true of analyte 5, as shown by the larger change in the MLCT band for (R)-5 compared to (S)-5.
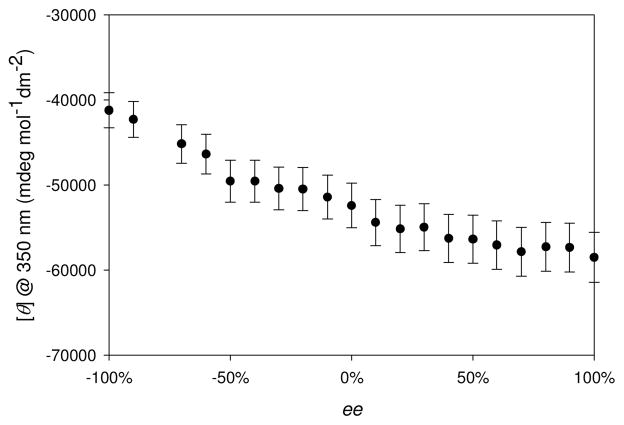
To demonstrate the assay’s ability to determine enantiomeric excess values of unknown samples, a calibration curve was generated by monitoring the molar ellipticity at 350 nm with different ee solutions of 5 titrated into enantiomerically pure [CuI((S)-1)(CH3CN)2]PF6 (Figure 6). The ee calibration curve was subjected to linear and second-degree polynomial regression, and the best-fit curve was used to determine the ee of five independently prepared unknown samples. The calibration curve had considerable scatter, and yet, as now described, the determination of ee values for unknown samples were quite accurate. Errors were calculated for each sample by taking the absolute difference between the actual ee and the experimentally determined ee. The average absolute error for determining the ee of 5 for the five unknown samples was ±6.6%.
Figure 6.
Molar ellipticity at 350 nm with ±5% error bars as a function of ee performed with the addition of 5 (10 mM) into a solution of [CuI((S)-1)(CH3CN)2]PF6 (400 μM) in CH3CN.
Though the calibration curve using [CuI((S)-1)(CH3CN)2]PF6 host (Figure 6) has a region (50% – 100%) with small signal change, the rest of the calibration curve (−100% to 50%) shows significant curvature. The use of the enantiomeric complex [CuI((R)-1)(CH3CN)2]PF6 will produce a mirror image calibration curve whose region of maximum signal change closely corresponds to that of minimum signal change from [CuI((S)-1)(CH3CN)2]PF6 host shown. Thanks to this property, using both receptors separately should make it possible to differentiate between even closely separated ee samples across the whole ee range.
In summary, using commercially available [CuI((S)-1)(CH3CN)2]PF6, α-chiral cyclohexanones were enantioselectively discriminated using circular dichroism spectroscopy. The speed at which CD operates is advantageous for high-throughput screening of asymmetric catalysts/auxiliaries. We have demonstrated this system’s ability to discriminate enantiomers of derivatized cyclohexanones, and determine the ee of unknown samples with approximately ±7% absolute error.
Supplementary Material
Acknowledgments
We gratefully acknowledge the financial support from the National Institutes of Health (GM77437) and Welch Foundation (F-1151).
Footnotes
Supporting Information Available: Experimental procedures, 1H and 13C NMR data, spectral data and ee determinations. This information is available free of charge via the Internet at http://pubs.acs.org.
References
- 1.(a) Tsukamoto M, Kagan HB. Adv Synth Catal. 2002;344:453. [Google Scholar]; (b) Charbonneau V, Ogilvie WW. Mini-Rev Org Chem. 2005;2:313. [Google Scholar]
- 2.Traverse JF, Snapper ML. Drug Discovery Today. 2002;7:1002. doi: 10.1016/s1359-6446(02)02436-4. [DOI] [PubMed] [Google Scholar]
- 3.Molecular Sensors: Nieto S, Dragna JM, Anslyn EV. Chem--Eur J. 2010;16:227. doi: 10.1002/chem.200902650.Nieto S, Lynch VM, Anslyn EV, Kim H, Chin J. Org Lett. 2008;10:5167. doi: 10.1021/ol802085j.Nieto S, Lynch VM, Anslyn EV, Kim H, Chin J. J Am Chem Soc. 2008;130:9232. doi: 10.1021/ja803443j.Leung D, Anslyn EV. J Am Chem Soc. 2008;130:12328. doi: 10.1021/ja8038079.Leung D, Folmer-Andersen JF, Lynch VM, Anslyn EV. J Am Chem Soc. 2008;130:12318. doi: 10.1021/ja803806c.Shabbir SH, Regan CJ, Anslyn EV. Proceedings of the National Academy of Sciences of the United States of America, Early Edition. 2009. p. 1.Zhu L, Shabbir SH, Anslyn EV. Chem--Eur J. 2006;13:99. doi: 10.1002/chem.200600402.Liu S, Pestano JPC, Wolf C. J Org Chem. 2008;73:4267. doi: 10.1021/jo800506a.Richard GI, Marwani HM, Jiang S, Fakayode SO, Lowry M, Strongin RM, Warner IM. Appl Spectrosc. 2008;62:476. doi: 10.1366/000370208784344514.Wolf C, Liu S, Reinhardt BC. Chem Commun. 2006:4242. doi: 10.1039/b609880k.Corradini R, Paganuzzi C, Marchelli R, Pagliari S, Dossena A, Duchateau A. J Inclusion Phenom Macrocyclic Chem. 2007;57:625.Corradini R, Paganuzzi C, Marchelli R, Pagliari S, Sforza S, Dossena A, Galaverna G, Duchateau A. J Mater Chem. 2005;15:2741. doi: 10.1002/chir.10272.
- 4.IR-thermography: Reetz MT, Becker MH, Kuhling KM, Holzwarth A. Angew Chem, Int Ed. 1998;37:2647. doi: 10.1002/(SICI)1521-3773(19981016)37:19<2647::AID-ANIE2647>3.0.CO;2-I.Reetz MT, Becker MH, Liebl M, Furstner A. Angew Chem, Int Ed. 2000;39:1236. doi: 10.1002/(sici)1521-3773(20000403)39:7<1236::aid-anie1236>3.0.co;2-j.Reetz MT, Hermes M, Becker MH. Appl Microbiol Biotechnol. 2001;55:531. doi: 10.1007/s002530100597.Millot N, Borman P, Anson MS, Campbell IB, Macdonald SJF, Mahmoudian M. Org Process Res Dev. 2002;6:463.
- 5.Liquid Crystals: Eelkema R, van Delden RA, Feringa BL. Angew Chem, Int Ed. 2004;43:5013. doi: 10.1002/anie.200460822.van Delden RA, Feringa BL. Chem Commun (Cambridge, U K) 2002:174. doi: 10.1039/b110721f.Van Delden RA, Feringa BL. Angew Chem, Int Ed. 2001;40:3198. doi: 10.1002/1521-3773(20010903)40:17<3198::AID-ANIE3198>3.0.CO;2-I.Walba DM, Eshdat L, Korblova E, Shao R, Clark NA. Angew Chem, Int Ed. 2007;46:1473. doi: 10.1002/anie.200603692.
- 6.Molecular Imprinted Polymers: Shimizu KD, Snapper ML, Hoveyda AH. Chem--Eur J. 1998;4:1885.
- 7.Enzymes/Antibodies: Abato P, Seto CT. J Am Chem Soc. 2001;123:9206. doi: 10.1021/ja016177q.Onaran MB, Seto CT. J Org Chem. 2003;68:8136. doi: 10.1021/jo035067u.Dey S, Karukurichi KR, Shen W, Berkowitz DB. J Am Chem Soc. 2005;127:8610. doi: 10.1021/ja052010b.
- 8.Johnson CR, Zeller JR. Tetrahedron. 1984;40:1225. [Google Scholar]
Associated Data
This section collects any data citations, data availability statements, or supplementary materials included in this article.


