

Abstract
The motivation of this study was to address the urgent clinical problem related to the inability of magnetic resonance (MR) imaging measures to differentiate tumor progression from treatment effects in patients with glioblastoma multiforme (GBM). While contrast enhancement on MR imaging (MRI) is routinely used for assessment of tumor burden, therapy response, and progression-free survival in GBM, it is well known that changes in enhancement following treatment are nonspecific to tumor. To address this issue, the objective of this study was to investigate whether MR spectroscopy can provide improved biomarker surrogates for tumor following treatment. High-resolution metabolic profiles of tissue samples obtained from patients with GBM were directly correlated with their pathological assessment to determine metabolic markers that correspond to pathological indications of tumor or treatment effects. Acquisition of tissue samples with image guidance enabled the association of ex vivo biochemical and pathological properties of the tissue samples with in vivo MR anatomical and structural properties derived from presurgical MR images. Using this approach, we found that metabolic concentration levels of [Myo-inositol/total choline (MCI)] in tissue samples are able to differentiate tumor from nontumor and treatment-induced reactive astrocytosis with high significance (P < .001) in newly diagnosed and recurrent GBM. The MCI index has a sensitivity of 93% to tumor in recurrent GBM and delineates the contribution of cellularity that originates from tumor and astrocytic proliferation following treatment. Low levels of MCI for tumor were associated with a reduced apparent diffusion coefficient and elevated choline-N-acetyl-aspartate index derived from in vivo MR images.
Keywords: GBM, MR spectroscopy, myo-inositol, treatment effect
Magnetic resonance imaging (MRI) is routinely used in the diagnosis, characterization, and clinical management of glioblastoma multiforme (GBM).1 Currently, contrast enhancement on standard anatomic MRI in conjunction with clinical evaluation is the key determinant of response to therapy and evaluation of tumor recurrence for GBM.2 Contrast enhancement on MRI is indicative of blood–brain barrier breakdown, which is associated with tumor growth. However, changes in contrast enhancement in patients who have received treatment is nonspecific to tumor since it could be the result of disruptions in the vasculature caused by radiation necrosis, surgical trauma, and antiangiogenic therapies that can result in a decrease in contrast enhancement. Strategies that rely on enhancement to evaluate therapy response or ascertain progression-free survival can therefore lead to erroneous interpretations. While pathology and immunochemistry of biopsies provide detailed molecular analysis for recurrence, they have not been able to predict clinical and imaging behaviors, likely due to tissue heterogeneity, sampling error, and inability to perform tissue samplings at the time of progression.3,4 As yet, there are no definitive imaging indications of treatment effects so that proliferation of reactive astrocytes in response to surgical trauma and various therapeutic modalities remains indistinguishable from tumor growth in standard MRI. Timely and accurate clinical decisions at recurrence can have a positive impact on patient prognosis and quality of life. However, making accurate assessments of tumor burden or treatment response is still a critical challenge for patients with brain tumors.
The morphological and physiological characteristics of the tumor are significantly altered with radiation treatment and molecular therapies that target the vascular properties of the tumor. MR spectroscopy (MRS) provides biochemical markers that are linked with biological pathways of structure and function. Spectroscopic findings from tissue samples were found to associate well with pathological characterization5 and genetic expression6 of tumor tissue, suggesting that valuable information related to tumor pathogenesis is encoded in metabolic profiles. Studies7 have shown that high-resolution magic angle spinning (HR-MAS) produces well-resolved spectra of cellular metabolites in intact tumor samples. Owing to the higher magnetic field strength (>11 Tesla) of HR-MAS systems, the sensitivity of this MRS technique is greatly enhanced, increasing the number of detectable metabolites that are present in low concentrations. The greater spectral resolution with increasing magnetic field strength also enhances the quantification precision.8
The objective of this study was to establish MRS markers with sensitivity to differentiate tumor from treatment effects by directly correlating the metabolic profiles with pathological assessment of tissue samples obtained from patients with GBM. The hypothesis was that increasing the number of detectable metabolites with HR-MAS and performing a direct association with pathological assessment of paired tissue samples would enhance the likelihood of finding MRS markers that are accurate surrogates for pathological indications of tumor or treatment effects. Our image-guided studies further extend this association by linking the ex vivo biochemical and pathological properties of the tissue samples with their in vivo MR anatomical and structural properties. Examining the biochemical, pathological, and imaging properties of the tumor region in a unifying study design is a unique and powerful approach and is anticipated to provide sensitive and accurate biomarkers to differentiate tumor progression from nontumor and treatment effects in GBM.
Materials and Methods
Towards achieving the objective of this study, the following approach was used: to develop metabolic markers with the potential to differentiate tumor from reactive astrocytosis, we first evaluated the differences in the MRS profile of tissue samples that were pathologically confirmed to have cellularity primarily from tumor or abundant astrocytosis without tumor. To study astrocytosis, tissue samples were obtained from surgeries of epilepsy patients since these are likely to display significant astrocytosis with various cellular densities without tumor. This is referred to as the nonimage-guided study in this study.
Next, the behavior of the HR-MAS markers determined in the nonimage-guided study to have the potential to differentiate tumor from reactive astrocytosis was investigated in correlative studies with HRMAS and pathological analysis of paired image-guided tissue samples acquired from tumor regions in patients with newly diagnosed and recurrent GBM. Finally, the anatomical and diffusion parameters from the region containing the biopsy location were obtained from presurgical MR images. These in vivo MR imaging parameters were associated with the HR-MAS and pathological parameters of the tissue sample to investigate the relationship of ex vivo measures with known in vivo MR imaging measures of tumor presence. These studies constitute the image-guided studies in this study.
NonImage-Guided Study
Ten tissue samples with confirmed pathological indications of tumor and epilepsy were investigated. The pathologist (S.R.V.) analyzed these samples to determine the extent of tumor or reactive astrocytosis. All tumor samples were confirmed to have greater than 75% tumor, with 6 samples indicating at least 90% tumor. All samples from patients with epilepsy had mild-to-moderate, diffuse-to-focal astrocytosis. These samples were obtained from the Tissue Bank and are independent from the dataset used in image-guided studies.
Image-Guided Study
Tissue samples (∼2 mm3) were obtained from tumor regions with image guidance from patients with newly diagnosed and recurrent GBM following surgery and treatment. Data from 48 tissue samples from 28 patients with newly diagnosed GBM and 52 samples from 29 patients with recurrent GBM are included in this analysis. Biopsy targets were chosen during presurgical planning based on their physiological, metabolic, and imaging characteristics to represent tumor.9 All samples were obtained after opening the dura and prior to or during tumor resection based on the location of the planned target. Some biopsy targets were unplanned and acquired from tumor regions at the discretion of the surgeon. Multiple tissue samples were obtained for some patients. In all of these cases, the location of the tissue acquisition was noted so that correlative ex vivo/in vivo imaging analyses could be performed. Samples were obtained during surgery with informed consent and approved by the Committee on Human Research. A biological use authorization was obtained prior to scanning these samples with HR-MAS at the NMR facility.
Association of HR-MAS Spectra with Pathology
Pathological analysis was performed on each image-guided tissue sample whose paired frozen tissue counterpart was used to collect ex vivo MRS data with HR-MAS. In addition to using the H&E stain to ascertain cellularity and the presence of tumor, the samples were stained with glial fibrillary acidic protein (GFAP: Dako #A0334) to assess the presence of astrocytic phenotypes. To determine the extent of reactive astrocytosis in each sample from recurrent GBM, an assessment of the relative contribution of reactive astrocytes and tumor cells to the overall cellularity of the sample was made based on a combination of the cytoarchitecture and immunohistochemistry for GFAP. This combination of parameters was essential, as both reactive astrocytes and tumor cells can express GFAP but with typically distinct cytoarchitectural features. Slides stained for H&E and GFAP were scored in a blinded fashion (J.J.P. and S.R.V.).
H&E stained slides for samples obtained from patients with newly diagnosed GBM were given a tumor cellularity score based on the density of the tumor cells. A score of 0 denoted neuropil without tumor, a score of 1 indicated an infiltrating tumor margin containing a detectable but not abundant number of tumor cells. A score of 2 denoted a more cellular infiltrated zone, and a score of 3 denoted a highly cellular tumor. For the analysis in this manuscript, samples with a tumor cellularity score of 0 or 1 were grouped together as nontumor and those with a score of 2 or 3 were grouped as tumor.
GFAP-immunostained slides obtained from patients with recurrent GBM were assigned 1 reactive astrocytosis score per slide based on the pattern and cytoarchitecture of GFAP immunostained cells. The score reflected the extent of reactive astrocytosis in the sample relative to tumor. A score of 0 denoted that reactive astrocytosis contributed an insignificant amount to the cells present; a score of 1 was used to denote that reactive astrocytosis contributed a minor component to the cellularity present. A score of 2 indicated that a major component of cellularity was due to reactive astrocytosis, and a score of 3 denoted that reactive astrocytosis contributed to most of the cellularity present. For the analysis in this manuscript, recurrent GBM samples with an astrocytosis score of 0 or 1 were considered to be tumor and those with a score of 2 or 3 were considered in the category of reactive astrycytosis.
Association of HR-MAS Spectrum with In Vivo MR Imaging Metrics
The BrainLab (Vector Vision) neuro-navigational system that was used to perform the image-guided surgery allowed the registration of the patient coordinate system with the presurgical imaging data. Using the coordinates of the location of tissue biopsy relative to MR imaging, it was possible to derive the anatomical, diffusion, and spectroscopic parameters for the tumor region containing biopsy site (Fig. 1). In some cases, the biopsy location of the acquired tissue sample was not within the in vivo MR spectroscopic imaging (MRSI) volume.
Fig. 1.

Association of HR-MAS spectrum with in vivo MR imaging metrics. Outline of the procedure for obtaining in vivo MR parameters corresponding to tissue sample locations for the image-guided study. BrainLab Software was used to obtain the coordinates of the sample location (circle) at the time of surgery for each individual patient. Since these locations were provided in imaging coordinates, it was possible to derive the corresponding anatomical, diffusion, and spectroscopy parameters at this location. There is a good association between parameters derived from the ex vivo and in vivo MR measures (shaded box). A clear correspondence was seen in the Cho levels between the ex vivo and in vivo studies, although given the poor resolution of 3 T MRS, the composition of elevated Cho as originating from a GPC is not clear. Please note that since the in vivo spectrum was acquired at a long TE = 144 ms, metabolites such as mI were not measured due to their short T2 relaxation times. Hence future studies will develop a short echo MR spectroscopic imaging acquisition to detect mI and evaluate MCI in clinical studies.
Data Acquisition and Analysis
High-Resolution Magic Angle Spinning
Samples were weighed and placed in custom designed 35-µL leak proof zirconium rotors. HR-MAS data were acquired at 11.7 T, 1°C, and 2250 Hz spin rate using a Varian INOVA spectrometer and a 4-mm gHX nanoprobe. Quantitative 1D spectra were acquired with the Carr-Purcell-Meiboom-Gill sequence; TR = 4 s; TE = 144 ms; 512 scans; 35-minute acquisition, 40 000 points, 20 000 Hz spectral width. The electronic reference to access in vivo concentrations (ERETIC)10 method was used as a quantification standard. Basis set spectra of 42 metabolites in solution were incorporated into a custom version of the QUEST11 fitting routine. Concentrations were calculated relative to the peak area of the ERETIC signal and were included in the final analysis only if the Cramer-Rao error estimate was within 10%.
In Vivo MR Imaging
The 1.5 and 3 T MR spectroscopic images were acquired over a 3D volume that covered as much of the tumor region as possible. The acquisition parameters were: TR/TE = 1104/144 ms, 1 cm3 nominal spatial resolution, 16 × 16 × 16 phase encoding matrix with flyback gradient12 trajectory in the superior–inferior direction to reduce the acquisition time to ∼9 minutes. Following postprocessing, data were voxel shifted so that the biopsy location was at the center of the spectroscopic voxel. In some cases, patients opted out of the MRSI scan. The choline (Cho) to N-acetyl-aspartate index (CNI) associated with the voxel containing the biopsy site was obtained using custom analysis procedures.13 Six directional diffusion weighted images14 were acquired with the EPI sequence: TR = 8000 ms, TE = 80 ms, matrix size = 256 × 256, and b = 1000 s/mm2 slice thickness = 5 mm. The apparent diffusion coefficient (ADC) was calculated on a pixel-by-pixel basis using software that was developed in house and was based on published algorithms.15 The ADC at the site from where the tissue was acquired was computed from a 5-mm spherical region of interest drawn at the biopsy location on the diffusion map. Normalized ADC (nADC) was obtained relative to the mode of the histogram from the whole-brain tissue mask that represents the median normal-appearing white matter (NAWM) values.
Statistical Analysis
The association between MRS markers and pathology assessment was evaluated using the unpaired Student's t-test assuming unequal variances. To account for inflation of Type I error due to assessments of multiple markers, a significance level of P < .01 was used to declare statistical significance. Data from the nonimage-guided study were used to develop ex vivo MRS concentration cutoffs for tumor and astrocytosis. A receiver operator characteristic (ROC) curve was constructed using these data with the STATA software to determine the optimal concentration cutoff associated with the highest correct classification rate. This cutoff was used in the image-guided study to derive the sensitivity of MRS markers to tumor. In general, we found significant variability in the metabolite concentrations as well as pathology scores for the different samples from an individual patient. As such, the samples were assumed to be independent observations in the analysis and no formal statistical technique was undertaken to adjust for patient effect.
Results
NonImage-Guided Study
Table 1 shows the HR-MAS spectroscopy metabolites that were most different between tumor and epilepsy samples. There is an increase in myo-inositol (mI), creatine (Cr), and NAA in epilepsy samples, representing astrocytosis relative to tumor samples. Alanine, glycine (Gly), and phosphatidylethanolamine (PE) were increased in tumor samples. The total Cho level, that is the sum of free Cho, glycerophosphocholine (GPC), and phosphocholine (PC), was not different between tumor (1.3 ± 0.7, μmol/kg) and epilepsy (0.8 ± 0.4) (μmol/kg) samples. Figure 2 illustrates a spectrum from a sample confirmed with pathology to have 100% tumor (black) and a sample with subpial astrocytosis (red). There is a notable elevation in mI in the latter case. In this study, several metabolic markers, alanine, Cr, Gly, mI, PE were found to be different between tumor and epilepsy, but these differences did not reach statistical significance in this data set. Reduced NAA in tumor samples is consistent with the pathological assessment of significant tumor presence in these samples and elevated NAA levels in epilepsy is due to the origin of these samples from white and gray matter regions. As such, the significant differences in NAA are reflective of the origin of these samples and not necessarily due to pathological differences between tumor and astrocytosis. The mI to total choline index [MCI = mI/(Choline + GPC + PC)] was found to differentiate between tumor and epilepsy with high significance (P < .001). Since epilepsy samples were confirmed to have significant astrocytosis and mI is a glia-specific marker,16 these studies indicate that MCI has the potential to differentiate between tumor and astrocytosis. A ROC curve generated with these data determined that an MCI cutoff of 2.6 corresponds to 100% sensitivity to tumor, with 94% of the samples correctly classified based on pathology. Hence, this cutoff was used as the MCI level for tumor in the image-guided analysis.
Table 1.
Comparison of HR-MAS markers between tumor and epilepsy samples
| Tumor [μmol/kg, mean (SD)] | Epilepsy [μmol/kg, mean (SD)] | t-test (P < .05) | |
|---|---|---|---|
| Alanine | 0.9 ± 0.6 | 0.5 | .01 |
| Cr | 0.9 ± 0.5 | 1.6 ± 0.7 | .01 |
| Gly | 1.7 ± 1.5 | 0.5 ± 0.1 | .04 |
| mI | 1.3 ± 0.8 | 3.0 ± 1.8 | .01 |
| PE | 1.2 ± 0.6 | 0.6 ± 0.2 | .03 |
| NAA | 0.1 ± 0.01 | 0.3 ± 0.1 | <.001 |
| MCI (mI/TCho) TCho = Cho + GPC + PC | 1.0 ± 0.6 | 3.8 ± 1.4 | <.001 |
Cr, creatine; Gly, glycine; mI, myo-inositol; PE, phosphatidylethanolamine; NAA, N-acetyl-aspartate; MCI, mI total choline index; GPC, glycerophosphocholine; PC, phosphocholine.
High-resolution magic angle spinning (HR-MAS) spectroscopic markers were found to be significantly different between tumor and epilepsy samples, with confirmed pathology indications of tumor and reactive astrocytosis, respectively. Ten tumor samples with >75% tumor (6 samples >90% tumor) and 10 samples from epilepsy patients with pathology indicating focal/diffuse, mild-to-moderate astrocytosis from white/gray/cortical regions were included in this nonimage-guided study. The MCI was found to be a singular marker that differentiated between these samples with high statistical significance (P < .001) and is a potential biomarker for differentiating tumor from astrocytosis.
Fig. 2.
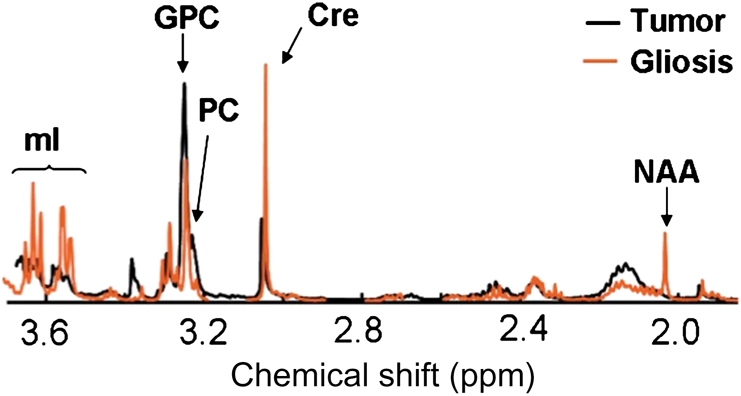
Comparison of tumor and gliosis/astrocytosis HR-MAS spectra. An ex vivo HR-MAS spectrum obtained from a tumor sample confirmed with pathology as 100% tumor (black) and a sample from epilepsy (red) confirmed to have prominent astrocytosis. Levels of mI are significantly higher in the epilepsy sample, representing astrocytosis.
Image-Guided Study
Association of MCI with Pathological Assessment
Figure 3 compares MCI with the H&E tumor cellularity scores for all samples from patients with newly diagnosed GBM. MCI levels in tumor samples (cellularity = 3) are significantly lower (P < .001) than nontumor samples (cellularity = 0 or 1). This is consistent with the nonimage-guided studies that demonstrated that lower MCI represents tumor. Figure 4 illustrates the MCI and astrocytosis score from 2 samples with increased cellularity in the H&E stain acquired from the same patient with recurrent GBM. Based on the nonimage-guided study, an MCI of 2.8 in (A) corresponds to the HR-MAS cutoff for reactive astrocytosis. This is consistent with an astrocytosis score of 3, signifying that the majority of tissue cellularity is attributable to reactive astrocytes rather than tumor. Conversely an MCI of 0.9 (B) corresponds to an HR-MAS cutoff for tumor and is consistent with an astrocytosis score of 0, signifying that the majority of tissue cellularity is from tumor. This indicates that levels of MCI are able to differentiate between cellularity that originates from reactive astrocytosis and tumor. Of the 29 recurrent tumor samples that had an astrocytosis score of 0 or 1, indicating primarily tumor, 27 samples had an MCI <2.6, suggestive of tumor. Using pathological assessment as a gold standard, this results in a sensitivity of MCI to tumor of 93%. Figure 5 compares the MCI with the astrocytosis score for all samples acquired from patients with recurrent GBM. There is a statistically significant (P < .001) difference in the MCI levels between samples with reactive astrocytosis scores for tumor (=0) and reactive astrocytosis (=3). As anticipated from our nonmage-guided study, tumor samples have a lower MCI relative to samples with a predominant astrocytic component. It was observed that mI or total Cho by itself was not different between these cases. Hence differences in MCI are driven by the relative concentration of mI and total Cho in each sample. Based on these studies, we conclude that levels of MCI can differentiate tumor from nontumor and treatment-induced reactive astrocytosis in GBM.
Fig. 3.

Comparison of MCI and H&E tumor cellularity scores for all samples from patients with newly diagnosed GBM. A statistically significant (P < 0.001) difference in MCI levels between tumor samples (cellularity = 3) and nontumor samples (cellularity = 0 or 1) is observed in samples from patients with newly diagnosed GBM. Levels of MCI measured with HR-MAS spectroscopy differentiate tumor from nonumor regions in newly diagnosed GBM. These findings are consistent with the nonimage-guided study in which tumor samples had lower MCI.
Fig. 4.

Comparison of MCI and astrocytosis score in a patient with recurrent GBM. High magnification digitized GFAP immunostained image of 2 samples from the same patient with recurrent GBM. Both samples demonstrated increased cellularity based on H&E scores. An MCI of 2.8 in (A) represents reactive astrocytosis and is consistent with an astrocytosis score (=3) signifying that reactive astrocytes (arrows) are a primary contributor to cellularity. Conversely, an MCI of 0.9 (B) for tumor is consistent with a region composed predominantly of tumor cells, as indicated by an astrocytosis score of 0. This illustrates that MCI has the potential to characterize the cellularity as originating from reactive astrocytosis or tumor in recurrent GBM.
Fig. 5.

Comparison of astrocytosis scores and MCI for all samples from patients with recurrent GBM. There is a statistically significant (P < .001) difference in MCI between tumor samples with an astrocytosis scores for tumor (=0) and astrocytosis (=3). As in the nonimage-guided study, low values of MCI are associated with tumor regions. Higher values of MCI represent reactive astrocytosis, which is a surrogate for treatment effect. These findings indicate that levels of [Myo-inositol/Total Choline] measured with MRS differentiate tumor from treatment effects in patients with recurrent GBM.
Association of MCI with In Vivo MR Imaging Metrics
There is a significant inverse (r = −0.60) relationship (Fig. 6A) between MCI derived from ex vivo HR-MAS spectrum of the tissue sample and CNI obtained from the in vivo MRSI voxel containing the location from where the tissue was acquired. Low levels of MCI are associated with elevated CNI, as measured with in vivo MRSI. A similar relationship was also found between the ratio of total Cho to NAA and MCI derived from the ex vivo HR-MAS spectrum for each sample. Figure 6B illustrates the significant (P < .001) positive (r = .52) relationship between MCI obtained from HR-MAS spectrum of the tissue sample and nADC derived from the region where the sample was acquired. These findings illustrate that levels of MCI for tumor derived from HR-MAS spectrum of the tissue sample are consistent with elevated CNI and reduced ADC, which have been shown to indicate tumor in in vivo MR imaging studies.17,18 Finally, tissue samples acquired from regions with increased contrast enhancement (nCE >1) in patients with newly diagnosed GBM had significantly lower MCI (Fig. 7), which is consistent with tumor presence within enhancing regions. This relationship was not found to be true for samples acquired from patients with recurrent GBM. This highlights the lack of association of contrast enhancement to tumor in recurrent GBM and the need for additional markers for tumor following surgery and treatment.
Fig. 6.

Comparison of the MCI with the in vivo MR imaging measures. (A) A significant (P < .001) inverse (r = .6) relationship was found between MCI derived from the HR-MAS of the tissue sample and the CNI obtained from the 3T in vivo MRS voxel containing the location from where the tissue was acquired. Low MCI for tumor is consistent with elevated CNI in these voxels. MCI is consistent with the increased presence of astrocytosis following treatment since there are more samples with elevated MCI in samples obtained from patients with recurrent GBM (solid circles) compared with patients with newly diagnosed GBM (open circles). (B) A significant (P < .001) correlation (r = .52) was found between nADC and MCI. Low values of ADC are associated with tumor, which is consistent with lower values of MCI for tumor in these regions. Elevated ADC is generally associated with edematous or nontumor regions, which is consistent with high MCI for nontumor in these regions.
Fig. 7.

Comparison of MCI with contrast enhancement. MCI was lower in regions with increased nCE in patients with newly diagnosed GBM. This is consistent with regions of contrast enhancement being associated with tumor in newly diagnosed GBM. This was not observed in samples acquired from patients with recurrent GBM. This suggests that enhancement is not an accurate surrogate for tumor presence following treatment, highlighting the need for new tumor markers in recurrent GBM.
Discussion
The motivation of this study was to address the urgent clinical problem related to the inability of MR imaging measures to differentiate tumor progression from treatment effects in patients with GBM. Contrast enhancement on anatomical MR imaging has proven to be an inadequate surrogate of tumor presence primarily because it has not been linked with biological mechanisms of tumor growth and response. Its lack of association with the pathogenic condition is worsened following treatment. Antiangiogenic and cytostatic therapies affect the morphological and physiological characteristics of the tumor that impact observable MR intensities, such as contrast enhancement, in complex ways that are as yet not well characterized or understood. Hence contrast enhancement following such therapies does not provide an accurate assessment of tumor burden or progression-free survival. The goal of this study was to investigate whether MRS can provide improved biomarker surrogates for tumor following treatment.
A tumor region is characterized by cellular proliferation due to rapidly dividing tumor cells. The MRS total Cho level has been associated with increased cell membrane turnover and shown to correlate with cellular density.19 Maximum Cho levels were shown to differentiate20 low- and high-grade brain tumors with proton MR spectroscopic imaging (1H-MRSI)15. Reactive astrocytosis is a normal cellular reaction to tumor growth and treatment. Reactive astrocytes, macrophages, and activated microglia populate regions adjacent to an aggressively infiltrating tumor mass and are commonly dispersed within the “reactive stroma” of a treated tumor. The presence of reactive astrocytosis may therefore be a biomarker surrogate for treatment effects and contribute significantly to cellularity following treatment. High concentrations of mI have been found in astrocytes and were related to activation of glial cells in vitro.16 Free intracellular mI is an osmolyte21 and during periods of osmotic stress, balance is preserved by regulation of mI transport across the plasma membrane.22 Many diseases that are characterized by astrocytic proliferation and demyelinization such as Alzheimer's disease23 and multiple sclerosis24 are associated with increases in mI. It has been argued25 that mI might be used as an indicator of response of normal tissue to tumor infiltration. Studies26 have shown a trend toward lower mI levels in anaplastic astrocytomas and GBMs compared with low-grade astrocytomas. Given these findings, it is anticipated that inclusion of mI would be important for developing a diagnostic tool for differentiating tumor from treatment effects in GBM.
The approach in this study was to use pathological assessment as a gold standard to confirm the presence of tumor or treatment effects and find metabolic markers that are consistent with this assessment. While studies have shown the potential of MRS measures as biomarkers for tumor pathogenesis, a correlative pathological assessment as in this study is important to validate the tumor biology represented by metabolic markers. Using epilepsy samples in the nonimage-guided study enabled the investigation to be focused primarily on observable metabolic differences likely to represent reactive astrocytosis and not confounded by tumor pathogenesis. Correlating MRS-pathological parameters in paired image-guided tissue samples enabled a direct association of biochemical and morphological assessment of tumor tissue. The nonimage-guided study provided an independent data set to derive MRS concentration cutoffs that represent tumor and reactive astrocytosis. The findings in this study were consistent with known biochemical mechanisms of tumor pathogenesis. MRS studies have demonstrated relationships between Cho, PC, GPC, Gly and tumor grade and biologic aggressiveness.27–29 Increase in alanine in tumor samples can be linked with its role in tumorigenesis in GBMs.30 Cho kinase activity has been implicated in the pathogenesis of several tumors and has a role in the transformation of normal to a malignant phenotype.31 Relative levels of PC and GPC enable discrimination of low and high-grade glioma.32 The Cho kinase enzymes are implicated in the synthesis of PE, which was shown to be elevated in transformed cells or tumor samples using31 MRS33. Cr are reflective of cellular energy metabolism and are decreased in tumor relative to normal tissue. While mI itself provides marginal differentiation between astrocytosis and tumor, constructing the ratio of mI with total Cho to generate MCI highlights this distinction because it normalizes the effect of astrocytosis by the total cellularity and represents the dominant contribution of a region that could have both tumor and astrocytosis. While the ability of mI to represent astrogliosis has been suggested in prior studies,25 to our knowledge this is first study to perform direct pathological-MRS correlative studies to demonstrate this relationship.
The MRS-pathological correlative studies in this manuscript are in excellent concurrence. Overall, the findings of the image-guided study are consistent with the nonimage-guided study and provide further confirmation of MCI levels to differentiate tumor from nontumor (Fig. 3) in newly diagnosed GBM and reactive astrocytosis (Fig. 5) in recurrent GBM. Figure 4 illustrates that MCI levels are able to characterize the increased cellularity in a recurrent tumor region as originating from reactive astrocytosis or tumor cells. Both the samples in Fig. 4 were acquired from the same recurrent GBM patient, and the diverse properties of the samples highlight the significant biological heterogeneity of the tumor region in these patients. MCI demonstrated high sensitivity (∼93%) for tumor in recurrent GBM, which is remarkable considering the small sample size, heterogeneity of GBM and treatments, and the fact that only a fraction of samples had scores for both pathology and MRS due to analysis thresholds for quality checks. The average MCI for nontumor or astrocytosis samples (Figs 3 and 5) was more than 2.5 times or greater than 2 standard deviations of the MCI for tumor samples in these analyses. This illustrates that the differentiation of tumor and nontumor using this index can be made with strong statistical significance and confidence for patients with GBM. In both image-guided and nonimage-guided data sets, total Cho levels were not found to differentiate between tumor and reactive astrocytosis. This supports our hypothesis that since both tumor and reactive astrocytic proliferation can result in increased cellularity they are indistinguishable by total Cho measurements that represent cell density. While the components that contribute to the Cho peak, that is, GPC or PC, may be different in tumor and astrocytosis due to low resolution of an in vivo MRSI spectrum at 1.5 and 3.0 T, only total Cho measurements can be made in clinical studies. Hence total Cho in in vivo MRSI may not be able to differentiate tumor from treatments effects. An inherently lower level of mI in GBMs compared with low-grade astrocytomas26,34 and an increased presence of reactive astrocytosis from normal brain processes following treatment further contribute to the sensitivity of MCI in GBM.
The concurrence of MCI to in vivo measures of tumor in the image-guided study further strengthened its role as a potential marker to differentiate tumor from nontumor and astrocytosis. MCI is consistent with the increased presence of astrocytosis following treatment since there are more samples with elevated MCI in samples obtained from patients with recurrent GBM (Fig. 6A: solid circles) compared with patients with newly diagnosed GBM (Fig. 6A: open circles). Regions with relatively high ADC are generally associated with edema or nontumor and are consistent with elevated MCI, representing astrocytosis in these regions (Fig. 6B). Despite the strong correlation between CNI and MCI (Fig. 6A), it is noted that MCI provides an independent characterization of the tumor region. As constructed, CNI in an in vivo spectrum is driven by the extent of neuro-axonal loss (NAA) in a tumor region. In regions of extensive neuro-axonal loss due to tumor growth and significant production of GPC and PC by viable tumor cells that contribute to total Cho, CNI is a strong indicator of tumor presence, and these regions will also have a low MCI. However, in regions that have moderate presence of NAA such as residual tumor regions following treatment, MCI is able to differentiate residual tumor from reactive astrocytosis. Since residual tumor regions are of primary interest in evaluating tumor progression or progression-free survival, the ability of MCI to differentiate these regions will be important for the evaluation of therapy response. These findings also suggest that biochemical properties measured with MRS maintain their sensitivity to tumor metabolism following targeted and focal therapies and provide improved surrogates for tumor presence following treatment.
Since the in vivo MR spectroscopic measure of CNI has been used to locate tumor regions in GBM,17 during the course of the analyses a direct comparison of the ability of MCI and CNI in the same tumor sample to predict pathological assessment was attempted. However, a significant proportion of the samples did not have any NAA, which was consistent with image-guided tissue acquisition primarily from tumor regions guided by anatomic, diffusion, perfusion and spectroscopic imaging definitions of tumor presence. Hence, it was difficult to compare the relative abilities of CNI and MCI in predicting tumor from treatment effects in GBM. Future short-echo MR spectroscopic imaging studies will provide mI, NAA, and Cho. This will allow a prospective evaluation of tissue samples acquired from regions of presumed tumor and reactive astrocytosis based on CNI and MCI and enable a direct comparison of these indices in predicting these pathological states. Figure 7 illustrates that MCI follows the anticipated relationship with contrast enhancement in newly diagnosed GBM. Low MCI for tumor is associated with increased enhancement and elevated MCI for nontumor is found in samples originating in regions with decreased enhancement. However, this relationship between MCI and contrast enhancement is not found in samples from recurrent GBM. For untreated newly diagnosed GBM, contrast enhancement is a fairly good indicator of tumor presence since it is the result of disruption of the blood–brain barrier from tumor growth. Hence low MCI for tumor correlates well with increased contrast enhancement in newly diagnosed GBM. Patients with recurrent GBM have undergone surgery, radiation, and/or antiangiogenic therapies. Posttreatment enhancement in these patients can result from disruption of vasculature from these treatments and not exclusively from tumor presence.35 This results in a weaker relationship of MCI with contrast enhancement in recurrent GBM and highlights the need for alternative surrogates for tumor presence following treatment.
The potential for making an in vivo measurement of the MCI enhances the clinical relevance of this index. Robust measurements of mI36 in association with other metabolites, such as Cho, Cr, and NAA, can be made at 3 T with short-echo MR spectroscopic imaging (MRSI). This MRSI acquisition can be integrated in clinical research MR protocols for patients with GBM undergoing treatment to enable a prospective evaluation of MCI in an independent image-guided data set. The ability to provide a noninvasive, accurate tumor classification, particularly for recurrent GBM without having to perform tissue acquisition and pathological analysis is very powerful for clinical diagnoses and evaluation of disease progression in longitudinal studies. Optimizing the in vivo acquisition of MCI, prospective evaluation of MCI, and correlation of in vivo MCI to clinical outcome to ascertain the prognostic value and biological relevance of this MR spectroscopic index will be investigated in future studies.
Conclusions
Using ex vivo spectroscopy of tissue samples in association with pathological analysis and in vivo MR imaging measures, we have demonstrated the ability of an MR spectroscopic index to differentiate tumor from nontumor and treatment effects in GBM. The findings of this study have shown that low levels of MCI are a reliable indicator of a proliferating tumor region, and elevated MCI represents nontumor or treatment-induced reactive astrocytosis. The availability of an MR diagnostic tool for tumor assessment following treatment for patients with recurrent GBM will have a significant impact in making accurate clinical care decisions for patient management and evaluation of response in clinical trials of new therapies.
Conflict of interest statement. None declared.
Funding
National Insitute of Health: (RO1 CA127 612, PO1 CA11 816-01A2), UCSF Research Evaluation and Allocation Committee (Pilot award to R.S).
Acknowledgments
The author (R.S.) would like to thank Jason C. Crane for help with analysis procedures and Cynthia Cowdrey for assistance with tissue sample collection and preparation for pathological analysis.
References
- 1.Henson JW, Gaviani P, Gonzalez RG. MRI in treatment of adult gliomas. Lancet Oncol. 2005;6:167–175. doi: 10.1016/S1470-2045(05)01767-5. doi:10.1016/S1470-2045(05)01767-5. [DOI] [PubMed] [Google Scholar]
- 2.Macdonald DR, Cascino TL, Schold SC, Jr, Cairncross JG. Response criteria for phase II studies of supratentorial malignant glioma. J Clin Oncol. 1990;8:1277–1280. doi: 10.1200/JCO.1990.8.7.1277. [DOI] [PubMed] [Google Scholar]
- 3.Rees JH, Smirniotopoulos JG, Jones RV, Wong K. Glioblastoma multiforme: radiologic-pathologic correlation. Radiographics. 1996;16:1413–1438. doi: 10.1148/radiographics.16.6.8946545. quiz 1462–1413. [DOI] [PubMed] [Google Scholar]
- 4.Tihan T, Barletta J, Parney I, Lamborn K, Sneed PK, Chang S. Prognostic value of detecting recurrent glioblastoma multiforme in surgical specimens from patients after radiotherapy: should pathology evaluation alter treatment decisions? Hum Pathol. 2006;37:272–282. doi: 10.1016/j.humpath.2005.11.010. doi:10.1016/j.humpath.2005.11.010. [DOI] [PubMed] [Google Scholar]
- 5.Cheng LL, Chang IW, Louis DN, Gonzalez RG. Correlation of high-resolution magic angle spinning proton magnetic resonance spectroscopy with histopathology of intact human brain tumor specimens. Cancer Res. 1998;58:1825–1832. [PubMed] [Google Scholar]
- 6.Righi V, Roda JM, Paz J, Mucci A, Tugnoli V, Rodriguez-Tarduchy G, et al. 1H HR-MAS and genomic analysis of human tumor biopsies discriminate between high and low grade astrocytomas. NMR Biomed. 2009;22:629–637. doi: 10.1002/nbm.1377. doi:10.1002/nbm.1377. [DOI] [PubMed] [Google Scholar]
- 7.Cheng LL, Ma MJ, Becerra L, Ptak T, Tracey I, Lackner A, et al. Quantitative neuropathology by high resolution magic angle spinning proton magnetic resonance spectroscopy. Proc Natl Acad Sci USA. 1997;94:6408–6413. doi: 10.1073/pnas.94.12.6408. doi:10.1073/pnas.94.12.6408. [DOI] [PMC free article] [PubMed] [Google Scholar]
- 8.Tkac I, Oz G, Adriany G, Ugurbil K, Gruetter R. In vivo 1H NMR spectroscopy of the human brain at high magnetic fields: metabolite quantification at 4T vs. 7T. Magn Reson Med. 2009;62:868–879. doi: 10.1002/mrm.22086. doi:10.1002/mrm.22086. [DOI] [PMC free article] [PubMed] [Google Scholar]
- 9.Crawford FW, Khayal IS, McGue C, Saraswathy S, Pirzkall A, Cha S, et al. Relationship of pre-surgery metabolic and physiological MR imaging parameters to survival for patients with untreated GBM. J Neurooncol. 2009;91:337–351. doi: 10.1007/s11060-008-9719-x. doi:10.1007/s11060-008-9719-x. [DOI] [PMC free article] [PubMed] [Google Scholar]
- 10.Ziarelli F, Caldarelli S. Solid-state NMR as an analytical tool: quantitative aspects. Solid State Nucl Magn Reson. 2006;29:214–218. doi: 10.1016/j.ssnmr.2005.08.013. doi:10.1016/j.ssnmr.2005.08.013. [DOI] [PubMed] [Google Scholar]
- 11.Ratiney H, Sdika M, Coenradie Y, Cavassila S, van Ormondt D, Graveron-Demilly D. Time-domain semi-parametric estimation based on a metabolite basis set. NMR Biomed. 2005;18:1–13. doi: 10.1002/nbm.895. doi:10.1002/nbm.895. [DOI] [PubMed] [Google Scholar]
- 12.Chen AP, Cunningham CH, Ozturk-Isik E, Xu D, Hurd RE, Kelley DA, et al. High-speed 3T MR spectroscopic imaging of prostate with flyback echo-planar encoding. J Magn Reson Imaging. 2007;25:1288–1292. doi: 10.1002/jmri.20916. doi:10.1002/jmri.20916. [DOI] [PubMed] [Google Scholar]
- 13.Nelson SJ. Analysis of volume MRI and MR spectroscopic imaging data for the evaluation of patients with brain tumors. Magn Reson Med. 2001;46:228–239. doi: 10.1002/mrm.1183. doi:10.1002/mrm.1183. [DOI] [PubMed] [Google Scholar]
- 14.Khayal IS, Crawford FW, Saraswathy S, Lamborn KR, Chang SM, Cha S, et al. Relationship between choline and apparent diffusion coefficient in patients with gliomas. J Magn Reson Imaging. 2008;27:718–725. doi: 10.1002/jmri.21288. doi:10.1002/jmri.21288. [DOI] [PMC free article] [PubMed] [Google Scholar]
- 15.Basser PJ, Pierpaoli C. Microstructural and physiological features of tissues elucidated by quantitative-diffusion-tensor MRI. J Magn Reson B. 1996;111:209–219. doi: 10.1006/jmrb.1996.0086. doi:10.1006/jmrb.1996.0086. [DOI] [PubMed] [Google Scholar]
- 16.Brand A, Richter-Landsberg C, Leibfritz D. Multinuclear NMR studies on the energy metabolism of glial and neuronal cells. Dev Neurosci. 1993;15:289–298. doi: 10.1159/000111347. doi:10.1159/000111347. [DOI] [PubMed] [Google Scholar]
- 17.McKnight TR, von dem Bussche MH, Vigneron DB, Lu Y, Berger MS, McDermott MW, et al. Histopathological validation of a three-dimensional magnetic resonance spectroscopy index as a predictor of tumor presence. J Neurosurg. 2002;97:794–802. doi: 10.3171/jns.2002.97.4.0794. [DOI] [PubMed] [Google Scholar]
- 18.Pope WB, Kim HJ, Huo J, Alger J, Brown MS, Gjertson D, et al. Recurrent glioblastoma multiforme: ADC histogram analysis predicts response to bevacizumab treatment. Radiology. 2009;252:182–189. doi: 10.1148/radiol.2521081534. doi:10.1148/radiol.2521081534. [DOI] [PubMed] [Google Scholar]
- 19.Gupta RK, Cloughesy TF, Sinha U, Garakian J, Lazareff J, Rubino G, et al. Relationships between choline magnetic resonance spectroscopy, apparent diffusion coefficient and quantitative histopathology in human glioma. J Neurooncol. 2000;50:215–226. doi: 10.1023/a:1006431120031. doi:10.1023/A:1006431120031. [DOI] [PubMed] [Google Scholar]
- 20.Senft C, Hattingen E, Pilatus U, Franz K, Schanzer A, Lanfermann H, et al. Diagnostic value of proton magnetic resonance spectroscopy in the noninvasive grading of solid gliomas: comparison of maximum and mean choline values. Neurosurgery. 2009;65:908–913. doi: 10.1227/01.NEU.0000356982.82378.BA. discussion 913 doi:10.1227/01.NEU.0000356982.82378.BA. [DOI] [PubMed] [Google Scholar]
- 21.Thurston JH, Sherman WR, Hauhart RE, Kloepper RF. Myo-inositol: a newly identified nonnitrogenous osmoregulatory molecule in mammalian brain. Pediatr Res. 1989;26:482–485. doi: 10.1203/00006450-198911000-00024. doi:10.1203/00006450-198911000-00024. [DOI] [PubMed] [Google Scholar]
- 22.Strange K, Emma F, Paredes A, Morrison R. Osmoregulatory changes in myo-inositol content and Na+/myo-inositol cotransport in rat cortical astrocytes. Glia. 1994;12:35–43. doi: 10.1002/glia.440120105. doi:10.1002/glia.440120105. [DOI] [PubMed] [Google Scholar]
- 23.Kantarci K, Knopman DS, Dickson DW, Parisi JE, Whitwell JL, Weigand SD, et al. Alzheimer disease: postmortem neuropathologic correlates of antemortem 1H MR spectroscopy metabolite measurements. Radiology. 2008;248:210–220. doi: 10.1148/radiol.2481071590. doi:10.1148/radiol.2481071590. [DOI] [PMC free article] [PubMed] [Google Scholar]
- 24.Fernando KT, McLean MA, Chard DT, MacManus DG, Dalton CM, Miszkiel KA, et al. Elevated white matter myo-inositol in clinically isolated syndromes suggestive of multiple sclerosis. Brain. 2004;127:1361–1369. doi: 10.1093/brain/awh153. doi:10.1093/brain/awh153. [DOI] [PubMed] [Google Scholar]
- 25.Hattingen E, Raab P, Franz K, Zanella FE, Lanfermann H, Pilatus U. Myo-inositol: a marker of reactive astrogliosis in glial tumors? NMR Biomed. 2008;21:233–241. doi: 10.1002/nbm.1186. doi:10.1002/nbm.1186. [DOI] [PubMed] [Google Scholar]
- 26.Castillo M, Smith JK, Kwock L. Correlation of myo-inositol levels and grading of cerebral astrocytomas. AJNR Am J Neuroradiol. 2000;21:1645–1649. [PMC free article] [PubMed] [Google Scholar]
- 27.Kinoshita Y, Yokota A. Absolute concentrations of metabolites in human brain tumors using in vitro proton magnetic resonance spectroscopy. NMR Biomed. 1997;10:2–12. doi: 10.1002/(sici)1099-1492(199701)10:1<2::aid-nbm442>3.0.co;2-n. doi:10.1002/(SICI)1099-1492(199701)10:1<2::AID-NBM442>3.0.CO;2-N. [DOI] [PubMed] [Google Scholar]
- 28.Lehnhardt FG, Bock C, Rohn G, Ernestus RI, Hoehn M. Metabolic differences between primary and recurrent human brain tumors: a 1H NMR spectroscopic investigation. NMR Biomed. 2005;18:371–382. doi: 10.1002/nbm.968. doi:10.1002/nbm.968. [DOI] [PubMed] [Google Scholar]
- 29.Righi V, Andronesi OC, Mintzopoulos D, Black PM, Tzika AA. High-resolution magic angle spinning magnetic resonance spectroscopy detects glycine as a biomarker in brain tumors. Int J Oncol. 36:301–306. doi: 10.3892/ijo_00000500. [DOI] [PMC free article] [PubMed] [Google Scholar]
- 30.Micallef J, Taccone M, Mukherjee J, Croul S, Busby J, Moran MF, et al. Epidermal growth factor receptor variant III-induced glioma invasion is mediated through myristoylated alanine-rich protein kinase C substrate overexpression. Cancer Res. 2009;69:7548–7556. doi: 10.1158/0008-5472.CAN-08-4783. doi:10.1158/0008-5472.CAN-08-4783. [DOI] [PubMed] [Google Scholar]
- 31.Lacal JC. Choline kinase: a novel target for antitumor drugs. IDrugs. 2001;4:419–426. [PubMed] [Google Scholar]
- 32.Sabatier J, Gilard V, Malet-Martino M, Ranjeva JP, Terral C, Breil S, et al. Characterization of choline compounds with in vitro 1H magnetic resonance spectroscopy for the discrimination of primary brain tumors. Invest Radiol. 1999;34:230–235. doi: 10.1097/00004424-199903000-00013. doi:10.1097/00004424-199903000-00013. [DOI] [PubMed] [Google Scholar]
- 33.Bell JD, Bhakoo KK. Metabolic changes underlying 31P MR spectral alterations in human hepatic tumours. NMR Biomed. 1998;11:354–359. doi: 10.1002/(sici)1099-1492(1998110)11:7<354::aid-nbm515>3.0.co;2-n. doi:10.1002/(SICI)1099-1492(1998110)11:7<354::AID-NBM515>3.0.CO;2-N. [DOI] [PubMed] [Google Scholar]
- 34.Londono A, Castillo M, Armao D, Kwock L, Suzuki K. Unusual MR spectroscopic imaging pattern of an astrocytoma: lack of elevated choline and high myo-inositol and glycine levels. AJNR Am J Neuroradiol. 2003;24:942–945. [PMC free article] [PubMed] [Google Scholar]
- 35.van den Bent MJ, Vogelbaum MA, Wen PY, Macdonald DR, Chang SM. End point assessment in gliomas: novel treatments limit usefulness of classical Macdonald's Criteria. J Clin Oncol. 2009;27:2905–2908. doi: 10.1200/JCO.2009.22.4998. doi:10.1200/JCO.2009.22.4998. [DOI] [PMC free article] [PubMed] [Google Scholar]
- 36.Srinivasan R, Vigneron D, Sailasuta N, Hurd R, Nelson S. A comparative study of myo-inositol quantification using LCmodel at 1.5 T and 3.0 T with 3 D 1H proton spectroscopic imaging of the human brain. Magn Reson Imaging. 2004;22:523–528. doi: 10.1016/j.mri.2004.01.028. doi:10.1016/j.mri.2004.01.028. [DOI] [PubMed] [Google Scholar]