

Abstract
We assessed the long-term renal complications in a regional cohort of extremely low birth weight (ELBW) children born in 2002–2004. The study group, comprising 78 children born as ELBW infants (88% of the available cohort), was evaluated with measurement of serum cystatin C, urinary albumin excretion, renal ultrasound, and 24-h ambulatory blood pressure measurements. The control group included 38 children born full-term selected from one general practice in the district. Study patients were evaluated at a mean age of 6.7 years, and had a median birthweight of 890 g (25th–75th percentile: 760–950 g) and a median gestational age of 27 weeks (25th–75th percentile: 26–29 weeks). Mean serum cystatin C levels were significantly higher (0.64 vs. 0.59 mg/l; p = 0.01) in the ELBW group. Hypertension was diagnosed in 8/78 ELBW and 2/38 of the control children (p = 0.5). Microalbuminuria (>20 mg/g of creatinine) was detected only in five ELBW children (p = 0.17). The mean renal volume was significantly lower in the ELBW group (absolute kidney volume 81 ml vs. 113 ml; p < 0.001, relative kidney volume 85 vs. 97%; p < 0.001). Abnormally small kidneys (<2/3 of predicted size) were detected in 19 ELBW and four control children (p = 0.08). Multivariate logistic regression revealed that the only independent risk factor for renal complications was weight gained during neonatal hospitalization (odds ratio: 0.67; 95% confidence interval: 0.39–0.94). Serum cystatin C and kidney volume are significantly lower in school-age ELBW children. It is important to include systematic renal evaluation in the follow-up programs of ELBW infants.
Keywords: Preterm, ELBW, Microalbuminuria, Cystatin C, Blood pressure, ABPM, Renal ultrasound, Kidney volume
Introduction
Advances in perinatal and neonatal care over the last 30 years have contributed to improved survival among extremely low birth weight infants (ELBW), who are defined as weighing less than 1,000 g at birth [1]. However, acute complications during the perinatal period may be followed by long-term physical or mental sequelae [2–4]. There are numerous studies assessing the future neurological development of pre-term infants, but studies that focus on long-term kidney complications are rare. An association is suggested between birth weight and renal size, number of nephrons, systolic blood pressure, and albuminuria. Since nephrogenesis continues until 36 weeks of gestation, very preterm neonates (gestational age <32 weeks) are likely to show a nephron deficit at birth. In Rodriguez et al. [5], an autopsy study of premature infants (gestational age <28 weeks) of extremely low birth weight (≤1,000 g) showed markedly decreased radial glomerular counts compared to mature infants. Glomerulogenesis continued until 40 days of age but did not reach the level of mature infants. Preterm birth is also associated with limited postnatal kidney growth until the age of 24 months [6, 7]. Postnatal anatomical and physiological renal maturation may be impaired by e.g., poor nutrition, clinical complications such as nephrocalcinosis, or nephrotoxic medications [8].
The aim of the present investigation was to determine clinical and functional renal parameters in school-age children weighing less than 1,000 g at birth and to assess the influence of ELBW on kidney function. We compared selected laboratory tests, ultrasound evaluation, and blood pressure monitoring measurements between 6 to 7-year-old ELBW and age-matched control full-term children. Our hypothesis was that very preterm infants may have postnatal impaired nephrogenesis that is detectable by abnormalities in renal function in childhood. To our knowledge, this is one of the few long-term observational studies examining the renal outcome of such immature infants.
Materials
A cross-sectional observational study was conducted in the Follow-up Pediatric Department of the Polish-American Children’s Hospital between August 1, 2009 and October 31, 2010.
From 1 September, 2002, to 31 August, 2004, 169 newborns with birth weights ranging from 500 to 1,000 g were born alive in the southeast district of Poland (Małopolska region). All children were hospitalized in three tertiary care Neonatal Intensive Care Unit (NICU) referral centers in southeast Poland. Ninety-one infants were discharged home from NICUs. All those who were alive at the age of 6–7 years were invited to participate in the follow-up study (n = 89). Neonatal data used for the study was recorded during their stay in an NICU daily in a prospective manner and stored in computer databases. For the purpose of the study, the following data was extracted from the original databases: sex, birthweight, gestational age, intrauterine growth, Apgar score, incidence of preeclampsia, preterm rupture of membranes, chorioamnionitis, the presence of respiratory distress syndrome (RDS), the need for mechanical ventilation, surfactant administration, the use of ibuprofen for patent ductus arteriosus (PDA), PDA ligation, early and late-onset septic episodes, treatment with aminoglycosides or vancomycin, the prevalence of intraventricular hemorrhage (IVH), periventricular leukomalacia (PVL), bronchopulmonary dysplasia (BPD)—defined as at least 28 days of oxygen therapy and also defined as oxygen therapy at 36 weeks post menstrual age (PMA), weight gain during NICU stay, the length of hospitalization and the results of neonatal renal ultrasound. Additionally, all charts were manually reviewed to detect neonatal episodes of oliguria and anuria. The control group included age-matched children from one general practice (GP) office and the study was approved by the Ethical Committee for Clinical Investigations of Collegium Medicum, Jagiellonian University.
Methods
After signing of the informed consent by the parents, serum cystatin C, microalbuminuria, renal ultrasound, and 24-h ambulatory blood pressure measurements (ABPM) were performed in all of the children. All parents were asked to complete a questionnaire assessing the possibility of urinary tract infections during infancy.
Serum cystatin C
Cystatin C was measured by a particle-enhanced immunonephelometric assay (N Latex cystatin C, Dade Behring) using a nephelometer (BN-II, Dade Behring, Marburg, Germany). The normal value for children between 4 and 10 years of age was defined as 0.53–0.95 mg/l
Urinary albumin excretion
Twelve-hour pooled urine samples were used to assess urinary albumin and creatinine. The concentration of albumin was measured by a radioimmunological competition assay (ImmunoTech, Prague, Czech Republic). Urinary creatinine was estimated by the dry chemistry method with Vitros 5.1.FF machine (Ortho-Clinical Diagnostics, Rochester, NY, USA). Total daily albumin excretion was calculated as the ratio of urinary albumin (mg/l) to urinary creatinine (mg/dl) (ACR). Microalbuminuria was defined as an ACR >20 mg/g.
24-h ambulatory blood pressure measurements
ABPM was performed using a SPACELABS 90207 device with a cuff the same size as the one used to measure casual blood pressure and following the technique described by the American Heart Association Council on High Blood Pressure Research [9]. The device was programmed to obtain blood pressure (BP) readings every 20 min from 7:00 AM to 9:00 PM and every 30 min from 9:00 PM to 7:00 AM. Recordings with at least 80% valid readings and at least one reading every hour were considered for the analysis.
Sleep and wake periods were defined on the basis of a diary completed by the child’s parents/guardians.
The following parameters were analyzed: mean 24-h systolic, diastolic, and mean arterial pressure (MAP), mean day-time systolic, diastolic, and MAP, mean night-time systolic, diastolic, and MAP. Original data was converted to SD scores (z-scores).
Hypertension was diagnosed if at least one variable was above the 95th percentile, according to reference values published by Wühl et al. [10]
Moreover, BP load was calculated separately for the awake and asleep periods. BP load was defined as the percentage of valid ambulatory BP measures above a set threshold value. The BP load was calculated with relation to the threshold values indicated by the 95th percentiles for SBP and DBP for sexes and the height percentile following the values published in The Fourth Report on the Diagnosis, Evaluation, and Treatment of High Blood Pressure in Children and Adolescents [11]. Loads in excess of 30% were considered elevated. Loads in excess of 50% were considered severely elevated.
Nocturnal dipping was calculated using the following formula: [mean daytime ABPM–mean nighttime ABPM]/mean day ABPM × 100. Normal dipping was defined as a ≥ 10% decline.
Renal ultrasound
Sonography was performed with a Philips Envisor HD, a color Doppler machine, with a C2-5 MHz probe. For each child examined, kidney length and width were calculated as the average of three measurements. Renal measurements were performed with children in the supine position, scanning in the para-coronal view with the transducer positioned to obtain the longest kidney dimension. Kidney volume was calculated using the formula: (kidney length × kidney width × kidney thickness) × Pi/6.
Relative kidney length and volume measurements were obtained by calculation of the ratio of actual to mean reference renal measurements. The reference values of kidney length and volume were calculated with the use of formulas provided by Dinkel et al. [12]. Renal length was adjusted for the patient’s height, and renal volume was adjusted for the patient’s weight. The formulas used for the predicted renal volume calculation were as follows:
-
(A)
Left kidney volume = 4.214 × body weight0.823
-
(B)
Right kidney volume = 4.456 × body weight0.795
The formula used for relative kidney volume calculation was as follows:
-
(C)
Relative kidney volume = (kidney volume measured by ultrasound/predicted kidney volume) × 100%
Low renal volume was diagnosed if volume was below two-thirds of the predicted value [13].
Outcome variables
The presence of renal complications was regarded as the primary outcome variable. Renal complications were diagnosed if at least two of the following abnormalities were detected: (1) abnormal serum cystatin C level, (2) microalbuminuria, (3) hypertension, (4) and low renal volume. Secondary outcome variables included: serum cystatin C level, urinary albumin/creatinine ratio, 24-h day-time and night-time systolic BP (SBP), diastolic (DBP) and mean arterial pressure (MAP), absolute and relative kidney volume.
Statistical analysis
Limited data exist regarding renal complication frequencies in preterm populations. Sample size estimations were based on the following assumptions: (a) the follow-up rate would be as high as 90% (80 ELBW children), and (b) the frequency of renal problems in an unselected group of 40 healthy children was 5%. Estimation specified an 80% chance of detecting 8% difference (with probability of type I error (two-sided) alpha = 0.05). The sample size calculation was performed using PS Power and Sample Size Calculations software (Version 2.1.30, February 2003, https://doi.org/www.mc.vanderbilt.edu/prevmed/ps/index.htm) [14].
The comparison between the groups utilized Student’s t test, the Mann–Whitney U test, Chi-square test or Fisher’s exact test, as appropriate. Next, different factors associated with renal problems in univariate analyses were entered as covariates for the logistic regression analysis. Logistic regression was used to estimate odds ratios for renal problems among former ELBW infants.
Data was analyzed using SAS Software (2006 by SAS Institute Inc., Cary, NC, USA).
Results
Seventy-eight children born as ELBW infants (88% of available cohort) with a median birthweight of 890 g (25th–75th percentile: 760–950) and the median gestational age 27 weeks (25th–75th percentile: 26–29) were evaluated at the mean age 6.7 years. The characteristic of the ELBW group is presented in Table 1. The control group included 38 full-term children. The comparison of selected demographic variables is shown in Table 2. The groups were similar with respect to age and gender. The ELBW children were significantly smaller and weighed less than the control group. None of the neonatal ultrasounds was positive for congenital renal and urinary tract malformations. None of the parent’s questionnaire revealed serious urinary tract infections during infancy.
Table 1.
Baseline characteristics of extremely low birth weight (ELBW) participantsa
| Birth weight, median (25th–75th percentile) | 890 g (760–950) |
|---|---|
| Gestational age, median (25th–75th percentile) | 27 weeks (26–29) |
| 5-min Apgar score, median; (25th–75th percentile) | 6 (5–7) |
| Prenatal steroids | 31 (47) |
| Mechanical ventilation | 77 (91) |
| Surfactant administration | 57 (73) |
| PDA ligation | 21 (27) |
| Intraventricular hemorrhage grade III–IV | 8 (10.2) |
| Oxygen at 36 weeks postmenstrual age | 30 (38) |
| Postnatal steroids | 36 (46) |
| Confirmed sepsis | 16 (20.5) |
| Weight gain during NICU stay (g/week), mean (SD) | 146 (102) |
| Length of hospitalization, median (25th–75th percentile) | 77 (55–103) |
aExpressed as a number (percentage) of patients unless otherwise indicated; PDA patent ductus arteriosus; NICU neonatal intensive care unit
Table 2.
Comparison of selected demographic and clinical variables between ELBW newborns and the control groupa
| ELBW group (n = 78) | Control group (n = 38) | p value | |
|---|---|---|---|
| Birth weight, median (25th–75th percentile) | 890 (760–950) | 3,545 (3,409–3,820) | <0.001b |
| Gestational age, median (25th–75th percentile) | 27 (26–29) | 40 (39–41) | <0.001b |
| Female | 51 (65) | 19 (50) | 0.15c |
| Vaginal delivery | 16 (20) | 34 (89) | <0.001c |
| Multiple pregnancy | 10 (13) | 0 (0) | <0.001c |
| Small for gestational age | 22 (28) | 2 (5) | 0.003c |
| 5 min Apgar score, median; (25th–75th percentile) | 6 (4–7) | 10 (9–10) | <0.001b |
| Age at evaluation (years), median (25th–75th percentile) | 6.7 (6.4–6.9) | 6.9 (6.3–7.3) | 0.1b |
| Height (cm), mean (SD) | 115 (7.9) | 125 (7.2) | <0.001d |
| Height z-score, mean (SD) | –1.06 (1.4) | 0.28 (0.9) | <0.001d |
| Weight (kg), mean (SD) | 19.6 (4.7) | 25.1 (5.3) | <0.001d |
| Weight z-score, mean (SD) | –0.97 (1.05) | 0.09 (1.15) | <0.001d |
aExpressed as a number (percentage) of patients unless otherwise indicated; p value for Mann–Whitney U testb, Fisher’s exact testc, and Student’s t testd; ELBW extremely low birth weight
Mean serum cystatin C levels were significantly higher (0.64 vs. 0.59 mg/l; p = 0.01) in the ELBW group. However, cystatin C levels in all assessed children were within the normal range.
Microalbuminuria was detected only in 5/78 ELBW children and 0/38 control children (p = 0.17). Hypertension was diagnosed in 8/78 ELBW and 2/38 control children (p = 0.5).
The mean renal volume was significantly lower in the ELBW group (absolute left kidney volume 40 +/−10 ml vs. 57 +/− 15 ml; p<0.001, absolute right kidney volume 41 +/− 11 ml vs. 56 +/− 15 ml; p < 0.001, relative left kidney volume: 85% +/− 19 vs. 95% +/− 18 p = 0.01, relative right kidney volume: 86% +/− 17 vs. 99% +/− 16 p < 0.001). Abnormally small kidneys (<2/3 of predicted size) were detected in 19 ELBW and four of the control children (p = 0.08). Renal complications as defined per protocol were diagnosed only in six ELBW children (Table 3). The comparison of secondary outcomes between the studied groups is presented in Table 4. Correlation between kidney volume and serum cystatin C levels is described in Fig. 1.
Table 3.
Primary outcome variables in the studied groupsa
| ELBW group (n = 78) | Control group (n = 38) | p value | OR (95% CI) | |
|---|---|---|---|---|
| Renal complication | 6 (7.7) | 0 (0) | 0.09 | |
| Microalbuminuria | 5 (6.4) | 0 (0) | 0.17 | |
| Hypertension | 8 (10.3) | 2 (5.2) | 0.5 | 2.06 (0.46–0.89) |
| Low kidney volume | 19 (24.3) | 4 (10.5) | 0.08 | 2.73 (0.9–8.3) |
aExpressed as a number (percentage) of patients: p value for Fisher’s exact test; OR (95% CI), odds ratio and 95% confidence interval; ELBW extremely low birth weight
Table 4.
Secondary outcome variables in the studied groupsa
| ELBW group (n = 78) | Control group (n = 38) | p value | |
|---|---|---|---|
| Serum cystatin C level (mg/l) | 0.64 (0.07) | 0.59 (0.07) | 0.011 |
| Albuminuria (mg/g creatinine) | 5.53 (3.9) | 4.9 (3.3) | 0.51 |
| 24-h mean MAP (mmHg) | 79 (5.9) | 77 (4.4) | 0.21 |
| Day-time mean MAP (mmHg) | 82 (5.8) | 80 (4.8) | 0.41 |
| Night-time mean MAP (mmHg) | 75 (5.7) | 73 (4.3) | 0.261 |
| 24-h mean MAP (z-score) | 0.5 (1.1) | –0.3 (0.78) | 0.11 |
| Day-time mean MAP (z-score) | –0.36 (0.9) | –0.7 (0.73) | 0.51 |
| Night-time mean MAP (z-score) | 1.15 (0.84) | 0.2 (0.72) | 0.021 |
| Night-time dipping (%) | 12 (6.5) | 15 (4.5) | 0.11 |
| Night-time dipping < 10% | 13 (16.7%) | 2 (5.2%) | 0.132 |
| Systolic BP load (%) | 28 (22) | 16 (14) | <0.011 |
| Systolic BP load | 0.113 | ||
| <30% | 54 | 31 | |
| 30–50% | 12 | 6 | |
| >50% | 12 | 1 | |
| Diastolic BP load (%) | 27 (20) | 17 (10) | <0.011 |
| Diastolic BP load | |||
| <30% | 55 | 34 | 0.043 |
| 30–50% | 14 | 4 | |
| >50% | 9 | 0 | |
| Absolute kidney volume (ml) | 81 (20) | 113 (29) | <0.0011 |
| Relative kidney volume (%) | 85 (17) | 97 (17) | <0.0011 |
aExpressed as a mean and SD
p value for Student’s t testb, Fisher’s exact testc, Chi-square testd
MAP mean arterial pressure during 24-h ambulatory blood pressure measurement; BP blood pressure; ELBW extremely low birth weight
Fig. 1.
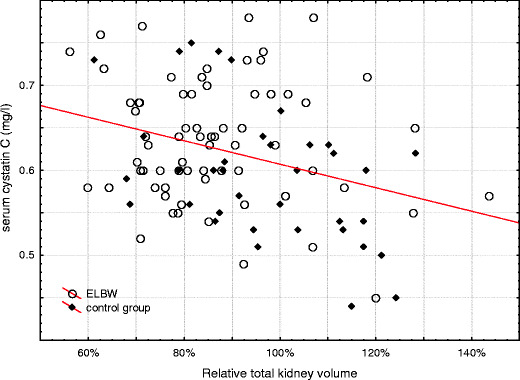
Correlation between relative kidney volume and serum cystatin C levels in the studied groups
Univariate analysis showed that being born as an SGA infant (p = 0.04), poor weight gain during NICU hospitalization (p < 0.001), intracranial bleeding (p = 0.03) and male sex (p = 0.01) were risk factors for renal complications in the ELBW group. However, a multivariate logistic regression revealed that the only independent risk factor was poor weight gain during NICU hospitalization (Table 5).
Table 5.
Logistic regression with renal complication as the outcome variable
| Factor | OR (95% CI) | p value |
|---|---|---|
| Gestational age (per week) | 1.84 (0.5–7.4) | 0.38 |
| Small for gestational age (per - 1 SD) | 1.0 (0.13–9.8) | 0.9 |
| Intracranial hemorrhage grade III and IV | 12.4 (0.1–999) | 0.32 |
| Gain weight during NICU stay (per 10 g/week) | 0.67 (0.39–0.94) | 0.03 |
NICU neonatal intensive care unit
Disscussion
The article describes the distribution of renal volume and blood pressure in 6–7-year-olds born with ELBW in comparison to the control group—children of the same age but born at term and with normal birth weight. Microalbuminuria and cystatin C levels were also assessed. The main outcome variable was renal complications defined as presence of at least two of the following abnormalities: abnormal serum cystatin C level, microalbuminuria, hypertension, low renal volume. The renal complications were diagnosed only in six ELBW children. The difference was not statistically significant. However, statistically significant differences within secondary outcomes as mean serum cystatin C levels, night-time mean blood pressure, night-time blood pressure dipping and mean systolic and diastolic BP load were detected. Renal ultrasound assessments revealed significantly smaller renal volume in 6/7-year-old individuals born with ELBW, compared to age-matched controls.
The lack of statistically significant differences in the incidence of renal complications may be connected to the size of the study group. The study was designed to include 80 ELBW children and 40 children born at term. Eventually, renal complications were assessed in 78 and 38 children, respectively. The estimated power of the study is only 67% (to detect 8% difference of prevalence of primary outcome with alpfa –0.05). However, the study possesses significant value because: (1) the study group included all newborns from the whole Malopolska region born between September, 1, 2002 and August 31, 2004, who reached the age of 6–7 years. The data concerning the children involved in our multi-center study comes from all tertiary referral centers from the Malopolska region. So it is a complete group of patients, possibly the largest, with a high percentage of observation (up to 88%). (2) The renal ultrasound assessment was standardized. (3) Blood pressure was assessed using modern tools to receive very detailed information. Most previously published studies examined children with very low birth weight (VLBW), the current study limited the study group to children with ELBW.
Renal ultrasound standardization was crucial for the value of the study. Children in the control group were taller and heavier, and because of the wide disparity between the two groups the volume of the kidneys was not defined as an absolute value, but as the standardized value for height and weight. In the absence of specifics in literature, and the lack of a standardized cut-off point for kidney volume parameter, below which we can recognize the volume as being too low, a limit of 2/3 of the standard value was determined and any outcome, which was below this point was treated as an indicator of low kidney volume. Four patients from the control group had a decreased rate of renal volume. Three of them were diagnosed as overweight, therefore we may assume that the obtained results of low relative kidney volume in these children are connected with their obesity and, in fact, their kidney volume is correct.
The major limitations of the study may be: the assumed criteria of hypertension, the lack of GFR calculation, and the lack of serum creatinine evaluation.
The ABPM method is still not the reference method for the diagnosis of hypertension, while in patients with borderline arterial blood pressure it is much more objective than a standard blood pressure measurement. This is why this method was chosen in this study.
There are also studies in which ABPM results seem to be at least as good as, or even better than, standard blood pressure measurements. Currently, the gold standard of diagnosis of hypertension is office sphygmomanometry. However, we used ABPM in our study because it enables blood pressure observation to be performed throughout the day and night in a non-medical environment, and it helps to quantify the circadian BP variability [15–17]. There are also publications suggesting a superior correlation of ABPM with end-organ damage in children and in adults [18–21]. Due to the character of our study, and because subjects differed in age and height, we took into account not the direct results of ABPM, but we converted the data into z-scores (SDS scores) as described by Wühl et al. [10].
It was expected that the patients in the study group, who were shorter and thinner, would have a slightly lower blood pressure than the control group. Yet, they had slightly higher blood pressure. Moreover, they do not have nocturnal dipping, which may be the first step in the development of hypertension. Several studies have shown that nocturnal dipping is characteristic for primary hypertension, while in secondary hypertension we do not see the decline [22]. In our study, we observed no drop in pressure during the night, which according to Flynn et al. [23] suggests an increased risk of secondary hypertension in the study group. In the Bayrakci et al. study [24], which analyzes the ABPM in preterm patients born small for gestational age (SGA) at the age 5–17 years, nocturnal dipping was less than that of controls.
We did not measure serum creatinine levels in all subjects, so we cannot calculate GFR using standard formulas. Several studies in adult patients have shown that cystatin C correlates more or at least as strongly as creatinine with GFR [25, 26]. Bökenkamp et al. have reported similar results in children [27]. According to Harmoinen et al., serum cystatin C appears to represent a useful and simple tool both for the identification of children with a reduced GFR (high sensitivity) and for the exclusion of children with a normal GFR (high specificity) [28]. Moreover, cystatin C concentrations may reflect GFR in children born with ELBW more closely than serum creatinine levels, as these children are unaffected by muscle mass and body weight [29], and at follow-up visits the ELBW children were significantly smaller and weighed less than the control group. However, due to the existing controversies associated with the conversion of the cystatin C level into GFR, such analysis was not performed.
It deserves attention that the study focused on a high-risk population for kidney complications development. The specific character of the studied population (e.g., low antenatal steroids use) might have influenced the results obtained and may also lead to difficulties in generalizing the results.
Very few reports assessing the influence of prematurity on the size and functioning of kidneys are available. Most of these reports either concentrate on more mature children or describe much smaller study groups treated in single medical centers that were assessed on short- or medium-term basis (up to 2–5 years).
The results of the longest observations were presented by Keijzer-Veen et al. [30]. The authors evaluated 20-year-olds born as very preterm children. They showed that the absolute and relative kidney length and volume were significantly lower in the preterm children than in the control group, but there was no statistical difference in GFRs among groups of children born very preterm and full-term. Keizer-Veen et al. observed also that preterm children have a significantly higher systolic blood pressure [31]. The major limitation of this study was a small sample size (n = 53). Moreover, the Keizer-Veen et al. study involved more mature children (mean gestational age was 30 weeks) than ours [31].
Drougia et al. [7] published results of a prospective longitudinal study aimed to estimate the renal growth during the first 2 years of life in the group of 466 children born above 28 weeks of gestation. The authors found that the relative kidney volume in the group of not extremely preterm babies (28–36 weeks) is significantly impaired up to the second year of life.
Rodriguez-Soriano et al. [2] evaluated 43 ELBW children aged between 6.1 and 12.4 years. Systolic, diastolic, and mean blood pressures did not differ from those of the controls. Mean percentiles for renal length and volume appeared normal. In comparison to the controls, plasma creatinine concentration was higher in preterm children. Only five study subjects (12.5%) fulfilled criteria for microalbuminuria. The reasons for differences in results can be associated with the following: the study included only children born in one center, with the follow-up rate 53%, ultrasound evaluations were done only in preterm children, not in the control group, and the authors compared casual BP measurements uncorrected for height of the patients.
Our observations correspond well with the results from the Singh and Hoy [32] and Hughson et al. [33] studies, who assumed that because nephron number, renal size and albuminuria are strongly interrelated in individuals at risk of renal diseases, very preterm infants may be at risk of developing microalbuminuria and renal disease in adult life.
Our results may suggest impaired fetal kidney development after preterm birth. Nephrogenesis starts in early pregnancy, peaks at the 32nd week of gestation, continues until 36 weeks of gestation, and is correlated to renal size [32]. The patients from our study group were born at 27 weeks of gestation; therefore, at birth nephrogenesis was incomplete. According to Lampl et al. [34] and Spencer et al. [35] humans born with low birth weight have a reduced number of nephrons, and fetal weight is inversely related to kidney volume measured by ultrasound. As there is limited postnatal nephrogenesis in preterm individuals [5, 36], a nephron deficit after preterm birth may be present throughout life.
A histomorphometric study performed by Rodriguez et al. in extremely premature and full-term infants revealed that nephron number highly correlated with gestational age and that nephrogenesis had stopped 40 days postnatally [5]. Nephron deficit predisposes to reduced renal function in the adult [32, 33], so babies born preterm, with restricted postnatal growth, are also at risk [37].
One of the most interesting observations made in the course of this study is the fact that weight gain in early infancy is an independent factor of renal complications. As it has been mentioned, the development of the kidney in prematurely born infants is unfinished, and a suitable intake of calories and proteins is necessary for its proper completion. The results of experimental animal studies (on rats) indicate that undernutrition during gestation and early life can cause permanent reduction in the number of nephrons [38]. Inadequate nutrition (whether enteral or parenteral) may impair nephron maturation as well as it may modify renal function in adulthood [39]. In the future periods of life, the passage from an unfavorable environment to a “too favorable” environment can predispose to pathologies in adulthood (metabolic syndrome) [40]. The results of a recent study concentrating on children born at term reveal a close connection between malnutrition and renal size in late infancy [41].
In conclusion, our data demonstrate that both serum cystatin C and kidney volume are significantly impaired in school-age in ELBW children. All children who have experienced the end point defined by the protocol as a renal complication, belonged to the study group. In addition, in these children all other three endpoints (microalbuminuria, hypertension, low kidney volume) were observed, which illustrates the broad convergence between the ELBW and renal complications.
Long-term alterations in renal function and blood pressure could be determined only with following these patients up into late adulthood. If these initial findings are confirmed, the initiation of renoprotective therapy should be taken into consideration in formerly preterm children.
Acknowledgements
This study was supported by an unrestricted grant from the Polish Ministry of Science (grant number NN407170734). The authors thank Dr. Karolina Poplawska for reviewing of the manuscript.
Open Access
This article is distributed under the terms of the Creative Commons Attribution Noncommercial License which permits any noncommercial use, distribution, and reproduction in any medium, provided the original author(s) and source are credited.
Abbreviations
- ABPM
Ambulatory blood pressure monitoring
- ACR
Urinary albumin to creatinine ratio
- BP
Blood pressure
- DBP
Diastolic blood pressure
- ELBW
Extremely low birth weight
- GFR
Glomerular filtration rate
- MAP
Mean arterial pressure
- NICU
Neonatal intensive care unit
- SBP
Systolic blood pressure
- SGA
Small for gestational age
- VLBW
Very low birth weight
References
- 1.Hack M. Young adult outcomes of very-low-birth-weight children. Semin Fetal Neonatal Med. 2006;11:127–137. doi: 10.1016/j.siny.2005.11.007. [DOI] [PubMed] [Google Scholar]
- 2.Rodríguez-Soriano J, Aguirre M, Oliveros R, Vallo A. Long-term renal follow-up of extremely low birth weight infants. Pediatr Nephrol. 2005;20:579–584. doi: 10.1007/s00467-005-1828-6. [DOI] [PubMed] [Google Scholar]
- 3.Payne N, Finkelstein M, Liu M, Kaempf J, Sharek P, Olsen S. NICU practices and outcomes associated with 9 years of quality improvement collaboratives. Pediatrics. 2010;125:437–446. doi: 10.1542/peds.2009-1272. [DOI] [PubMed] [Google Scholar]
- 4.Kwinta P, Pietrzyk J. Preterm birth and respiratory disease in later life. Expert Rev Respir Med. 2010;4:593–604. doi: 10.1586/ers.10.59. [DOI] [PubMed] [Google Scholar]
- 5.Rodríguez MM, Gómez AH, Abitbol CL, Chandar JJ, Duara S, Zilleruelo GE. Histomorphometric analysis of postnatal glomerulogenesis in extremely preterm infants. Pediatr Dev Pathol. 2004;7:17–25. doi: 10.1007/s10024-003-3029-2. [DOI] [PubMed] [Google Scholar]
- 6.Schmidt IM, Chellakooty M, Boisen KA, Damgaard IN, Mau Kai C, Olgaard K, Main KM. Impaired kidney growth in low-birth-weight children: distinct effects of maturity and weight for gestational age. Kidney Int. 2005;68:731–740. doi: 10.1111/j.1523-1755.2005.00451.x. [DOI] [PubMed] [Google Scholar]
- 7.Drougia A, Giapros V, Hotoura E, Papadopoulou F, Argyropoulou M, Andronikou S. The effects of gestational age and growth restriction on compensatory kidney growth. Nephrol Dial Transplant. 2009;24:142–148. doi: 10.1093/ndt/gfn431. [DOI] [PubMed] [Google Scholar]
- 8.Drukker A, Guignard JP. Renal aspects of the term and preterm infant: a selective update. Curr Opin Pediatr. 2002;14:175–182. doi: 10.1097/00008480-200204000-00006. [DOI] [PubMed] [Google Scholar]
- 9.Pickering TG, Hall JE, Appel LJ, Falkner BE, Graves J, Hill MN, Jones DW, Kurtz T, Sheps SG, Roccella EJ. Recommendations for blood pressure measurement in humans and experimental animals: Part 1: Blood pressure measurement in humans: a statement for professionals from the Subcommittee of Professional and Public Education of the American Heart Association Council on High Blood Pressure Research. Circulation. 2005;111:697–716. doi: 10.1161/01.CIR.0000154900.76284.F6. [DOI] [PubMed] [Google Scholar]
- 10.Wühl E, Witte K, Soergel M, Mehls O, Schaefer F, German Working Group on Pediatric Hypertension Distribution of 24-h ambulatory blood pressure in children: normalized reference values and role of body dimensions. J Hypertens. 2002;20:1995–2007. doi: 10.1097/00004872-200210000-00019. [DOI] [PubMed] [Google Scholar]
- 11.National High Blood Pressure Education Program Working Group on High Blood Pressure in Children and Adolescents The fourth report on the diagnosis, evaluation, and treatment of high blood pressure in children and adolescents. Pediatrics. 2004;114:555–576. [PubMed] [Google Scholar]
- 12.Dinkel E, Ertel M, Dittrich M, Peters H, Berres M, Schulte-Wissermann H. Kidney size in childhood. Sonographical growth charts for kidney length and volume. Pediatr Radiol. 1985;15:38–43. doi: 10.1007/BF02387851. [DOI] [PubMed] [Google Scholar]
- 13.Oswald J, Schwentner C, Lunacek A, Deibl M, Bartsch G, Radmayr C. Age and lean body weight related growth curves of kidneys using real-time 3-dimensional ultrasound in pediatric urology. J Urol. 2004;172:1991–1994. doi: 10.1097/01.ju.0000141051.67866.50. [DOI] [PubMed] [Google Scholar]
- 14.Dupont WD, Plummer WD. Power and sample size calculations. A review and computer program. Control Clin Trials. 1990;11:116–128. doi: 10.1016/0197-2456(90)90005-M. [DOI] [PubMed] [Google Scholar]
- 15.Loirat C, Azancot-Benisty A, Bossu C, Durand I. Value of ambulatory blood pressure monitoring in borderline hypertension in the child. Ann Pediatr (Paris) 1991;38:381–386. [PubMed] [Google Scholar]
- 16.Mancia G, Parati G, Pomidossi G, Grassi G, Casadei R, Zanchetti A. Alerting reaction and rise in blood pressure during measurement by physician and nurse. Hypertension. 1987;9:209–215. doi: 10.1161/01.HYP.9.2.209. [DOI] [PubMed] [Google Scholar]
- 17.Sorof JM, Portman RJ. White coat hypertension in children with elevated casual blood pressure. J Pediatr. 2000;137:493–497. doi: 10.1067/mpd.2000.108394. [DOI] [PubMed] [Google Scholar]
- 18.Perloff D, Sokolow M, Cowan R. The prognostic value of ambulatory blood pressures. JAMA. 1983;249:2792–2798. doi: 10.1001/jama.1983.03330440030027. [DOI] [PubMed] [Google Scholar]
- 19.White WB, Schulman P, McCabe EJ, Dey HM. Average daily blood pressure, not office blood pressure, determines cardiac function in patients with hypertension. JAMA. 1989;261:873–877. doi: 10.1001/jama.1989.03420060089038. [DOI] [PubMed] [Google Scholar]
- 20.Staessen JA, Thijs L, Fagard R, O'Brien ET, Clement D, de Leeuw PW, Mancia G, Nachev C, Palatini P, Parati G, Tuomilehto J, Webster J. Predicting cardiovascular risk using conventional vs. ambulatory blood pressure in older patients with systolic hypertension. Systolic Hypertension in Europe Trial Investigators. JAMA. 1999;282:539–546. doi: 10.1001/jama.282.6.539. [DOI] [PubMed] [Google Scholar]
- 21.Cuspidi C, Macca G, Salerno M, Michev L, Fusi V, Severgnini B, Corti C, Meani S, Magrini F, Zanchetti A. Evaluation of target organ damage in arterial hypertension: which role for qualitative funduscopic examination? Ital Heart J. 2001;2:702–706. [PubMed] [Google Scholar]
- 22.Díaz LN, Garin EH. Comparison of ambulatory blood pressure and Task Force criteria to identify pediatric hypertension. Pediatr Nephrol. 2007;22:554–558. doi: 10.1007/s00467-006-0372-3. [DOI] [PubMed] [Google Scholar]
- 23.Flynn JT. Differentiation between primary and secondary hypertension in children using ambulatory blood pressure monitoring. Pediatrics. 2002;110:89–93. doi: 10.1542/peds.110.1.89. [DOI] [PubMed] [Google Scholar]
- 24.Bayrakci US, Schaefer F, Duzova A, Yigit S, Bakkaloglu A. Abnormal circadian blood pressure regulation in children born preterm. J Pediatr. 2007;151:399–403. doi: 10.1016/j.jpeds.2007.04.003. [DOI] [PubMed] [Google Scholar]
- 25.Newman DJ, Thakkar H, Edwards RG, Wilkie M, White T, Grubb AO, Price CP. Serum cystatin C measured by automated immunoassay: a more sensitive marker of changes in GFR than serum creatinine. Kidney Int. 1995;47:312–318. doi: 10.1038/ki.1995.40. [DOI] [PubMed] [Google Scholar]
- 26.Kyhse-Andersen J, Schmidt C, Nordin G, Andersson B, Nilsson-Ehle P, Lindström V, Grubb A. Serum cystatin C, determined by a rapid, automated particle-enhanced turbidimetric method, is a better marker than serum creatinine for glomerular filtration rate. Clin Chem. 1994;40:1921–1926. doi: 10.1093/clinchem/40.10.1921. [DOI] [PubMed] [Google Scholar]
- 27.Bökenkamp A, Domanetzki M, Zinck R, Schumann G, Byrd D, Brodehl J. Cystatin C–a new marker of glomerular filtration rate in children independent of age and height. Pediatrics. 1998;101:875–881. doi: 10.1542/peds.101.5.875. [DOI] [PubMed] [Google Scholar]
- 28.Harmoinen A, Ylinen E, Ala-Houhala M, Janas M, Kaila M, Kouri T. Reference intervals for cystatin C in pre- and full-term infants and children. Pediatr Nephrol. 2000;15:105–108. doi: 10.1007/s004670000421. [DOI] [PubMed] [Google Scholar]
- 29.Newman DJ. Cystatin C. Ann Clin Biochem. 2002;39:89–104. doi: 10.1258/0004563021901847. [DOI] [PubMed] [Google Scholar]
- 30.Keijzer-Veen M, Kleinveld H, Lequin M, Dekker F, Nauta J, de Rijke Y, van der Heijden B. Renal function and size at young adult age after intrauterine growth restriction and very premature birth. Am J Kidney Dis. 2007;50:542–551. doi: 10.1053/j.ajkd.2007.06.015. [DOI] [PubMed] [Google Scholar]
- 31.Keijzer-Veen M, Dülger A, Dekker F, Nauta J, van der Heijden B. Very preterm birth is a risk factor for increased systolic blood pressure at a young adult age. Pediatr Nephrol. 2010;25:509–516. doi: 10.1007/s00467-009-1373-9. [DOI] [PMC free article] [PubMed] [Google Scholar]
- 32.Singh GR, Hoy WE. Kidney volume, blood pressure, and albuminuria: findings in an Australian aboriginal community. Am J Kidney Dis. 2004;43:254–259. doi: 10.1053/j.ajkd.2003.10.015. [DOI] [PubMed] [Google Scholar]
- 33.Hughson M, Farris AB, Douglas-Denton R, Hoy WE, Bertram JF. Glomerular number and size in autopsy kidneys: the relationship to birth weight. Kidney Int. 2003;63:2113–2122. doi: 10.1046/j.1523-1755.2003.00018.x. [DOI] [PubMed] [Google Scholar]
- 34.Lampl M, Kuzawa CW, Jeanty P. Infants thinner at birth exhibit smaller kidneys for their size in late gestation in a sample of fetuses with appropriate growth. Am J Hum Biol. 2002;14:398–406. doi: 10.1002/ajhb.10050. [DOI] [PubMed] [Google Scholar]
- 35.Spencer J, Wang Z, Hoy W. Low birth weight and reduced renal volume in Aboriginal children. Am J Kidney Dis. 2001;37:915–920. doi: 10.1016/S0272-6386(05)80006-X. [DOI] [PubMed] [Google Scholar]
- 36.Rodriguez MM, Gomez A, Abitbol C, Chandar J, Montané B, Zilleruelo G. Comparative renal histomorphometry: a case study of oligonephropathy of prematurity. Pediatr Nephrol. 2005;20:945–949. doi: 10.1007/s00467-004-1800-x. [DOI] [PubMed] [Google Scholar]
- 37.Bacchetta J, Harambat J, Dubourg L, Guy B, Liutkus A, Canterino I, Kassaï B, Putet G, Cochat P. Both extrauterine and intrauterine growth restriction impair renal function in children born very preterm. Kidney Int. 2009;76:445–452. doi: 10.1038/ki.2009.201. [DOI] [PubMed] [Google Scholar]
- 38.Harrison M, Langley-Evans SC. Intergenerational programming of impaired nephrogenesis and hypertension in rats following maternal protein restriction during pregnancy. Br J Nutr. 2008;9:1–11. doi: 10.1017/S0007114508057607. [DOI] [PMC free article] [PubMed] [Google Scholar]
- 39.Moritz KM, Singh RR, Probyn ME, Denton KM. Developmental programming of a reduced nephron endowment: more than just a baby's birth weight. Am J Physiol Renal Physiol. 2009;296:F1–F9. doi: 10.1152/ajprenal.00049.2008. [DOI] [PubMed] [Google Scholar]
- 40.Fanos V, Puddu M, Reali A, Atzei A, Zaffanello M. Perinatal nutrient restriction reduces nephron endowment increasing renal morbidity in adulthood: a review. Early Hum Dev. 2010;86:S37–S42. doi: 10.1016/j.earlhumdev.2010.01.007. [DOI] [PubMed] [Google Scholar]
- 41.Ece A, Gözü A, Bükte Y, Tutanç M, Kocamaz H. The effect of malnutrition on kidney size in children. Pediatr Nephrol. 2007;22:857–863. doi: 10.1007/s00467-006-0338-5. [DOI] [PubMed] [Google Scholar]