

Graphical abstract

Abbreviations: CN, chondroitin (unsulfated); COSY, correlation spectroscopy; CS, chondriotin sulfate; CSPG, CS proteoglycan; GAG, glycosaminoglycan; GlcA, d-glucuronic acid; GalNAc, N-acetyl-d-galactosamine; GlcNAc, N-acetyl-d-glucosamine; HA, hyaluronan; HMBC, heteronuclear multiple bond coherence; HSQC, heteronuclear single quantum coherence; NMR, nuclear magnetic resonance; NOESY, nuclear Overhauser effect spectroscopy; PDB, Protein data bank; PG, proteoglycan
Keywords: Chondroitin sulfate, 15N-isotope incorporation, Conformation, NMR, K4 polysaccharide
Abstract
The glycosaminoglycan chondroitin sulfate is essential in human health and disease but exactly how sulfation dictates its 3D-strucutre at the atomic level is unclear. To address this, we have purified homogenous oligosaccharides of unsulfated chondroitin (with and without 15N-enrichment) and analysed them by high-field NMR to make a comparison published chondroitin sulfate and hyaluronan 3D-structures. The result is the first full assignment of the tetrasaccharide and an experimental 3D-model of the hexasaccharide (PDB code 2KQO). In common with hyaluronan, we confirm that the amide proton is not involved in strong, persistent inter-residue hydrogen bonds. However, in contrast to hyaluronan, a hydrogen bond is not inferred between the hexosamine OH-4 and the glucuronic acid O5 atoms across the β(1→3) glycosidic linkage. The unsulfated chondroitin bond geometry differs slightly from hyaluronan by rotation about the β(1→3) ψ dihedral (as previously predicted by simulation), while the β(1→4) linkage is unaffected. Furthermore, comparison shows that this glycosidic linkage geometry is similar in chondroitin-4-sulfate. We therefore hypothesise that both hexosamine OH-4 and OH-6 atoms are solvent exposed in chondroitin, explaining why it is amenable to sulfation and hyaluronan is not, and also that 4-sulfation has little effect on backbone conformation. Our conclusions exemplify the value of the 3D-model presented here and progress our understanding of glycosaminoglycan molecular properties.
1. Introduction
Glycosaminoglycans (GAGs) are extracellular matrix polysaccharides that play crucial mechanical and regulatory roles in vertebrate physiology. The majority of GAGs share an anionic disaccharide repeat, comprising one uronic acid (d-glucuronic or l-iduronic) and one amino sugar (d-galactosamine or d-glucosamine). Depending on chemical features, they can be further sub-typed as hyaluronan (the only unsulfated GAG), chondroitin sulfate and heparin sulfate,1 which are all heterogeneous with respect to degree of polymerisation, sulfation and biological activity. In contrast to hyaluronan, the sulfated GAGs are either O- or N-linked to proteins, yielding proteoglycans, which are abundant in vertebrate digestive, endocrine, nervous, muscular, skeletal, circulatory, immune, respiratory, urinary and reproductive tissue.2 It is hypothesised that their diverse and enigmatic biological functions are modulated by the sulfation patterns within the constituent GAGs.3–6
Chondroitin sulfate (CS) comprises repeating disaccharides of d-glucuronic acid and N-acetyl-d-galactosamine (illustrated in Fig. 1) that can be sulfated at either the 4- or 6-hydroxyl of the galactosamine residues. The exact role of this sulfation in determining biological properties and its effect on physical properties, such as CS shape, is currently poorly understood. Furthermore, based on our current knowledge of GAG 3D-structure, and the fact that the backbones of chondroitin and hyaluronan differ by only a single stereochemical rearrangement of the 4-hydroxyl, it is difficult to explain why organisms have not evolved the ability to biosynthesise sulfated hyaluronan.
Figure 1.

The repeating disaccharide units of unsulfated chondroitin and hyaluronan (grey). The glucuronic acid (GlcA; U) and N-acetyl-d-galactosamine (GalNAc; N) residues of chondroitin are joined by β(1→3) and β(1→4) glycosidic linkages. In this report the IUPAC ring numbering convention is used, that is, residues are numbered starting from the reducing end, which is capped by a hydroxyl. The adopted nomenclature for identifying carbon atoms is indicated. Hydrogen atoms assume the number of the closest bonded carbon atom.
In order to improve our understanding of GAG 3D-structure and relate this to physical properties and biological function, we have previously conducted experimental and theoretical studies on defined oligosaccharides from hyaluronan and heparan sulfate. In this latest study, we turn our attention to the 3D-structure of CS, which provides the heterogeneous sulfation found in CS proteoglycans (CSPGs).7 These CSPGs are critical for correct neuronal development and cellular signalling,8 and aberrant expression of and structural modifications to CSPGs have been implicated in atherosclerosis and cancer.7 CS also has the potential to be the basis of new therapeutics,9 two CS products are in clinical use (for the treatment of burns and ulcers).10 Furthermore, CSPGs have attracted interest as a possible route to regenerating central nervous tissue that has been damaged by injury or disease.11–13
The primary barrier to structural studies of CS, and sulfated GAGs in general, has been the high level of chemical degeneracy and hence the unavailability of homogeneous material.14 Structural studies are further impeded by the fact that only short polymers crystallise uniformly due to their inherent flexibility15 and due to the characteristic overlap of NMR resonances in the spectra of oligosaccharides.16 One possible way to circumvent these limitations, presented here, is to initially avoid the complication of sulfate by preparing pure unsulfated chondroitin oligosaccharides for detailed NMR studies. Unsulfated chondroitin can then be used as a basis for investigating the effect of sulfation by making a comparison with the literature data or further studies.
We used capsular polysaccharide K4 from the Escherichia coli (O5:K4:H4) strain, which is identical (apart from a labile fructose decoration) to the unsulfated carbohydrate backbone of CS, as a preparative starting point.17 This strategy also allows biosynthetic incorporation of isotopes, which are useful in NMR studies (e.g., 15N). Here we report production and purification of natural abundance isotope and 15N-enriched unsulfated chondroitin oligosaccharides from K4 antigen polysaccharide, up to decasaccharides, with slight modifications to the existing protocols in order to achieve milligram quantities of homogeneous defructosylated material in minimal media. Furthermore, the similarity of pathogenic polysaccharides to GAGs is more than a coincidence,17,18 it is a molecular camouflage that enhances bacterial virulence. Therefore, these studies could also facilitate the development of novel anti-microbial compounds and vaccines.19
We previously demonstrated the value of homogeneous hyaluronan oligosaccharides,20,21 with and without 15N-isotopic enrichment, which resulted in novel sequence-specific NMR data. Again, using a similar strategy, we report a full triple-resonance (1H, 13C, 15N) chemical-shift assignment of the chondroitin tetrasaccharide, and provide sequence-specific insights for larger oligosaccharides. Additionally, we used ultra-high-field (900 MHz) NMR to determine a set of nuclear Overhauser effect measurements, which were used to calculate a 3D-structural model for the unsulfated chondroitin hexasaccharide in an aqueous solution.
Based on our findings, we discuss whether there is a major 3D-structural difference between the carbohydrate backbones of hyaluronan and chondroitin and consider the conformational effects of sulfation, by comparison with previous literature data. The results help clarify the role of GAG (and specifically CS) sulfation in molecular interactions and hence vertebrate physiology and provide the basis for structure-based design of novel medicines and medical devices.
2. Results
2.1. NMR and triple-resonance assignments: 1H, 13C and 15N
Spectra obtained with a 1H frequency of 600 MHz were sufficient to assign all resonances (1H, 13C and 15N) within the chondroitin tetramer (CN4) using a 15N-enriched sample. It was necessary to record additional data at 900 MHz to measure some scalar couplings and obtain a well-resolved NOESY spectrum on a natural abundance isotope sample for 3D-structure elucidation.
The CN4 all-atom assignment was achieved by taking advantage of chemical shift perturbations caused by end-effects (inter-conversion of the reducing-end hexosamine, between α- and β-anomers). The 1H and 13C atoms were fully assigned (see Table 1) using [1H, 13C]-HSQC, [1H, 15N]-HSQC, [1H, 13C]-HMBC and [1H, 1H]-COSY experiments. In Table 1 and in all subsequent tables, figures and discussion, the nomenclature for atom numbering and residue naming follows the schemes illustrated and described in Figure 1 and its footnote. Resolved 1H and 13C assignments for the residues N-acetyl-d-galactosamine-1 (GalNAc-1) to d-glucuronic acid-4 (GlcA-4) of CN6 are available as Supplementary data.
Table 1.
1H and 13C chemical-shift assignments for tetrasaccharides of unsulfated chondroitin (CN4) hyaluronan (HA4)
| Ring | Reporter | HA4 |
CN4 |
ABS(CN4-HA4) |
|||
|---|---|---|---|---|---|---|---|
| α | β | α | β | α | β | ||
| N1 | H-1 | 5.155 | 4.713 | 5.205 | 4.665 | 0.050 | 0.048 |
| H-2 | 4.034 | 3.806 | 4.273 | 3.983 | 0.239 | 0.177 | |
| H-3 | 3.890 | 3.716 | 3.986 | 3.795 | 0.096 | 0.079 | |
| H-4 | 3.552 | 3.514 | 4.190 | 4.118 | 0.638 | 0.604 | |
| H-5 | 3.869 | 3.472 | 4.104 | n/d | 0.235 | n/d | |
| H6proR | 3.792 | 3.750 | 3.727a | 3.652 | 0.065 | 0.098 | |
| H6proS | 3.827 | 3.890 | 3.727a | 3.600 | 0.100 | 0.290 | |
| HMe | 2.014 | 2.015 | 2.013 | 1.995 | 0.001 | 0.020 | |
| U2 | H-1 | 4.507 | 4.467 | 4.547 | 4.484 | 0.040 | 0.017 |
| H-2 | 3.366 | 3.363 | 3.368 | 0.002 | 0.005 | ||
| H-3 | 3.585 | 3.580 | 3.582 | 0.003 | 0.002 | ||
| H-4 | 3.748 | 3.744 | 3.746 | 0.002 | 0.002 | ||
| H-5 | 3.712 | 3.703 | 3.684 | 0.028 | 0.019 | ||
| N3 | H-1 | 4.560 | 4.494 | 0.066 | |||
| H-2 | 3.851 | 4.004 | 0.153 | ||||
| H-3 | 3.707 | 3.795 | 0.088 | ||||
| H-4 | 3.542 | 4.164 | 0.622 | ||||
| H-5 | 3.484 | 3.687 | 0.203 | ||||
| H6proR | 3.780 | 3.755a | 0.025 | ||||
| H6proS | 3.921 | 3.755a | 0.166 | ||||
| HMe | 2.028 | 2.021 | 0.007 | ||||
| U4 | H-1 | 4.458 | 4.472 | 0.014 | |||
| H-2 | 3.321 | 3.314 | 0.007 | ||||
| H-3 | 3.496 | 3.466 | 0.030 | ||||
| H-4 | 3.497 | 3.470 | 0.027 | ||||
| H-5 | 3.723 | 3.669 | 0.054 | ||||
| N1 | C-1 | 93.879 | 97.589 | 94.010 | 98.023 | 0.131 | 0.434 |
| C-2 | 55.817 | 58.454 | 55.121 | 55.142 | 0.696 | 3.312 | |
| C-3 | 82.758 | 85.151 | 80.073 | 83.066 | 2.685 | 2.085 | |
| C-4 | 71.390 | 71.351 | 71.345 | 70.679 | 0.045 | 0.672 | |
| C-5 | 74.080 | 78.264 | 73.089 | n/d | 0.991 | n/d | |
| C-6 | 63.398 | 63.567 | 64.103 | 65.672 | 0.705 | 2.105 | |
| CMe | 24.814 | 25.065 | 24.947 | 24.095 | 0.133 | 0.970 | |
| U2 | C-1 | 105.675 | 105.818 | 106.812 | 106.907 | 1.137 | 1.089 |
| C-2 | 75.324 | 75.294 | 75.332 | 0.008 | 0.038 | ||
| C-3 | 76.506 | 76.641 | 0.135 | ||||
| C-4 | 82.781 | 82.502 | 0.279 | ||||
| C-5 | 79.098 | 79.006 | 0.092 | ||||
| N3 | C-1 | 103.325 | 103.646 | 0.321 | |||
| C-2 | 57.049 | 53.794 | 3.255 | ||||
| C-3 | 85.839 | 83.801 | 2.038 | ||||
| C-4 | 71.357 | 70.494 | 0.863 | ||||
| C-5 | 78.183 | 77.773 | 0.410 | ||||
| C-6 | 63.390 | 63.925 | 0.535 | ||||
| CMe | 25.326 | 25.274 | 0.052 | ||||
| U4 | C-1 | 105.715 | 106.882 | 1.167 | |||
| C-2 | 75.578 | 75.580 | 0.002 | ||||
| C-3 | 78.213 | 78.201 | 0.012 | ||||
| C-4 | 74.560 | 74.644 | 0.084 | ||||
| C-5 | 78.477 | 78.957 | 0.480 | ||||
All chemical shift values are reported in units of ppm. ABS(CN4–HA4): absolute difference between CN4 and HA4 values. Highlighted (underlined) data correspond to measurements which differ in CN4 and HA4 by >0.5 ppm. Data were acquired at 600 MHz, pH 6.0, 25 °C in 5–10% (v/v) D2O and referenced relative to δDSS (1H). Standard errors: 1H ±0.001 ppm, 13C ±0.004 ppm. Values for HA4 are from Blundell et al.30
Enrichment with 15N-isotope allowed intense [1H, 15N]-HSQC spectra to be recorded rapidly, as we have shown previously in other GAGs.20,21 Figure 2 illustrates the examples of the [1H, 15N]-HSQC spectra for the tetra-, hexa- and octa-saccharides (CN4, CN6 and CN8) and the 1H and 15N chemical-shift assignments for CN4, CN6, CN8 and CN10 are detailed in Table 2. In these 2D spectra, all 15N nuclei were resolved at 600 MHz, apart from resonances in the N7 and N9 residues of CN8 and CN10 (they could not be significantly improved at 900 MHz). End-effects manifested as two distinct regions in the 600 MHz [1H, 15N]-HSQC NMR spectra, which are exemplified in the broken-axis CN6 spectrum shown in Figure 2 panel A. Both reducing-end terminal anomers were shifted downfield in the 1H dimension compared to the internal residues, which are magnified in panels B, C and D (for CN4, CN6 and CN8, respectively) in order to illustrate the resonance overlap that is a result of the very similar chemical environment of these atoms.
Figure 2.

[1H, 15N]-HSQC spectra of CN oligosaccharides of different lengths. (A) Complete (broken-axis) spectrum of CN6. Panels (B, C and D) illustrate internal amide resonances in magnified portions of CN4, CN6 and CN8 spectra, respectively. The 3JHN,H2 coupling constant of the N3 residue in CN4 (also see Table 4) is annotated in panel (B). Standard errors: 1H ±0.001 ppm, 15N ±0.003 ppm. Data were acquired at 600 MHz, pH 6.0, 25 °C in 5–10% (v/v) D2O and referenced indirectly relative to δDSS (1H).
Table 2.
1H and 15N chemical-shift assignments for oligosaccharides of unsulfated chondroitin (CN) and hyaluronan (HA)
| Ring | Reporter | CN4 | HA4a | CN6 | HA6a | CN8 | HA8a | CN10 | HA10b |
|---|---|---|---|---|---|---|---|---|---|
| N1α | 1H | 8.081 | 8.188 | 8.082 | 8.189 | 8.080 | 8.191 | 8.081 | 8.191 |
| 15N | 123.312 | 122.943 | 123.322 | 122.947 | 122.319 | 122.362 | 123.322 | 122.951 | |
| N1β | 1H | 8.184 | 8.271 | 8.183 | 8.271 | 8.183 | 8.181 | 8.180 | 8.271 |
| 15N | 122.354 | 122.089 | 122.363 | 122.098 | 122.362 | 122.101 | 122.362 | 122.098 | |
| N3 | 1H | 7.974 | 8.055 | 7.976 | 8.052 | 7.975 | 8.052 | 7.975 | 8.053 |
| 15N | 122.337 | 122.134 | 122.326 | 121.996 | 122.329 | 121.996 | 122.333 | 121.993 | |
| N5 | 1H | — | — | 7.963 | 8.042 | 7.961 | 8.042 | 7.960 | 8.040 |
| 15N | — | — | 122.299 | 122.097 | 122.288 | 121.954 | 122.290 | 121.942 | |
| N7 | 1H | — | — | — | — | n/d | 8.042 | n/d | 8.043 |
| 15N | — | — | — | — | n/d | 121.907 | n/d | 121.950 | |
| N9 | 1H | — | — | — | — | — | — | n/d | 8.042 |
| 15N | — | — | — | — | — | — | n/d | 122.093 | |
All chemical-shift values are reported in units of ppm. N1–N7 denotes the GalNAc residue number according to the IUPAC classification. Data were acquired at 600 MHz, pH 6.0, 25 °C in 5–10% (v/v) D2O and referenced relative to δDSS (1H). Standard errors: 1H ±0.005 ppm, 15N ±0.005 ppm. n/d: value not determined for some reason, for example, due to resonance overlap.
Values for HA are from Blundell et al.20,30
Due to the fact that internal 1H and 13C resonances of CN6 and longer oligosaccharides are indistinguishable at 600 MHz, and the fact that the 15N chemical shifts of the internal residues of CN6 and CN8 are almost identical (Fig. 2, panels C and D), it was considered that the chemical environment at the centre of a hexasaccharide was already similar to the polymer, as we found previously for hyaluronan oligosaccharides.20 This finding indicates that the hexasaccharide is the shortest length that exhibits polymeric behaviour and gives us confidence that 3D-structural observations on CN6 are representative of the polymer.
2.2. Scalar couplings and temperature coefficients
We measured scalar couplings and temperature coefficients in order to quantify ring geometry, acetimido conformation and inter-residual hydrogen bonds from the unsulfated chondroitin 3D-structure in an aqueous solution. The CN4 3JH,H values measured from 600 to 900 MHz [1H]–1D NMR spectra are reported in Table 3. Although we did not use these values to restrain our 3D-structural models of CN6, we did compare them with the values calculated from the 3D-structural models (also listed in Table 3) using the Karplus equations of Altona and Haasnoot.22 This comparison (vide infra) served as a retrospective quality control on the most energetically favourable 3D-structures generated.
Table 3.
3JH,H coupling constants for tetrasaccharides of unsulfated chondroitin (CN4) and hyaluronan (HA4)
| Ring | 3JH,H | CN4 | CN6 CALC | HA4 | CN4–HA4 |
|---|---|---|---|---|---|
| N1α | 1,2 | 3.72 | n/cc | 3.60 | 0.12 |
| 2,3 | 11.20 | n/cc | 10.56 | 0.64 | |
| 3,4 | 0.62 | n/cc | 8.79 | −8.17 | |
| 4,5 | 2.90 | n/cc | 10.06 | −7.16 | |
| N1β | 1,2 | 8.49 | 7.80 | 8.41 | 0.08 |
| 2,3 | 10.83 | 8.80 | n/da | n/da | |
| 3,4 | 0.63 | 3.10 | 8.81 | −8.18 | |
| 4,5 | 2.37 | 0.90 | 10.06 | −7.69 | |
| U2α | 1,2 | 7.94 | n/cc | 7.91 | 0.03 |
| U2β | 1,2 | 7.38 | 7.00 | 7.92 | −0.54 |
| U2α | 2,3 | 9.54 | n/cc | 9.46 | 0.08 |
| U2β | 2,3 | 10.09 | 7.60 | 9.46 | 0.63 |
| U2 | 3,4 | 7.16 | 7.80 | 8.76 | −1.60 |
| U2 | 4,5 | 9.09 | 8.20 | 9.67 | −0.58 |
| N3 | 1,2 | 8.24 | 6.40 | 8.57 | −0.33 |
| 2,3 | n/da | 8.80 | 10.37 | 2.96 | |
| 3,4 | n/da | 2.90 | n/da | n/da | |
| 4,5 | 4.76 | 0.90 | 10.00 | −5.24 | |
| U4 | 1,2 | 8.47 | 7.00 | 7.80 | 0.67 |
| 2,3 | 8.29 | 8.90 | 10.37 | −2.08 | |
| 3,4 | n/da | 8.00 | s/cb | n/da | |
| 4,5 | 9.09 | 8.40 | 9.78 | −0.69 | |
All couplings are reported in units of hertz. Underlined values correspond to coupling constants, which differ in CN4 and HA4 by >5 Hz. Calculated (CN6 CALC) values were computed from the lowest energy CN6 conformer generated in this work using the substituent-adjusted Karplus equations of Altona and Haasnoot.22 Standard error on all couplings is ±0.05 Hz. CN4 values were measured from 15N-enriched 600 or 900 MHz 1D spectra. HA4 values are from Blundell et al.30
Value not determined due to resonance overlap.
Nuclei are strongly coupled. 3J5,6 and 3J6,6 values were not observable due to resonance overlap. CN4–HA4: the difference between CN4 and HA4 values.
Value not calculated.
Figure 3 panel A illustrates a [1H]–1D NMR spectrum of the15N-enriched CN4 sample recorded at a 1H frequency of 600 MHz (no 15N-decoupling during acquisition). The amide region is magnified in Figure 3 panel B, showing that the amide proton resonances of the N1α, N1β and N3 residues are clearly resolved. The 1JH,N and 3JHN,H2 coupling constants, measured from 600 MHz [1H]–1D spectra of the type illustrated in Figure 3 panel B, are listed in Table 4. Some of these scalar-coupling measurements were not possible for internal residues of CN6, CN8 and CN10, due to resonance overlap in 600 and 900 MHz [1H]–1D spectra. Inspection of the 2D [1H, 15N]-HSQC spectra (with 15N-decoupling during acquisition) for each oligosaccharide revealed similar 3JHN,H2 coupling constants to the tetrasaccharide but these measurements are significantly less accurate and are thus not reported here.
Figure 3.

(A) The [1H]–1D NMR spectrum of the 15N-enriched unsulfated chondroitin tetrasaccharide. (B) The amide region magnified. Resonances attributed to residues GalNAc-1α, GalNAc-1β and GalNAc-3 are labelled. The large (≈90 Hz) 1JH,N and small (≈10 Hz) 3JHN,H2 couplings are listed in Table 4. Data were acquired at 600 MHz, pH 6.0, 25 °C in 5–10% (v/v) D2O and referenced relative to δDSS (1H). Standard error: 1H ±0.001 ppm.
Table 4.
1JH,N and 3JHN,H2 coupling constants for the unsulfated chondroitin oligosaccharides
| Ring | J | CN4 | CN6 | CN8 | CN10 |
|---|---|---|---|---|---|
| N1α | 1JH,N | 92.74 | 93.13 | 92.74 | 92.71 |
| 3JHN,H2 | 9.39 | 8.98 | 9.40 | 9.55 | |
| N1β | 1JH,N | 91.57 | 91.61 | 91.55 | 91.74 |
| 3JHN,H2 | 9.69 | 9.75 | 9.71 | 9.76 | |
| N3 | 1JH,N | 91.85 | 91.94 | n/d | n/d |
| 3JHN,H2 | 9.75 | n/d | n/d | n/d | |
| N5 | 1JH,N | — | 91.89 | n/d | n/d |
| 3JHN,H2 | — | n/d | n/d | n/d | |
| N7 | 1JH,N | — | — | 91.97 | n/d |
| 3JHN,H2 | — | — | n/d | n/d | |
| N9 | 1JH,N | — | — | — | 91.89 |
| 3JHN,H2 | — | — | — | n/d | |
All couplings are reported in units of hertz. Standard error on all couplings is ±0.05 Hz. CN4 values were measured from 15N-enriched 600 or 900 MHz 1D spectra. n/d: value not determined due to resonance overlap.
Table 5 lists the temperature coefficients (Δδ/ΔT) of the exchangeable GalNAc amide proton chemical shifts in CN4, CN6, CN8 and CN10, which is a useful indicator of inter-residual hydrogen bonding, as we showed previously.23 The chemical shifts varied linearly with temperature in each case. With respect to all the unsulfated chondroitin oligosaccharides investigated, the Δδ/ΔT values were in the range −6.8 to −8.4 ppb/°C.
Table 5.
Amide proton chemical shifts and temperature coefficients for unsulfated chondroitin (CN) and hyaluronan (HA) oligosaccharides of length 4, 6, 8, and 10
| 5 °C | 25 °C | 35 °C | CN | HAa | CN–HA | ||
|---|---|---|---|---|---|---|---|
| dp | Residue | δHN | δHN | δHN | ΔδHN/ΔT | ΔδHN/ΔT | ΔδHN/ΔT |
| 4 | N1α | 8.3 | 8.2 | 8.1 | −8.4 | −9.1 | 0.7 |
| N1β | 8.4 | 8.3 | 8.2 | −7.4 | −7.6 | 0.2 | |
| N3 | 8.0 | 7.9 | 7.8 | −7.2 | −6.9 | −0.3 | |
| 6 | N1α | 8.3 | 8.2 | 8.1 | −8.0 | −9.1 | 1.1 |
| N1β | 8.4 | 8.3 | 8.2 | −7.0 | −7.6 | 0.6 | |
| N3 | 8.2 | 8.1 | 8.0 | −6.9 | −6.9 | 0.0 | |
| N5 | 8.0 | 7.9 | 7.8 | −6.8 | −6.7 | −0.1 | |
| 8 | N1α | 8.3 | 8.2 | 8.1 | −7.9 | n/d | n/d |
| N1β | 8.4 | 8.3 | 8.2 | −7.0 | n/d | n/d | |
| N3 | n/d | n/d | n/d | n/d | n/d | n/d | |
| N5 | n/d | n/d | n/d | n/d | n/d | n/d | |
| 10 | N7 | 8.1 | 7.9 | 7.8 | −6.9 | n/d | n/d |
| N1α | 8.3 | 8.2 | 8.1 | −8.0 | −9.1 | 1.1 | |
| N1β | 8.4 | 8.3 | 8.2 | −7.0 | −7.6 | 0.6 | |
| N3 | n/d | n/d | n/d | n/d | n/d | n/d | |
| N5 | n/d | n/d | n/d | n/d | n/d | n/d | |
| N7 | n/d | n/d | n/d | n/d | n/d | n/d | |
| N9 | 8.1 | 7.9 | 7.8 | −6.9 | −6.9 | 0.0 | |
dp: the degree of polymerisation. CN–HA: the difference between CN and HA values. δHN values are reported in units of ppm, ΔδHN/ΔT values are reported in units of ppb/°C.
HA data from Blundell and Almond.23 Standard error in temperatures: ±0.2 °C. Error in 1H chemical shifts ±0.001 ppm. Error in 15N chemical shifts ±0.003 ppm. Error in ΔδHN/ΔT ≈ 0.1 ppb/°C.
2.3. A putative 3D-structure for the chondroitin sulfate backbone
A [1H, 1H]-NOESY spectrum of a natural abundance isotope CN6 sample was recorded at 900 MHz and used to measure nuclear Overhauser enhancements (NOEs) between protons close in spatial proximity. The ultra-high-field spectrum was used to gain extra resolution compared to 600 MHz and also to shift our NOE data further from the zero-NOE point. At 900 MHz all the NOEs were observed to be negative (i.e., had the same sign as the diagonal). We were particularly cautious only to include high-quality unambiguous NOE data in our structure calculations (see Section 4). Therefore, NOESY 1H–1H cross-peaks resulting from neighbouring protons and suffering from 3- and 4-bond COSY artefacts were not used. Table 6A lists the eight conformationally dependent (inter-residual) NOEs used in the structure calculations, binned into strong (1.8–2.7 Å) and medium (2.8–3.8 Å) distance categories. Two of the NOE cross-peaks that were used to restrain conformationally dependent distances in the structure calculations are illustrated in Figure 4. The overlapped intensities of the inter-residual β(1→4) cross-peaks (Fig. 4, panel A) were observed to be weaker than the overlapped β(1→3) cross-peaks (Fig. 4, panel B) due to the 3:2 ratio of β(1→3):β (1→4) glycosidic linkages in CN6 and a normalisation factor was applied. Table 6B lists the satisfactory result of back-predicting the five conformationally independent (intra-residual) reference proton–proton distances, used for calibration, from their intensities (see Section 4).
Table 6.
(A) Conformationally dependant NOEs employed in the structure calculations, (B) measured and back-predicted intra-residual reference proton–proton distances
| Linkage | GalNAc | GlcA | NOE intensity |
|---|---|---|---|
| A | |||
| U2:N1 (β1->3) | HN | H-1 | Medium |
| H-3 | H-1 | Strong | |
| N3:U2 (β1->4) | H-1 | H-4 | Strong |
| U4:N3 (β1->3) | HN | H-1 | Medium |
| H-3 | H-1 | Strong | |
| N5:U4 (β1->4) | H-1 | H-4 | Strong |
| U6:N5 (β1->3) | HN | H-1 | Medium |
| H-3 | H-1 | Strong | |
| Residue | f2 | f1 | r (std) | r (pred) | r (pred-std) |
|---|---|---|---|---|---|
| B | |||||
| N-1α | H-1 | H-3 | 3.8 | 3.9 | 0.1 |
| N-1α | H-1 | HN | 3.5 | 3.9 | 0.4 |
| N-3β | H-1 | HN | 2.4 | 2.3 | 0.1 |
| N-3β | HN | H-2 | 3.0 | 3.0 | 0.0 |
| U-4β | H-5 | H-1 | 2.5 | 2.6 | 0.1 |
All distances (r) are reported in units of Å. f1 and f2: frequencies by which the [1H, 1H]-NOESY cross-peak was defined. std: distances measured from the standard energy minimised geometry of CN6 generated using online GLYCAM tools.58 pred: values predicted using the derived model relating intensity to distance discussed in Section 4. NOEs derived from non-α cross-peaks were overlapped and normalised accordingly.
Figure 4.

Two conformationally dependent NOEs used in the structure calculations: (A) the β(1→4) glycosidic linkage NOE, and (B) the β(1→3) glycosidic linkage NOE. Data were obtained from a 900 MHz [1H, 1H]-NOESY spectrum of natural abundance isotope CN6 with the axes transposed. The CN6 chemical shift assignments are available as Supplementary data. The sample was at pH 6.0, 25 °C in 5–10% (v/v) D2O and referenced relative to δDSS (1H). Standard error: 1H ±0.001 ppm.
Figure 5 illustrates the 25 lowest energy 3D-models of CN6 (10% of the total number generated), calculated using a restrained molecular dynamics simulated annealing protocol (described in Section 4). This ensemble has been deposited in the PDB with accession code 2KQO. It can be seen that the conformations within this most energetically favourable subset were very similar. Models ranked 2–24 in terms of total energy exhibited all atom root-mean-square-deviation values from the lowest energy conformer in the range 0.3–0.7 Å, confirming this. Distance penalties (deviations from Section 4) were negligible due to very small restraint violations for all model conformers (<0.03 Å in all cases).
Figure 5.

Superposition of the 25 most energetically favourable CN6 model conformers, PDB code 2KQO (following 750 ns restrained simulated annealing). The highlighted distances (Å) were measured from the lowest energy conformer and corresponded to the 1H–1H distance restraints.
Of note in Figure 5 is that all the derived 3D-models adopted an extended conformation. Furthermore, it was found that the pyranose residues remained in the 4C1 conformation, as expected following the application of torsional pucker-related restraints in the structure calculations (see Section 4 for details). As mentioned previously, to help assess the validity of lowest energy 3D-models, we calculated vicinal 3JH,H coupling constants from H–C–C–H torsions. For this we used the Karplus equations of Altona and Haasnoot,22 which were modified according to the substituents. The calculated values for the first four residues of the CN6 3D-model were in general agreement with the observed CN4 values (see Table 3). Furthermore, the observed and calculated (using the coefficients from Mobli and Almond,24 parenthesised) 3JHN,H2 scalar-coupling values of the CN6 lowest energy 3D-model were as follows (Hz): βN1 8.98 (10.5), βN3 9.75 (7.8) and βN5 n/d (7.8), Table 3. This result infers each of the hexosamine acetamido H2–C2–NH–HN dihedrals of the CN6 3D-model to be trans orientated (with respect to H-2) and is consistent with the observed experimental NMR data.
Table 7 shows the average and standard deviation measurements for each glycosidic torsion in the ensemble illustrated in Figure 5. This analysis demonstrates that the reducing-end terminal β(1→3) linkage exhibited the most variability. The ensemble also showed evidence for inter-residual hydrogen bonding. For instance, with respect to the lowest energy model conformer, the GlcA O2 hydroxyl hydrogen was oriented towards, and was measured to be 2.0 Å from, the GalNAc carbonyl oxygen in two of the three β(1→3) linkages (U6:N5 and U4:N3). The β(1→4) GalNAc amide proton was hydrogen bonded to an adjacent GlcA carboxyl oxygen, with a measured distance of 2.0 Å, in both instances of this linkage.
Table 7.
Average glycosidic torsions in the ensemble of 25 low energy model CN6 conformers
| β (1→3) | β (1→4) | β (1→3) | β (1→4) | β (1→3) | |
|---|---|---|---|---|---|
| Torsion | U2–N1 | N3–U2 | U4–N3 | N5–U4 | U6–N5 |
| φ | −73 (2) | −73 (0) | −73 (0) | −73 (0) | −72 (0) |
| ψ | 108 (8) | −118 (1) | 107 (0) | −116 (0) | 109 (0) |
Torsion values are reported in units of degrees. Standard deviations are given in parentheses.
3. Discussion
3.1. Comparison with previous NMR data on K4, chondroitin and chondroitin sulfate
Oligosaccharides of defructosylated K4 (non-15N-enriched) have been prepared previously using a similar method to that described here.25,26 Our protocols yielded oligosaccharides of a similar quality and quantity (even in minimal media) and we additionally confirmed their exact chemical composition by the absence of unassigned resonances in [1H, 13C]-HSQC NMR spectra (previous studies used HPLC and mass spectrometry). To our knowledge, NMR studies to date on K4 polysaccharide and its defructosylated derivative have been restricted to polymeric material using basic 1D NMR spectra,27 which were significantly less resolved than the spectra presented here and were not fully assigned. In spite of these deficiencies, our chemical-shift assignments presented in Table 1, where comparable, are in general agreement.
Due to the fact that chondroitin sulfation sites are characterised by an approximate 0.5 ppm downfield shift of H-4 and H-6 resonances for C-4 and C-6 sulfation, respectively,28 it was possible to further verify that we had produced unsulfated material by straightforward comparison of our chemical-shift assignments with the literature data. Recently published assignments for CS octasaccharides, acquired using ultra-high-field 900 MHz spectra, for the 6S-GalNAc-1β H6R/H6S atoms were 4.14 and 4.19 ppm.29 These values are indeed downfield by the expected order of magnitude (value parenthesised) of our reported observations at 3.79 (0.35) and 3.83 (0.36) ppm, respectively. The 4S-GalNAc-3 H-4 resonance, 4.18 ppm,29 was also downfield of our value, 3.542 ppm, by this order of magnitude (0.64 ppm).
In light of these comparisons with the literature data that are consistent with expectations and which support that unsulfated K4 material was produced and purified in this work, we propose that our assignments could be used with confidence to predict the chemical shifts for any sulfation pattern in any of the CS variants. Indeed, by providing a full triple-resonance assignment and vicinal 3JH,H scalar couplings for the homogenous CN4 sample, many sequence-specific 1JH,N and 3JHN,H2 scalar couplings and temperature coefficients for longer homogeneous oligosaccharides and a 3D-model of natural abundance isotope CN6 (vide infra), this work contributes a major advancement in our knowledge of unsulfated chondroitin properties.
3.2. Comparison with hyaluronan
Owing to the paradoxical structural similarity and significant functional differences of chondroitin (CN) and hyaluronan (HA), we undertook various direct comparisons of our data for CN4 and previous literature data for HA4. Resolved CN4 and HA4 1H and 13C chemical shifts are compared in Table 1. Values differing by more than 0.5 ppm are highlighted. The CN4 hexosamine 4-position 1H chemical shifts were downfield (deshielded) compared to the HA4 values, by approximately 0.6 ppm. This observation was understood to be the manifestation of the different stereochemistries at this site. By inspection of Table 1, it was apparent that the CN4 hexosamine 13C chemical shifts were comparatively more sensitive to this structural perturbation than the 1H values. Significant differences in 13C chemical shifts (between CN4 and HA4) were evident in all hexosamine 13C atoms except C-1, notably the ring carbon furthest from H-4. In contrast, the C-1 atoms of both GlcA residues were shifted downfield by approximately 1 ppm in CN4 relative to HA4. This observation suggests that the stereochemical (axial/equatorial) hydroxyl rearrangement at C-4 exerts an influence on the neighbouring sugar residue, perhaps by electronic effects that are propagated through either the glycosidic linkage or hydrogen bonds.
Vicinal three-bond proton–proton (3JH,H) coupling constants can report on carbohydrate ring conformation. By inspection of Table 3, the effect of hexosamine 4-position epimerisation, as expected, resulted in the 3J3,4 and 3J4,5 coupling constants being approximately 5-8 Hz smaller in CN4 than in HA4. This was consistent with the small scalar coupling and gauche torsions (≈60°) in GalNAc residues of CN relative to the large scalar coupling and trans torsions (≈180°) in the N-acetyl-d-glucosamine (GlcNAc) residues of HA. The observed CN values were consistent with the 4C1 chair conformations of both GalNAc and GlcA, thereby justifying the use of 4C1 torsional restraints in the CN6 structure calculations (see Section 4). The 1JH,N and 3JHN,H2 scalar couplings of CN (Table 4) and HA oligosaccharides were very similar. For comparison, the 3JHN,H2 values for CN4 and HA430 (parenthesised) were 9.39 (9.47), 9.69 (9.70) and 9.75 (9.68) Hz for the hexosamine residues N1α, N1β and N3, respectively. This observation infers that both the unsulfated GAGs share a very similar geometry about this acetamido H2–C2–NH–HN torsion in an aqueous solution.
Temperature coefficients (Δδ/ΔT) of exchangeable-proton (e.g., amide and hydroxyl) chemical shifts correlate with the presence or absence of both intra- and inter-molecular through-space interactions.31–34 The Δδ/ΔT values for CN oligosaccharides are compared with previous work on HA23 in Table 5. Measurements larger than ±3 ppb/°C for amide protons typically denote a lack of (intra-molecular) hydrogen bonding.35 In common with the HA, the Δδ/ΔT values for the CN oligosaccharides were only slightly less than those for amide protons in free exchange with water (≈−11 ppb/°C).23 This observation leads us to conclude that the inter-residual hydrogen bonds observed in our 3D-model of CN6 are not persistent but rather transient and short-lived in an aqueous solution.
3.3. Analysis of an NMR-based 3D-structural model of chondroitin
Due to severe overlap of resonances in carbohydrate NMR spectra there are frequently not enough NOE data to allow complete structure determination.36 This phenomenon is exacerbated in GAGs, which have high chemical degeneracy due to their disaccharide repeats. Therefore, despite the use of an ultra-high-field 900 MHz [1H, 1H]-NOESY spectrum, our data still suffered from a resonance overlap.
The experimental data were measured and used to generate physically allowed 3D-models of CN6 for comparison with the literature data on CS and HA. Due to the low number of unambiguous inter-residual [1H, 1H]-NOESY cross-peaks employed in the structure calculations, they should be considered semi-quantitative. Despite this caveat, to our knowledge this work comprises the most thorough NMR-based 3D-structural study of the unsulfated chondroitin backbone to date. We therefore considered it important to compare the inter-residual geometries of our low energy model conformers to those from HA and variously sulfated CS species for which the 3D-structure has been determined in the literature. For our analysis we used the IUPAC definition for the glycosidic phi (φ) and psi (ψ) torsions: φ1–4 = O5(N)–C1(N)–O1(N)–C4(U), ψ1–4 = C1(N)–O1(N)–C4(U)–C5(U) [GalNAc–GlcA β1→4 linkages] and φ1–3 = O5(U)–C1(U)–O1(U)–C3(N), ψ1–3 = C1(U)–O1(U)–C3(N)–C4(N) [GlcA–GalNAc β1→3 linkages].
Presently, most 3D-structures of CN and CS comprise short oligosaccharides co-crystallised with GAG-degrading lyases37–41 or hydrolases.42 To our knowledge, apart from the current work, there is just one other aqueous NMR study of homogeneous unsulfated chondriotin samples,27 which did not include through-space NOE data. A free polymer structure of chondroitin-4-sulfate (CS-A), determined by X-ray fibre diffraction, is available43 and recently several CS oligosaccharides have been studied by NMR. Chemical shifts and 2D NMR data are available for CS di-,44 tri-,45 tetra-,44,46 hexa-45 and octasaccharides.47 However, two combined NMR and molecular modelling studies in particular have provided the best atomistic structural insights: one of a CS pentasaccharide employing 13C -isotopic labelling28 and one study of five CS octasaccharides.29 We therefore chose these structures, two theoretical studies48,49 and the small molecule and protein-bound structures (both determined crystallographically) for comparison with our data. We also discuss our structure with reference to the solution conformation of HA850 (PDB code 2BVK).
By inspection of Table 8, with respect to the β(1→4) linkage glycosidic torsions, our data differ at most by 7° (in both φ and ψ) from all previous studies considered with the exception of the X-ray crystallographic data (the small molecule and the enzyme-bound conformation). It has been speculated previously that crystal packing and the presence of Ca2+ in the small molecule structure likely explain its deviation from other literature values considered here.28 Indeed, compared to X-ray crystallography, the NMR method has the major advantages of allowing insight into biologically relevant (aqueous) and dynamical aspects of carbohydrate structural biology, while being free from crystal-packing artefacts. With respect to the β(1→3) linkage, and disregarding the crystallographic data, the φ1–3 values of our 3D-model are again similar to all other CN, CS and HA data considered, differing at most by 11°.
Table 8.
Comparison of glycosidic torsions in the CN6 model ensemble with published CS, CN and HA 3D-structures
| Structure | dp | Torsion | β(1→4) | β(1→4) ABS ΔCN6 |
β(1→3) | β(1→3) ABS ΔCN6 |
|---|---|---|---|---|---|---|
| NMR/simulation (CN6) | 6 | φ | −73 | — | −72 | — |
| ψ | −117 | — | 108 | — | ||
| NMR/simulation (CS5)28 | 5 | φ | −67 | 6 | −61 | 11 |
| ψ | −124 | 7 | 109 | 1 | ||
| X-ray fibre (CS)43 | 4 | φ | −98 | 25 | −80 | 8 |
| ψ | −174 | 57 | 107 | 1 | ||
| X-ray chondroitinase B (CS2)63 | 2 | φ | −69 | 4 | −89 | 17 |
| ψ | −180 | 63 | 108 | 0 | ||
| Simulation (MM3, CS2)49 | 2 | φ | −79 | 6 | −79 | 7 |
| ψ | −111 | 6 | 90 | 18 | ||
| Simulation (CHARMM, CN4)48 | 4 | φ | −70 | 3 | −70 | 2 |
| ψ | −120 | 3 | 90 | 18 | ||
| NMR/simulation (CS8)29 | 8 | φ | −80 | 7 | −80 | 8 |
| ψ | −110 | 7 | 90 | 18 | ||
| NMR (HA8)50 | 8 | φ | −71 | 4 | −68 | 8 |
| ψ | −116 | 7 | 129 | 20 | ||
Torsion values are reported in units of degrees. dp: the degree of polymerisation. The φ and ψ values of CN6 were averaged to facilitate comparison. ABS ΔCN6: absolute deviation from the CN6 value. The table was adapted from Yu et al.28
The largest differences in glycosidic linkage geometries were observed in the ψ1–3 torsions. Again, excluding the X-ray data, our values for this torsion were most similar to those of the combined NMR and molecular modelling study of a CS pentasaccharide,28 which employed residual-dipolar-coupling-derived orientational restraints. This comparison infers that sulfation at the hexosamine 4-position has little effect on the ψ1–3 torsion. Our ψ1–3 torsion data for the CN6 model differed most significantly from the solution structure of HA8.50 Both the sign and magnitude of this difference are consistent with predictions derived from a previous molecular modelling study. Almond and Sheehan48 hypothesised that the ψ1–3 torsion value in CN would be approximately 30° less than that in HA, due to the lack of a hydrogen bond (and incorporation of a dynamic water bridge) between the hexosamine OH-4 atom and the glucuronic acid O-5 atom across the β(1→3) linkage but that the β(1→4) linkage would remain largely unchanged. The predicted sign and magnitude of the ψ1–3 torsion difference in CN and HA is largely consistent with our data (cf. the ψ1–3 torsions of CN6 and HA8 in Table 8).
Figure 6 compares β(1→3) linkage geometries from the CS pentasaccharide (panel A),28 the central linkage of the 3D-model of CN6 generated in this work (panel B) and in the aqueous 3D-structure of hyaluronan (panel C).50 By inspection, it is clear that the unsulfated chondroitin O4 hydroxyl hydrogen, as predicted, interacts much less strongly with the neighbouring GlcA residue O5 atom, if at all, compared to that in HA (cf. Fig. 6 panels B and C). It is therefore much more exposed to solvent than in HA.
Figure 6.
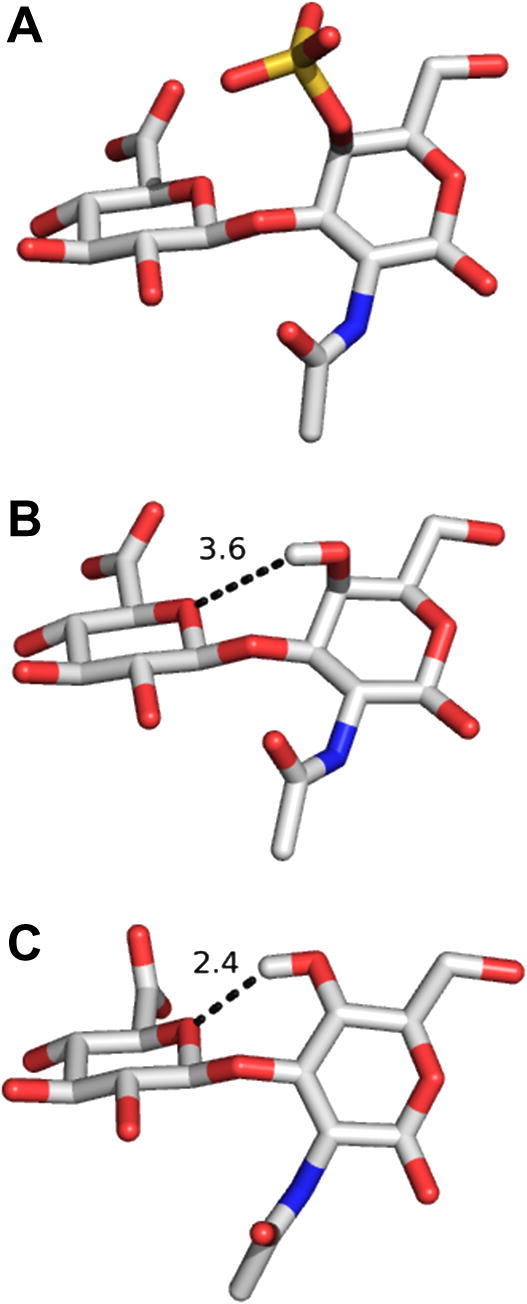
Comparison of NMR-based β(1→3) linkage geometries for: (A) chondroitin-4-sulfate, (B) unsulfated chondroitin, and (C) hyaluronan. Geometries from: (A) Yu et al.,28 (B) the lowest energy 3D-model of CN6 in this work, and (C) Almond et al.50 For clarity, all hydrogen atoms are hidden except for OH-4. Indicated distances (Å) are between GalNAc/GlcNAc OH-4 and GlcA O5 atoms.
We also note that the glycosidic linkage geometry in heparin is hypothesised to be unaffected by sulfate substituents.51 Although all CS structures in Table 8 were sulfated at the GalNAc 4-position, analysis of this dataset leads us to a similar conclusion, that the only significant differences between our CN6 3D-models and published structures of CS (i.e., the ψ1–3 torsions in the range 11–18°) may also not be attributable to GalNAc 4-position sulfation but rather to differential solvation. Therefore, we now hypothesise that chondroitin is amenable to sulfation because the GalNAc residue of both OH-4 and OH-6 atoms are available (solvent exposed). In contrast, the hyaluronan GlcNAc 4-hydroxyl may not be suited to sulfation because it is involved in an intra-molecular hydrogen bond with the adjacent sugar residue (4-sulfation would likely disrupt the characteristic 3D-structure of hyaluronan).
In summary, the 3D-structure of the unsulfated chondroitin backbone represents a significant milestone in understanding the biological function of CS and CSPGs in the extracellular matrix. In particular, it provides an experimentally based 3D-structural platform for the investigation of all CS sulfation patterns and their interactions with proteins in physiological processes (e.g., neuronal development and cellular signalling) and disease pathologies (e.g., atherosclerosis and cancer). The 3D-model is also the basis of structural and computational strategies for developing new medicines and medical devices. In order to realise these objectives, we are working towards coarse-grained models of CS and CSPGs, which will link our microscopic 3D-structural data to macroscopic biological observations.
4. Experimental
4.1. Oligosaccharide preparation
The K4 polysaccharide was produced from cultures of the E. coli (05:K4:H4) strain in much the same way as described previously for the K5 antigen.21 The K4 serotype was confirmed by polymerase chain reaction (PCR) amplification of the kfoC gene encoding the K4 chondroitin polymerase gene using the primers 5′-CGGGATCCCGATGAGTATTCTTAATCTAAG3-3′ and 5′-GGAATTCCGGCCAGTCTACATGTTTATCA-3′. The nucleotide sequence of the PCR amplicon confirmed the presence of the kfoC gene. Bacteria were cultured to late logarithmic phase on M9-minimal media. Cells used as the source of 15N-enriched material were cultured on media containing 2.5 g/l 15N-ammonium chloride (Spectra Stable Isotopes, Columbia, MD) as the only nitrogen source. In the current work 3 g/l ferrous sulfate heptahydrate (Sigma Aldrich) was added and the glucose component was raised from 20% to 60% to increase productivity in minimal media. The K4 polysaccharide was defructosylated by acid treatment in a slightly modified version of an existing protocol.52 Whilst stirring at room temperature the pH was reduced to 3.0 (instead of 1.5) using 0.25 M HCl. The solution was then heated in an oil bath for 45 min at 85 °C (instead of 30 min at 80 °C). After cooling the pH was brought to 7.0 with 0.25 M sodium hydroxide and then dialysed against water for a further 24 h. The dialysed sample was lyophilised to yield defructosylated K4 polysaccharide. Digestion was achieved as in previous work.20 Approximately 10 mg of the defructosylated polysaccharide was dissolved in 5 ml of digest buffer (150 mM NaCl and 100 mM NaAc) and adjusted to pH 5.2 with glacial acetic acid (Fisher Scientific). Ovine Testicular hyaluronidase (100 KU, Calbiochem, Darmstadt, Germany) was added and incubated in a water bath for 3 h at 37 °C. The reaction was stopped by boiling for 10 min. Natural abundance isotope and 15N-enriched oligosaccharides of length 4, 6, 8 and 10 were separated (using anion-exchange chromatography) and desalted, as described previously.21
4.2. NMR sample preparation
Oligosaccharide samples for NMR spectroscopy were prepared from lyophilised material reconstituted in 500 μl MilliQ water comprising: 10% (v/v) D2O, 0.02% (w/v) azide (NaN3) 0.3 Mm and 5% DSS (4,4-dimethyl-4-silapentane-1-sulfonic acid). Approximate sample dry weights (mg) were: natural abundance isotope CN6, 6.6 and 15N-enriched CN4, 6.2; CN6, 8.2; CN8, 1.8; CN10, 7.6. Samples were adjusted to pH 6.0 to allow the observation of amide protons. The final concentration of all samples was calculated to be in the range 5–10 mM.
4.3. NMR spectroscopy
All spectra, with the exception of the temperature coefficient data, were recorded at 25 °C. Through-bond experiments were conducted with a 1H frequency of 600 MHz on a Bruker spectrometer equipped with a z-gradient TXI cryoprobe. The 15N-enriched tetra- and hexasaccharide [1H]-1D spectra were recorded with 16,384 complex points (all following numbers of points are complex), an acquisition time of 2280.7 ms and a dwell time of 69.6 μs. At 900 MHz (Varian INOVA 900), these data were recorded with 32,768 points, an acquisition time of 2949.17 ms and a dwell time of 45.5 μs. No 15N-decoupling was applied during acquisition.
The heteronuclear [1H, 13C]-HSQC and [1H, 13C]-HMBC spectra were standard experiments recorded on natural abundance tetra- and hexasaccharides. The [1H, 15N]-HSQC spectra were collected with acquisition times of 584.96 ms and 4096 points for 1H and acquisition times of 266.67 ms and 160 points for 15N. The dwell time and carrier frequency were set to 71.4 μs and 122.75 ppm, respectively, for these experiments. 15N-decoupling was applied during acquisition.
A 2D [1H, 1H]-NOESY spectrum of the unlabelled CN6 sample was recorded with a 1H frequency of 900 MHz and a mixing time of 600 ms seconds, known to be appropriate from our previous work on HA samples of the same length.20,30 The Varian INOVA 900 MHz NMR Spectrometer was from the Henry Wellcome Building for Biomolecular Spectroscopy, University of Birmingham, UK. A sweep width of 11,000 Hz was used in both dimensions and the respective number of points collected in the direct and indirect dimensions were 2048 and 192.
4.4. NMR data processing, referencing and analysis
Spectra were processed with NMRPipe53 and analysed with Sparky54 and Analysis.55 Proton chemical shifts were referenced relative to internal DSS. The heteronuclei were referenced indirectly. As detailed previously,20,56,57 appropriate linear prediction, window functions and zero-filling were used to achieve the maximum possible resolution from each dataset.
4.5. Structure calculations
Five conformationally independent reference NOE intensities (from cross-peaks of protons in fixed geometric arrangement, Table 6B) were used to parameterise a model relating cross-peak intensity (I) to proton–proton distance (r) using the relationship . The constant of proportionality (k) was then derived from a linear plot of and intensity (I) for the five reference NOEs. This was employed to compute distance restraints for the eight conformationally dependent NOEs (Table 6A) which were then used to bootstrap the structure calculations described below.
The structure and energy minimised starting conformation for CN6 was generated using online glycam tools58 and then subjected to 250 rounds of restrained molecular dynamics simulated annealing comprising 3 ns each (750 ns in total) using AMBER.59 Non-periodic self-guided Langevin dynamics was employed; the collision frequency (velocity relaxation) term was set to 1 ps-1. All simulations employed a 1 fs time step and a Leapfrog integration algorithm.
Parameters of the glycam 0660 force-field were assigned to the hexasaccharide using the AMBER59 tool LEaP. As in similar previous work,61 force constants of 10 kcal/mol/Å2 and 100 kcal/mol/radians2 were applied to the eight NOE distance restraints and six pucker-related torsional restraints of each pyranose residue, respectively. The torsional restraints (defined on the ring heavy atoms), which precluded the formation of non-4C1 ring conformations during high temperature dynamics, were set alternately to 60 ± 20° and −60 ± 20°. All restraints were applied fully during heating, holding and subsequent cooling phases of molecular dynamics.
Due to the fact that explicit solvent is incompatible with the high temperatures inherent in simulated annealing, a modified generalised born continuum model62 was used to simulate the dielectric screening effect of water. An 18.0 Å cut-off was employed for long-range electrostatic and van der Waals interactions. The shake algorithm was applied to all bonds involving hydrogen atoms. Energetic and geometric data were recorded each ps.
The starting conformation was allowed to evolve from its initial configuration during 1 ns dynamics, throughout which it was heated linearly from 1 K to 500 K. Following thermalisation, 1 ns holding dynamics was done at 500 K, and the hexasaccharide was thereby allowed to explore regions of conformational space inaccessible at room temperature. The simulation was subsequently cooled linearly to 0 K for a further 1 ns. Final structures were geometry optimised (without restraints) using 5000 steps of steepest-descent energy minimisation followed by 5000 steps of conjugate gradient energy minimisation. Final energies were evaluated by a single point calculation using the glycam 0660 force-field potential.
Acknowledgements
We would like to gratefully acknowledge The Wellcome Trust for financial support (grant number 075489). We thank Dr. Charles Blundell and Dr. Sara Whittaker for useful discussions.
Footnotes
Supplementary data (resolved 1H and 13C assignments for residues N-acetyl-d-galactosamine-1 to d-glucuronic acid-4 of the 15N-enriched unsulfated chondroitin hexasaccharide) associated with this article can be found, in the online version, at doi:10.1016/j.carres.2009.11.013.
Supplementary data
Resolved 1H and 13C assignments for residues N-acetyl-d-galactosamine-1 to d-glucuronic acid-4 of the 15N-enriched unsulfated chondroitin hexasaccharide.
References
- 1.Imberty A., Lortat-Jacob H., Perez S. Carbohydr. Res. 2007;342:430–439. doi: 10.1016/j.carres.2006.12.019. [DOI] [PubMed] [Google Scholar]
- 2.Bishop J.R., Schuksz M., Esko J.D. Nature. 2007;446:1030–1037. doi: 10.1038/nature05817. [DOI] [PubMed] [Google Scholar]
- 3.Rawat M., Gama C.I., Matson J.B., Hsieh-Wilson L.C. J. Am. Chem. Soc. 2008;130:2959–2961. doi: 10.1021/ja709993p. [DOI] [PMC free article] [PubMed] [Google Scholar]
- 4.Gama C.I., Tully S.E., Sotogaku N., Clark P.M., Rawat M., Vaidehi N., Goddard W.A., 3rd, Nishi A., Hsieh-Wilson L.C. Nat. Chem. Biol. 2006;2:467–473. doi: 10.1038/nchembio810. [DOI] [PubMed] [Google Scholar]
- 5.Raman R., Sasisekharan V., Sasisekharan R. Chem. Biol. 2005;12:267–277. doi: 10.1016/j.chembiol.2004.11.020. [DOI] [PubMed] [Google Scholar]
- 6.Sugahara K., Mikami T. Curr. Opin. Struct. Biol. 2007;17:536–545. doi: 10.1016/j.sbi.2007.08.015. [DOI] [PubMed] [Google Scholar]
- 7.Malavaki C., Mizumoto S., Karamanos N., Sugahara K. Connect. Tissue Res. 2008;49:133–139. doi: 10.1080/03008200802148546. [DOI] [PubMed] [Google Scholar]
- 8.Sugahara K., Mikami T., Uyama T., Mizuguchi S., Nomura K., Kitagawa H. Curr. Opin. Struct. Biol. 2003;13:612–620. doi: 10.1016/j.sbi.2003.09.011. [DOI] [PubMed] [Google Scholar]
- 9.Lauder R.M. Complement. Ther. Med. 2009;17:56–62. doi: 10.1016/j.ctim.2008.08.004. [DOI] [PubMed] [Google Scholar]
- 10.Place E.S., Evans N.D., Stevens M.M. Nat. Mater. 2009;8:457–470. doi: 10.1038/nmat2441. [DOI] [PubMed] [Google Scholar]
- 11.Galtrey C.M., Fawcett J.W. Brain Res. Rev. 2007;54:1–18. doi: 10.1016/j.brainresrev.2006.09.006. [DOI] [PubMed] [Google Scholar]
- 12.Murrey H.E., Hsieh-Wilson L.C. Chem. Rev. 2008;108:1708–1731. doi: 10.1021/cr078215f. [DOI] [PMC free article] [PubMed] [Google Scholar]
- 13.Abe S., Hirose D., Kado S., Iwanuma O., Saka H., Yanagisawa N., Ide Y. Anat. Sci. Int. 2009 doi: 10.1007/s12565-009-0039-9. [DOI] [PubMed] [Google Scholar]
- 14.Tracy B.S., Avci F.Y., Linhardt R.J., DeAngelis P.L. J. Biol. Chem. 2007;282:337–344. doi: 10.1074/jbc.M607569200. [DOI] [PMC free article] [PubMed] [Google Scholar]
- 15.Wormald M.R., Petrescu A.J., Pao Y.L., Glithero A., Elliott T., Dwek R.A. Chem. Rev. 2002;102:371–386. doi: 10.1021/cr990368i. [DOI] [PubMed] [Google Scholar]
- 16.Duus J.O., Gotfredsen C.H., Bock K. Chem. Rev. 2000;100:4589–−+. doi: 10.1021/cr990302n. [DOI] [PubMed] [Google Scholar]
- 17.DeAngelis P.L. Glycobiology. 2002;12:9R–16R. doi: 10.1093/glycob/12.1.9r. [DOI] [PubMed] [Google Scholar]
- 18.Olofsson S., Bergstrom T. Ann. Med. 2005;37:154–172. doi: 10.1080/07853890510007340. [DOI] [PubMed] [Google Scholar]
- 19.Rusnati M., Vicenzi E., Donalisio M., Oreste P., Landolfo S., Lembo D. Pharmacol. Ther. 2009 doi: 10.1016/j.pharmthera.2009.05.001. [DOI] [PubMed] [Google Scholar]
- 20.Blundell C.D., DeAngelis P.L., Day A.J., Almond A. Glycobiology. 2004;14:999–1009. doi: 10.1093/glycob/cwh117. [DOI] [PubMed] [Google Scholar]
- 21.Mobli M., Nilsson M., Almond A. Glycoconjugate J. 2008;25:401–414. doi: 10.1007/s10719-007-9081-9. [DOI] [PMC free article] [PubMed] [Google Scholar]
- 22.Altona C., Haasnoot C.A.G. Org. Magn. Reson. 1980;13:417–429. [Google Scholar]
- 23.Blundell C.D., Almond A. Magn. Reson. Chem. 2007;45:430–433. doi: 10.1002/mrc.1969. [DOI] [PubMed] [Google Scholar]
- 24.Mobli M., Almond A. Org. Biomol. Chem. 2007;5:2243–2251. doi: 10.1039/b705761j. [DOI] [PMC free article] [PubMed] [Google Scholar]
- 25.Volpi N. Rapid. Commun. Mass. Spectrom. 2007;21:3459–3466. doi: 10.1002/rcm.3245. [DOI] [PubMed] [Google Scholar]
- 26.Volpi N., Zhang Z.Q., Linhardt R.J. Rapid. Commun. Mass. Spectrom. 2008;22:3526–3530. doi: 10.1002/rcm.3760. [DOI] [PMC free article] [PubMed] [Google Scholar]
- 27.Rodriguez M.L., Jann B., Jann K. Eur. J. Biochem. 1988;177:117–124. doi: 10.1111/j.1432-1033.1988.tb14351.x. [DOI] [PubMed] [Google Scholar]
- 28.Yu F., Wolff J.J., Amster I.J., Prestegard J.H. J. Am. Chem. Soc. 2007;129:13288–13297. doi: 10.1021/ja075272h. [DOI] [PubMed] [Google Scholar]
- 29.Blanchard V., Chevalier F., Imberty A., Leeflang B.R., Basappa K.S., Kamerling J.P. Biochemistry. 2007;46:1167–1175. doi: 10.1021/bi061971f. [DOI] [PubMed] [Google Scholar]
- 30.Blundell C.D., Reed M.A., Almond A. Carbohydr. Res. 2006;341:2803–2815. doi: 10.1016/j.carres.2006.09.023. [DOI] [PubMed] [Google Scholar]
- 31.Andersen N.H., Neidigh J.W., Harris S.M., Lee G.M., Liu Z., Tong H. J. Am. Chem. Soc. 1997;119:8547–8561. [Google Scholar]
- 32.Baxter N.J., Hosszu L.L., Waltho J.P., Williamson M.P. J. Mol. Biol. 1998;284:1625–1639. doi: 10.1006/jmbi.1998.2265. [DOI] [PubMed] [Google Scholar]
- 33.Bekiroglu S., Kenne L., Sandstrom C. J. Org. Chem. 2003;68:1671–1678. doi: 10.1021/jo0262154. [DOI] [PubMed] [Google Scholar]
- 34.Cierpicki T., Otlewski J. J. Biomol. NMR. 2001;21:249–261. doi: 10.1023/a:1012911329730. [DOI] [PubMed] [Google Scholar]
- 35.Dyson H.J., Rance M., Houghten R.A., Lerner R.A., Wright P.E. J. Mol. Biol. 1988;201:161–200. doi: 10.1016/0022-2836(88)90446-9. [DOI] [PubMed] [Google Scholar]
- 36.Bush C.A., Martin-Pastor M., Imberty A. Annu. Rev. Biophys. Biomed. 1999;28:269–293. doi: 10.1146/annurev.biophys.28.1.269. [DOI] [PubMed] [Google Scholar]
- 37.Rigden D.J., Jedrzejas M.J. J. Biol. Chem. 2003;278:50596–50606. doi: 10.1074/jbc.M307596200. [DOI] [PubMed] [Google Scholar]
- 38.Fethiere J., Eggimann B., Cygler M. J. Mol. Biol. 1999;288:635–647. doi: 10.1006/jmbi.1999.2698. [DOI] [PubMed] [Google Scholar]
- 39.Lunin V.V., Li Y.G., Linhardt R.J., Miyazono H., Kyogashima M., Kaneko T., Bell A.W., Cygler M. J. Mol. Biol. 2004;337:367–386. doi: 10.1016/j.jmb.2003.12.071. [DOI] [PubMed] [Google Scholar]
- 40.Huang W.J., Matte A., Li Y.G., Kim Y.S., Linhardt R.J., Su H.S., Cygler M. J. Mol. Biol. 1999;294:1257–1269. doi: 10.1006/jmbi.1999.3292. [DOI] [PubMed] [Google Scholar]
- 41.Huang W.J., Lunin V.V., Li Y.G., Suzuki S., Sugiura N., Miyazono H., Cygler M. J. Mol. Biol. 2003;328:623–634. doi: 10.1016/s0022-2836(03)00345-0. [DOI] [PubMed] [Google Scholar]
- 42.Itoh T., Hashimoto W., Mikami B., Murata K. J. Biol. Chem. 2006;281:29807–29816. doi: 10.1074/jbc.M604975200. [DOI] [PubMed] [Google Scholar]
- 43.Cael J.J., Winter W.T., Arnott S. J. Mol. Biol. 1978;125:21–42. doi: 10.1016/0022-2836(78)90252-8. [DOI] [PubMed] [Google Scholar]
- 44.Huckerby T.N., Lauder R.M., Brown G.M., Nieduszynski I.A., Anderson K., Boocock J., Sandall P.L., Weeks S.D. Eur. J. Biochem. 2001;268:1181–1189. doi: 10.1046/j.1432-1327.2001.01948.x. [DOI] [PubMed] [Google Scholar]
- 45.Huckerby T.N., Nieduszynski I.A., Giannopoulos M., Weeks S.D., Sadler I.H., Lauder R.M. FEBS J. 2005;272:6276–6286. doi: 10.1111/j.1742-4658.2005.05009.x. [DOI] [PubMed] [Google Scholar]
- 46.Kinoshita-Toyoda A., Yamada S., Haslam S.M., Khoo K.H., Sugiura M., Morris H.R., Dell A., Sugahara K. Biochemistry. 2004;43:11063–11074. doi: 10.1021/bi049622d. [DOI] [PubMed] [Google Scholar]
- 47.Huckerby T.N., Lauder R.M., Nieduszynski I.A. Eur. J. Biochem. 1998;258:669–676. doi: 10.1046/j.1432-1327.1998.2580669.x. [DOI] [PubMed] [Google Scholar]
- 48.Almond A., Sheehan J.K. Glycobiology. 2000;10:329–338. doi: 10.1093/glycob/10.3.329. [DOI] [PubMed] [Google Scholar]
- 49.Rodriguez-Carvajal M.A., Imberty A., Perez S. Biopolymers. 2003;69:15–28. doi: 10.1002/bip.10304. [DOI] [PubMed] [Google Scholar]
- 50.Almond A., Deangelis P.L., Blundell C.D. J. Mol. Biol. 2006;358:1256–1269. doi: 10.1016/j.jmb.2006.02.077. [DOI] [PubMed] [Google Scholar]
- 51.Mulloy B., Forster M.J. Glycobiology. 2000;10:1147–1156. doi: 10.1093/glycob/10.11.1147. [DOI] [PubMed] [Google Scholar]
- 52.Lidholt K., Fjelstad M. J. Biol. Chem. 1997;272:2682–2687. doi: 10.1074/jbc.272.5.2682. [DOI] [PubMed] [Google Scholar]
- 53.Delaglio F., Grzesiek S., Vuister G.W., Zhu G., Pfeifer J., Bax A. J. Biomol. NMR. 1995;6:277–293. doi: 10.1007/BF00197809. [DOI] [PubMed] [Google Scholar]
- 54.Goddard T.D., Kneller D.G. University of California; San Francisco: 2006. SPARKY 3. [Google Scholar]
- 55.Vranken W.F., Boucher W., Stevens T.J., Fogh R.H., Pajon A., Llinas M., Ulrich E.L., Markley J.L., Ionides J., Laue E.D. Proteins. 2005;59:687–696. doi: 10.1002/prot.20449. [DOI] [PubMed] [Google Scholar]
- 56.Blundell C.D., Deangelis P.L., Almond A. Biochem. J. 2006;396:487–498. doi: 10.1042/BJ20060085. [DOI] [PMC free article] [PubMed] [Google Scholar]
- 57.Blundell C.D., Reed M.A., Overduin M., Almond A. Carbohydr. Res. 2006;341:1985–1991. doi: 10.1016/j.carres.2006.05.017. [DOI] [PMC free article] [PubMed] [Google Scholar]
- 58.Woods R.J. Complex Carbohydrate Research Center, University of Georgia; Athens, GA.: 2009. glycam Web. [Google Scholar]
- 59.Case D.A., Cheatham T.E., 3rd, Darden T., Gohlke H., Luo R., Merz K.M., Jr., Onufriev A., Simmerling C., Wang B., Woods R.J. J. Comput. Chem. 2005;26:1668–1688. doi: 10.1002/jcc.20290. [DOI] [PMC free article] [PubMed] [Google Scholar]
- 60.Kirschner K.N., Yongye A.B., Tschampel S.M., Gonzalez-Outeirino J., Daniels C.R., Foley B.L., Woods R.J. J. Comput. Chem. 2008;29:622–655. doi: 10.1002/jcc.20820. [DOI] [PMC free article] [PubMed] [Google Scholar]
- 61.Sayers E.W., Prestegard J.H. Biophys. J. 2000;79:3313–3329. doi: 10.1016/S0006-3495(00)76563-5. [DOI] [PMC free article] [PubMed] [Google Scholar]
- 62.Onufriev A., Bashford D., Case D.A. Proteins. 2004;55:383–394. doi: 10.1002/prot.20033. [DOI] [PubMed] [Google Scholar]
- 63.Michel G., Pojasek K., Li Y.G., Sulea T., Linhardt R.J., Raman R., Prabhakar V., Sasisekharan R., Cygler M. J. Biol. Chem. 2004;279:32882–32896. doi: 10.1074/jbc.M403421200. [DOI] [PMC free article] [PubMed] [Google Scholar]
Associated Data
This section collects any data citations, data availability statements, or supplementary materials included in this article.
Supplementary Materials
Resolved 1H and 13C assignments for residues N-acetyl-d-galactosamine-1 to d-glucuronic acid-4 of the 15N-enriched unsulfated chondroitin hexasaccharide.