Abstract
A general purpose pulsed microwave circuit was developed for the purpose of measuring resonator Q by the pulse ring-down method in EPR spectrometers without pulse capability. The circuit was installed and tested in a Bruker X-band EPR bridge. This method and circuit could be adapted for use in a variety of spectrometers operating at various microwave frequencies.
Keywords: quantitative EPR, Q measurement, circuit
INTRODUCTION
Since the EPR signal voltage is proportional to resonator Q (1,2), it is important to know Q to make quantitative EPR measurements (3). Pulsed EPR measurements of short relaxation times require that the resonator Q is low enough that the resonator pulse power ring down does not interfere with the relaxation measurement (4). The resonator Q also filters rapid scan EPR signals if the Q is too high relative to the response times of the spin system (5).
There is a large literature on measurement of cavity Q by various methods and for special conditions. Ginzton described the two fundamental methods, the transient decay method and the determination of the frequency bandwidth of the resonator (6).
The method of measuring the frequency bandwidth of the resonator with a frequency counter was implemented on a Varian E-9 EPR spectrometer by Dalal et al. (7). The method of using a network analyzer for a range of Q values was described by Rinard et al. (8). Modern Bruker EPR spectrometers incorporate this method. The primary difficulty of this type measurement is defining the half-power points relative to an off-resonance level that often is not flat because of non-level power output as a function of frequency, and because of reflections in the spectrometer system.
The transient decay method is commonly used in pulsed EPR spectrometers since the hardware is in place to create the pulses and measure the transient response. The analysis of the response depends on whether the detector is a crystal or a double-balanced mixer (DBM). For a crystal detector, with the power in the range where the crystal output voltage is less than ca. 15–20 mV, the voltage output is linear in microwave power incident on the crystal ( Eq. [1]).
| [1] |
where τ is the ring-down time constant and ν is the resonator frequency. For a DBM biased on the LO side to its specified operating level, the output signals are linear in voltage, not power. For this case, the measurement of Q is:
| [2] |
If the resonator Q is extremely low, the transient decay may be fast enough that one would run into the response time limits of the detection device, or of the monitoring oscilloscope, so one needs to ensure that the measured transient decay is really that of the resonator. For example, one can measure the system response at a frequency away from the resonator frequency or by replacing the resonator with a perfectly reflecting short or open transmission line.
Since the decay should be a single exponential, one need measure only the 1/e point on the decay curve to measure Q. Somewhat more precise measurements, if needed, can be made by fitting an exponential to a multi-point decay curve.
In this paper, we describe a general-purpose Q measurement circuit and a specific implementation that can be added to any EPR spectrometer. It is based on transient response to a pulse, but does not require a high-power microwave amplifier of the sort that is commonly used in pulsed EPR spectrometers. Thus, this circuit is useful for Q measurements in CW and rapid scan EPR spectrometers.
CIRCUIT DISCRIPTION
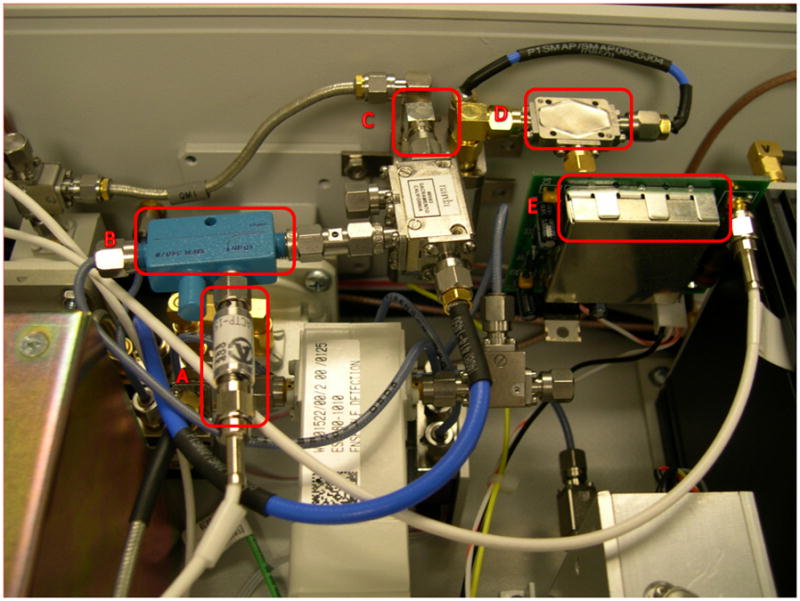
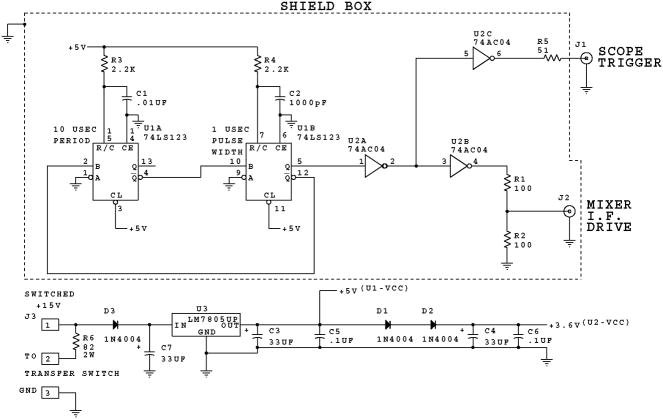
A block diagram of the pulsing circuit as applied to a typical CW or rapid scan spectrometer was created to illustrate the components that were added in the modification (see Figure 1). The transfer switch allows the full 200 mW power from the microwave source to be used in the normal spectroscopy mode, and a lower power to be used for the Q measurements. In a spectrometer where the available source power is less than the power rating of the added mixer, the transfer switch could be eliminated. Figure 2 shows the pulsing circuit schematic diagram. This is a common circuit for producing a pulse train of fixed pulse lengths and a fixed repetition rate using two mono-stable multivibrators (“one-shots”). In the diagram U1A sets the repetition time (ca. 10 microseconds) and U1B sets the pulse length (ca. 1 microsecond). The output is matched to drive a microwave mixer used as a high speed switch. The output impedance is 50 ohms with an open circuit pulse amplitude voltage of ca. 1.5 V and a loaded voltage of ca. 0.75V. This drives the mixer / switch diodes into a saturated ON condition, but does not over-saturate which would cause problems with recovery time. The circuit also supplies a 50 ohm matched trigger signal to trigger an oscilloscope or digitizer. The entire circuit is powered from + 15Vdc which can be switched by a toggle switch placed in a convenient location that enables and disables the circuit. The transfer switch is activated by 24Vdc. The low side of the transfer switch is connected to −15Vdc and resistor R6 in the diagram drops the transfer switch voltage from 30V to 24V. Other implementations are possible using transfer switches operated by 12V or 5V. When the transfer switch is disengaged the microwave path returns to the pre-modification condition and the power is removed from the pulser circuit. The pulser circuit is implemented on a small printed circuit card (dimensions 2.1 in. × 2.4 in.). Table 1 details the components used for X-band implementation. Installation of the circuit in a Bruker E500T bridge is shown in Figure 3.
Figure 1.

Block diagram of the pulsing circuit as applied to a typical CW or rapid scan spectrometer. The components added in the modification are shown in bold.
Figure 2.
Schematic diagram for pulsing circuit.
Table 1.
Components used in the X-band implementation.
| Component | Manufacturer | Part Number |
|---|---|---|
| Circuit card | University of Denver (Figure 2) | EC-17146 |
| Microwave Mixer | Miteq | DM0812LW2 |
| Transfer Switch | MiniCircuits | MTS-18XL-B |
| Directional Coupler | Merrimac | CSM-10M-10G |
| Detector crystal | Advanced Control Components | ACTP-1504PCa |
This detector is listed as having a minimum open circuit sensitivity of 700 mv / mw and a video capacitance of 9 pf. This would translate into a sensitivity of 350 mv / mw and a time constant of 0.22 ns when connected to a 50 ohm load.
Figure 3.

Photograph of the pulsing circuit installed in a Bruker X-band bridge. The crystal detector (A), directional coupler (B), transfer switch (C), microwave mixer (D) and circuit card (E) are shown.
EXPERIMENTAL MEASUREMENTS
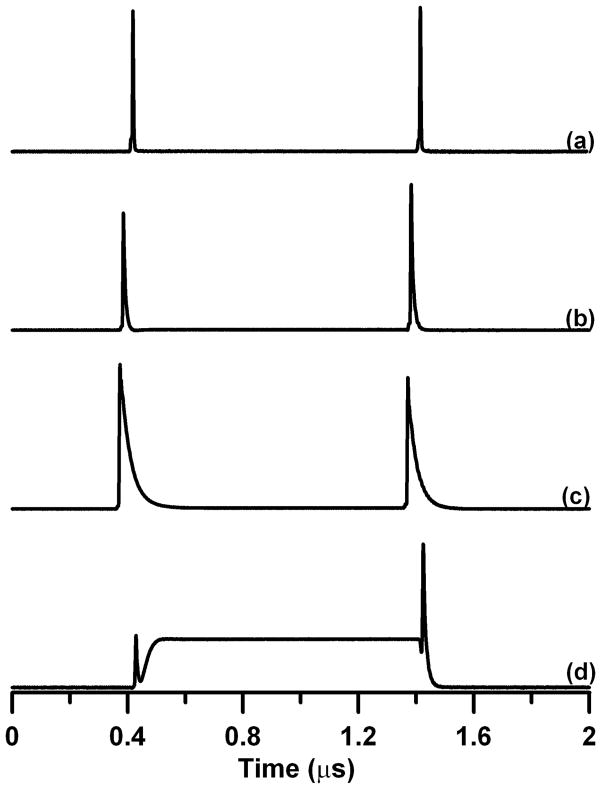
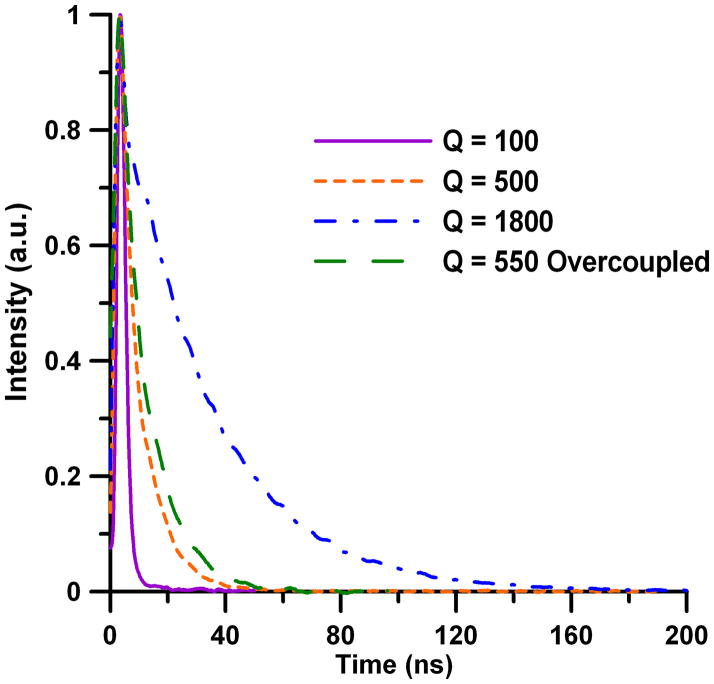
The reflected power ring-down signal was collected with the circuit in an X-band application for a critically coupled resonator with different Q settings and an overcoupled resonator (see Figure 4). The exponential decay of the ring-down signal was zoomed in on the end of the pulse to highlight the differences in the decay for different Q settings (see Figure 5).
Figure 4.
Reflected power ring-down signal obtained with the circuit in the X-band application. (a) Critically coupled resonator with a .16 mm tube of water added to the resonator (Q ≈ 100). (b) Critically coupled resonator with a .08 mm tube of water added to the resonator (Q ≈ 500). (c) Critically coupled resonator with a non-lossy sample in the resonator (Q ≈ 1800). (d) Over coupled resonator with non-lossy sample in the resonator (Q ≈ 550). These waveforms were obtained at a spectrometer power attenuation setting of 15 dB where 0 dB is ca. 200 mw (+23 dBm).
Figure 5.
Reflected power ring-down for several different Q settings, zoomed in on the end of the pulse.
DISCUSSION
Measurements of very low Q values (< 150 for X-band) pose the biggest challenge for the circuit, especially at X-band. We observe an apparent ring-down time constant of 1.2 ns when measuring into a reflecting open circuit with a 400 MHz bandwidth oscilloscope and 0.83 ns with a 500 MHz oscilloscope. These measurements translate to a Q of ca. 75 and 50 respectively at X-band. This would indicate that measurement of resonators with a ring-down time constant of less than about 2.5 ns would not give an accurate Q. This is a Q of ca. 150 at X-band (9.5 GHz), but if implemented on an L-band spectrometer (1.1 GHz) would be a Q of ca. 17 as a lower limit. Similar limitations would occur if the Q measurement were made by the ring-down method with a standard pulsed EPR bridge and high-power microwave amplifier. The present circuit is applicable to tuning low-power systems, such as saturation recovery, rapid scan and CW spectrometers.
In addition to the direct measurement of resonator Q by ring-down, we have found the reflected pulse display useful as a spectrometer tuning aid. When the tuning goal is to achieve the best possible critically coupled match of the resonator, the pulse display gives a highly sensitive reading by observing how close the center of the reflected pulse comes to the baseline. Careful adjustment of the resonator coupling iris and microwave frequency will optimize the display and therefore optimize the critical coupling.
While the specific implementation described here is for an X-band application, the circuit and Q measurement method by ring-down are applicable to a wide variety of spectrometers operating at various microwave frequencies. To implement the circuit at a frequency other than X-band, the mixer, directional coupler and detector would be selected as appropriate for that frequency. The pulser circuit card itself is not specific to any microwave frequency.
Acknowledgments
Funding from National Science Foundation DBI 0753018 and National Institutes of Health NIBIB P41 EB002034 (H. Halpern, PI) is gratefully acknowledged.
References
- 1.Rinard GA, Eaton SS, Eaton GR, Poole CP, Farach HA. Sensitivity in EPR Measurements. In: Poole CP, Farach HA, editors. Handbook of Electron Spin Resonance. Vol. 2. New York: American Institute of Physics; 1994. pp. 1–23. [Google Scholar]
- 2.Rinard GA, Quine RW, Eaton SS, Eaton GR. Frequency Dependence of EPR Sensitivity. In: Bender CJ, Berliner LJ, editors. Biological Magnetic Resonance. Vol. 21. New York: Springer; 2004. pp. 115–154. [Google Scholar]
- 3.Eaton GR, Eaton SS, Barr DP, Weber RT. Quantitative EPR. New York: SpringerWien; 2010. [Google Scholar]
- 4.Mims WB. Electron Spin Echoes. In: Geschwind S, editor. Electron paramagnetic resonance. New York: Plenum Press; 1972. p. 584. [Google Scholar]
- 5.Joshi JP, Eaton GR, Eaton SS. Impact of resonator on direct-detected rapid-scan EPR at 9.8 GHz. Applied Magnetic Resonance. 2005;28(3–4):239–249. [Google Scholar]
- 6.Gintzon EL. Microwave Measurements. McGraw-Hill; 1957. [Google Scholar]
- 7.Dalal DP, Eaton SS, Eaton GR. The Effects of Lossy Solvents on Quantitative Electron-Paramagnetic-Res Studies. Journal of Magnetic Resonance. 1981;44(3):415–428. [Google Scholar]
- 8.Rinard GA. Q Measurement Using a Network Analyzer. In: Eaton GR, Eaton SS, Barr DP, Weber RT, editors. Quantitative EPR. New York: SpringerWien; 2010. p. 85. [Google Scholar]


