

Abstract
Impaired axonal transport has been linked to the pathogenic processes of Alzheimer’s disease (AD) in which axonal swelling and degeneration are prevalent. The development of non-invasive neuroimaging methods to quantitatively assess in vivo axonal transport deficits would be enormously valuable to visualize early, yet subtle, changes in the AD brain, to monitor the disease progression and to quantify the effect of drug intervention. A triple transgenic mouse model of AD closely resembles human AD neuropathology. In this study, we investigated age-dependent alterations in the axonal transport rate in a longitudinal assessment of the triple transgenic mouse olfactory system, using fast multi-sliced T1 mapping with manganese-enhanced MRI. The data show that impairment in axonal transport is a very early event in AD pathology in these mice, preceding both deposition of Aβ plaques and formation of Tau fibrils.
Keywords: Axonal transport, Alzheimer’s disease, MEMRI, triple transgenic mouse model, T1 mapping
Introduction
Neuronal cell function and viability critically depend on effective and timely axonal transport (AT), i.e. the process in which intracellular cargoes including neurotransmitters, proteins and organelles are trafficked through axons to the nerve terminals. Axonal transport deficits have been implicated in neurodegenerative diseases such as Alzheimer’s disease (AD) (Morfini et al. 2009; Wilson 2008). Two major pathological hallmarks of AD, accumulation of β-amyloid (Aβ) deposition in plaques and fibrillization of Tau, appear to cause axonopathy. Tau is a microtubule-associated protein that stabilizes and is essential for maintaining normal axonal transport processes (Gotz et al. 2006). The dysregulation of axonal transport leads to synaptic dysfunction and synaptic/neuronal loss in animal models of AD. The presence of axonopathy in human AD has been supported by findings of axonal swelling, accumulated mitochondrial components in lysosomes, accumulation of vesicles in cell bodies, and dysfunctional synaptic vesicles at nerve terminals (Gotz et al. 2006; Stokin et al. 2005).
Increased axonopathy has been reported in animal models of amyloidosis including the Tg2576 mouse that over-expresses a mutant human amyloid precursor protein (APP) and an APP mutant mouse that also that also expresses a human presenilin mutation (PS1) (Smith et al. 2007; Wirths et al. 2007). It has been suggested that the axonal transport deficits are occurring in conjunction with the accumulation of insoluble Aβ and prior to Aβ plaque formation in the Tg2576 AD mouse model. Many of the transgenic AD mouse models exhibit axonal swelling that likely interferes with normal axonal transport of essential cellular components, mitochondria, and other vesicles. Mutations in the Tau gene also seriously disrupt microtubule function and lead to dystrophic axonal processes (Hutton et al. 1998; Spillantini et al. 1998). However, the mechanisms by which both aging and various genetic insults disrupt axonal transport have not been clearly delineated (De Vos et al. 2008; Morfini et al. 2009; Schindowski et al. 2007). Therefore, understanding the role of Aβ and Tau in the development of axonal transport deficits in AD brain is crucial for developing new strategies in early diagnosis and possible treatments to slow progression of AD pathology.
Axonal transport rates have conventionally been measured in vitro using radiotracers or fluorescent dyes in excised neurons. These conventional methods are invasive and cannot be used in vivo. Recently in vivo approaches to measuring axonal transport rates have been reported using magnetic resonance imaging (MRI) methods. One commonly used form of MRI, manganese-enhanced magnetic resonance imaging (MEMRI), involves application of manganese chloride (MnCl2) as a contrast agent to follow axonal transport. MEMRI measures the shortening of the longitudinal relaxation rate constant (R1 = 1/T1) over time after administering an MnCl2 solution (Chuang et al. 2006; Kim et al. 2009). Manganese ion (Mn2+) is a paramagnetic, calcium analogue that has been used as a contrast agent in MRI. It is a trans-synaptic tracer that is taken up into neurons via voltage-gated calcium channels, packaged into vesicles, and transported down the axon in a microtubule-dependent manner. After being released from pre-synaptic terminals, Mn2+ crosses the synapse, enters post-synaptic neurons, and is distributed through interconnecting brain areas by selective anterograde transport. In a series of papers, Pautler and co-workers established MEMRI as a viable neuronal tract tracing method that allows for the measurement of axonal transport rates (Pautler et al. 1998; Pautler et al. 2002; Pautler 2004). Given that aging is the major risk factor for AD, it is worth noting that axonal transport rates in the CNS of rats, measured using MEMRI, decrease with normal aging (Cross et al. 2008).
Currently, most MEMRI studies rely on T1w MEMRI methods to detect changes in signal enhancement from Mn2+ accumulation (Serrano et al. 2008; Smith et al. 2007). However, MRI contrast in T1w MEMRI methods can only be useful for a narrow range of Mn2+ concentration in the target tissue. In addition, quantification of T1w MEMRI is not reliable for multi-session or longitudinal studies due to variations in the signal intensity by other contributing factors such as flip angle and base line T1 values. Unlike T1w MEMRI, the parametric T1 mapping method provides reliable quantification as the signal sensitivity does not depend on the Mn2+ concentration. The T1 mapping method also allows the Mn2+ contrast comparison in multiple sessions because this method does not require a normalization process. In this study, we have used our previously-developed fast multi-slice Look-Locker sequence with multiple phase encodings per inversion pulse, which enabled T1 mapping in short acquisition time (Lee 2007).
The olfactory system is particularly favorable for the study of axonal transport since Mn2+ can be delivered noninvasively. The delivery of Mn2+ into mouse olfactory epithelium can easily be achieved via injection of MnCl2 solution through the nasal pathway as it connects primary neurons in the epithelium to cortical projections without necessitating transport of tracers across the blood-brain barrier (Cross et al. 2004; Cross et al. 2008). Successful measurement of an axonal transport deficit has been achieved in the olfactory system of an APP transgenic mouse model of AD using the MEMRI technique (Smith et al. 2007; Wirths et al. 2007).
In this study, we have used an animal model of AD that expresses both Aβ and Tau pathology, a triple transgenic mouse model of AD (3xTg-AD). The 3xTg-AD is a widely used as an animal model for human AD because it expresses mutations in PS1M146V, APPSwe, and TauP301L, leading to both Aβ and Tau pathology (Oddo et al. 2003). The 3xTg-AD mice develop Aβ and Tau pathologic lesions in a sequential manner. By measuring axonal transport deficits in this mouse model at different ages, we investigated the effects of the combination of Aβ and Tau aggregates on axonal transport at an early stage of the disease development in these mice. We hypothesize that occurrence of early axonal transport deficits is likely due to intraneuronal Aβ first, followed by Tau hyper-phosphorylation and fibrillization, leading to progressive axonal transport deficits. Using quantitative T1 mapping rather than qualitative T1w imaging together with non-invasive MEMRI, we demonstrate that these methods can be reliably employed to detect age-dependent axonal transport impairments.
Materials and Methods
Animals
All the animals were handled in compliance with institutional and national regulations and policies. The protocols were approved by the Institutional Animal Care and Use Committee. 3xTg-AD mice were obtained from the mouse colony established at the University of Kansas from a breeding pair obtained from Dr. Laferla at the University of California at Irvine. 3xTg-AD mice harbor PS1M146V, APPSwe, and TauP301L and progressively develop both Aβ plaques and NFT pathology with accompanying neuronal death in brain regions similar to those seen in human AD. These animals develop intracellular Aβ pathology in neocortex at 3 months of age, extracellular Aβ pathology in frontal cortex at 6 months, and Tau pathology at 12 months. The presence of both Tau and APP transgenes in olfactory bulb (OB) has been confirmed by Western blotting (Oddo et al. 2003).
Three age groups of 3xTg-AD mice and age-matched wt mice were studied: 2 months (2 mos), n = 9 for wt and n=8 for 3xTg-AD; 3 months (3 mos), n = 8 for wt and n = 4 for 3xTg-AD; 15 months (15 mos) of age, n = 5 for wt and n = 6 for 3xTg-AD.
Manganese (Mn2+) Administration
Animals were anesthetized with 4% isoflurane mixed in 4 L/min air and 1 L/min O2 for 5 min. Manganese chloride (MnCl2) solution was administered intranasally. A nasal lavage of 4 μL of isotonic MnCl2 solution (160 mM) (Sigma-Aldrich, St. Louis, MO) was administered to the left nostril using a Hamilton syringe (Hamilton Company, Reno, NV). Animals were then returned to a fresh cage on a heating pad, stimulated using amyl acetate for 15 min to enhance uptake of Mn2+ in the olfactory neurons, and allowed to recover fully before MRI sessions. We chose unilateral administration of MnCl2 solution to reduce the dosage of the MnCl2 solution to limit possible toxicity and to facilitate confirmation of the successful administration of MnCl2 by comparing signal enhancements in the ipsilateral and contralateral turbinate.
Magnetic resonance imaging
All MR studies were performed using a 9.4 T Varian INOVA system (Varian Inc., CA), equipped with a 12 cm gradient coil (40 G/cm, 250 μs). A 6 cm diameter Helmholtz volume transmit coil and a 7 mm diameter surface receive coil with de-tune capability were used for MR imaging. Animals were anesthetized and maintained with 1 - 1.5 % isoflurane during MRI sessions. Mice were under anesthesia for less than 40 min for each MRI session. Core body temperature was maintained at 37 °C using a circulating hot water pad and a temperature controller (Cole-Palmer, NY). Respiration was monitored via a pressure pad under the animal (SA Instruments, NY). MR data were acquired before and 1h, 6h, and 24h after unilateral and intranasal administration of MnCl2 solution in four separate MRI sessions. These four MRI time points were chosen based on the time course of the R1 changes in the olfactory bulb (OB) and lateral olfactory tracts (LOT) after intranasal MnCl2 administration (data not shown). The data showed that R1 in the OB changed linearly with time from 1h to up to 6h post MnCl2 administration. Therefore, 1h and 6h time points were chosen to calculate axonal transport rates, to remove the effect of the initial transport delay from the turbinate to the OB, and to achieve high detectability R1 changes in OB by allowing enough time for transported Mn2+ to accumulate in the OB. The 24h time point was chosen to provide enough time for axonal transport of Mn2+ to the more distal LOT.
T1 maps were measured using a non echo planar imaging based, multi-slice T1 sequence modified from the Look-Locker sequence (Look et al. 1970) to acquire two phase encodings per inversion pulse (TR/TE = 4/2 ms, FOV = 2 cm, matrix = 128 × 128, thickness = 0.5 mm, flip angle = 20°, 22 inversion times from 40 – 5470 ms, and acquisition time = 8.5 min). B1 maps were measured to correct the effect of flip angle variations on T1 maps (TR/TE = 200/3.7 ms, matrix = 128 × 128, NEX = 4, thickness = 0.5 mm) (Pan et al. 1998). High resolution T1-weighted (T1w) spin-echo images were also acquired to visualize turbinate areas of the olfactory system (TR/TE = 600/10 ms, NEX = 2, matrix = 256 × 256, thickness = 0.45 mm, scan time = 5 min).
MEMRI Data Analysis
The T1 and B1 values of each pixel were calculated using a program written in IDL (RSI, CO). The R1 values were calculated based on the following equation:
| Eq. (1) |
where T1 * is the apparent T1 obtained from the fitting of inversion recovery signal intensities using the Levenberg-Marquardt algorithm, τ is the duration between successive excitations of the same slice, and θ is flip angle. Ideally, if the exact flip angle at each pixel is known, the T1 can be computed from Eq. (1) after obtaining T1 * without further information. However, the B1 field inhomogeneity from the imperfect excitation pulse and the RF coil profile causes the flip angle to differ from the intended value. Therefore, B1 field maps were used to obtain the actual flip angle value, θ in Eq. (1) in a pixel-by-pixel basis. Region of interest (ROI) analysis was performed using STIMULATE software (Strupp 1996). Axonal transport rate index (ATRI) of olfactory sensory neurons was calculated from the R1 changes in an ROI of olfactory bulb between 1h and 6h after MnCl2 administration ((R1(6h) – R1(1h))/5). ATRI at the LOT was estimated from the time course of R1 changes in an ROI of the LOT between pre and post 24h MnCl2 administration ((R1(24h) – R1(pre))/24).
Mn2+ uptake in the turbinate was compared between wt and 3xTg-AD mice at 1h post MnCl2 administration. The MR signal intensity in the spin-echo T1w images was measured from both enhanced (left, L) and non-enhanced (right, R) sides of the turbinate. Unlike gradient-echo based T1 mapping methods, spin-echo T1w MEMRI does not suffer from the macroscopic susceptibility induced signal loss where the susceptibility effect is pronounced due to the air and tissue interface, such as the turbinate regions. The MR signal intensity ratio between two sides at 1h post MnCl2 administration provided an index for Mn2+ uptake.
Trans-synaptic transmission efficiency index of Mn2+ was estimated from the ATRI at the OB and LOT. Since the concentration of Mn2+ at LOT is proportional to the concentration in the OB and the efficiency of synaptic transmission from the olfactory sensory neurons to mitral cells in the OB glomeruli, the trans-synaptic transmission efficiency index was calculated by the ratio of the ATRIs at LOT and OB.
Two-tailed Student t-tests were performed to compare group means of ATRIs using Microsoft Excel. All data are presented as mean ± SD. A P-value of less than 0.05 was considered statistically significant.
Results
High resolution MEMRI of the 3xTg-AD mouse brain
The coronal Mn2+ enhanced T1w MR image (T1w MEMRI) clearly shows structures and layers of the nasal and olfactory system of the 3xTg-AD mouse (Fig. 1A Top). The T1w MEMRI was acquired at 6h post MnCl2 administration in a 5 min data acquisition time and demonstrates the Mn2+ accumulation from the turbinate to the OB. Three major areas (i: turbinate; ii: OB; iii: LOT in Fig. 1A (Top: coronal MRI, Bottom: sagittal MRI)) were chosen to calculate axonal transport rates from the turbinate to the OB, and from the turbinate to the LOT. The first slice position (i in Fig. 1A) was placed where olfactory sensory neurons are located in the olfactory epithelium of the turbinate. The second slice position (ii) was placed where olfactory neurons project to glomeruli in the olfactory bulbs. The third slice position (iii) was placed where olfactory output neurons (mitral cells) are receiving inputs from glomeruli and projecting to various targets in the brain via olfactory tracts. Mn2+ accumulates following the olfactory neural circuits from olfactory sensory neurons to olfactory tracts, and MEMRI were measured at 1h, 6h, and 24 h post MnCl2 administration through the left nasal cavity.
Figure 1. MEMRI of a 3xTg-AD mouse.
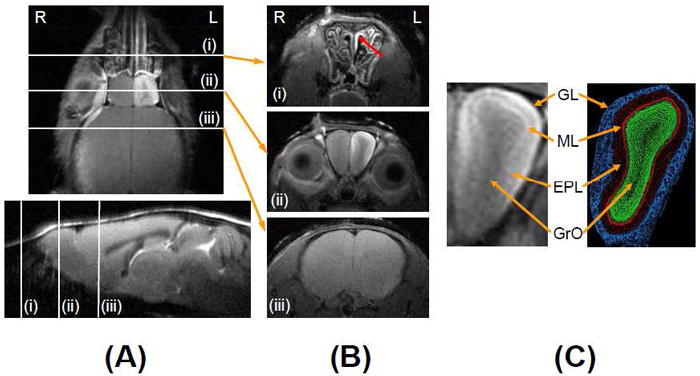
(A) T1w high resolution coronal MEMRI (Top) and sagittal MRI (Bottom) of a 3xTg-AD mouse showing slice positions of MEMRI data acquisition: (i) turbinate; (ii) olfactory bulb (OB) and (iii) lateral olfactory tracks (LOT) at 6h post MnCl2 administration. (B) Corresponding T1w high resolution (78 × 78 × 450 μm3) transverse images of (i) the turbinate at 1h, (ii) the OB at 6h, and (iii) the LOT at 24h post MnCl2 administration. (C) Extended view of the OB and a corresponding histological section of the OB illustrating the layered structure of the different cell types: the glomerular layer (GL); mitral cell layer (ML); external plexiform layer (EPL); and granule cell layer (GrO) [Image adapted from Wikipedia, public domain]. “R” in Fig. 1A and 1B indicates the animal’s right and “L” indicates the animal’s left.
Mn2+ uptake in the turbinate at 1h post MnCl2 administration
High resolution T1w MEMRI of the turbinate (Fig. 1B(i)) was acquired at 1h post MnCl2 administration. Unilateral MR signal enhancement in the left turbinate (marked by red arrow) shows the structure in detail, including nasal cavities. The signal enhancement in the turbinate indicates Mn2+ uptake into the olfactory sensory neurons during the initial hour. There was no difference in signal enhancement between wt and 3xTg-AD mice in any age, 2 mos, 15 mos or 18 mos of age (p = 0.57, n = 5 for wt and n = 6 for 3xTg-AD).
Mn2+ transport in the OB at 6h post MnCl2 administration
At 6h post MnCl2 administration, the layered structure of the OB was clearly identifiable with MR signal enhancement through Mn2+ accumulation in the glomerular layer (GL) and the mitral cell layer (MCL) in the high resolution T1w MEMRI (Fig. 1B(ii)) with the expanded view of the figure in the left panel of Fig. 1C. The external plexiform (EPL) and granule cell (GrO) layers did not show clear signal enhancement. Cellular layers of the OB in mice are detailed in a histological section figure (Fig. 1C, www.wikipedia.org) to illustrate the matching structure in the T1w MEMRI.
Quantitative measurement of axonal transport rate using T1-mapping
Figure 2 shows representative T1 maps (upper row, pseudo color) and T1w images (lower row, gray color) of the OB of 3 mos old wt (Fig. 2A) and 3xTg-AD (Fig. 2B) mice at baseline, and 1h, 6h, and 24h post MnCl2 administration through the nasal cavity. At 1h post MnCl2 administration, a slight T1 reduction was observed in the medial and lateral regions of the left OB in the T1 map of wt. The corresponding T1w signal enhancement was also observed in the T1w image of wt. No discernable changes were detectable in either the T1 maps or T1w MRI of 3xTg-AD mice. At 6h and 24h, both wt and 3xTg-AD mice showed clear T1 reductions (T1w MEMRI signal enhancement) at the medial, lateral and dorsal parts of the left OB. The time course of R1 was calculated from the ROI placed mostly in the glomerular layer of the lateral part of the OB (Square in Fig. 2A, top row). Group comparisons of R1 in the OB of 3 mos old mice between wt and 3xTg-AD mice are shown in Fig. 4C. R1 values of 3xTg-AD mice were significantly lower at 1h (wt: 0.82 ± 0.12 s-1, 3xTg-AD: 0.69 ± 0.04 s-1; p = 0.043), 6h (wt: 1.84 ± 0.27 s-1, 3xTg-AD: 1.31 ± 0.0.28 s-1; p = 0.005) and 24h (wt: 1.76 ± 0.36 s-1, 3xTg-AD: 1.25 ± 0.24 s-1; p = 0.018) post MnCl2 administration, indicating lower axonal transport of Mn2+ in 3xTg-AD than that in wt mice.
Figure 2. Quantification of the axonal transport rate.
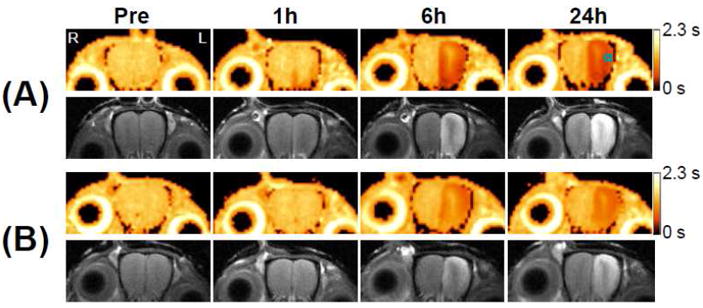
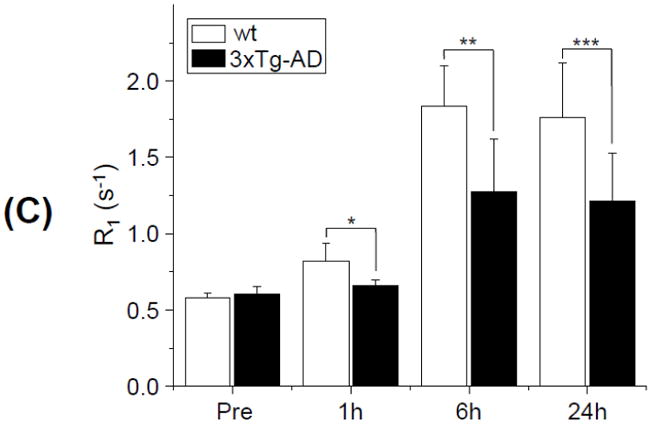
Two sets (A and B) of T1 maps with corresponding T1w images of the OB of 3 mos old wt (A) and 3xTg-AD (B) mice at baseline, and 1h, 6h, and 24h post MnCl2 administration. The small square in the T1 map (top row right most) indicates the ROI inside of which the ATRI ((R1(6h) – R1(1h))/5) of the OB was calculated. The gradient bars indicate the range of T1 values from 0 s to 2.3 s. “R” in Fig. 2A (top row left most) indicates the animal’s right and “L” indicates the animal’s left; this orientation holds for all figures displayed. (C) Longitudinal relaxation rate (R1) at the OB of 3 mos old mice at baseline, and 1h, 6h, and 24h post MnCl2 administration, quantified from the ROI shown in Fig. 2A. (*: p = 0.04 for 1h; **: p = 0.005 for 6h; ***: p = 0.02 for 24h; n = 8 for wt and n = 5 for 3xTg-AD)
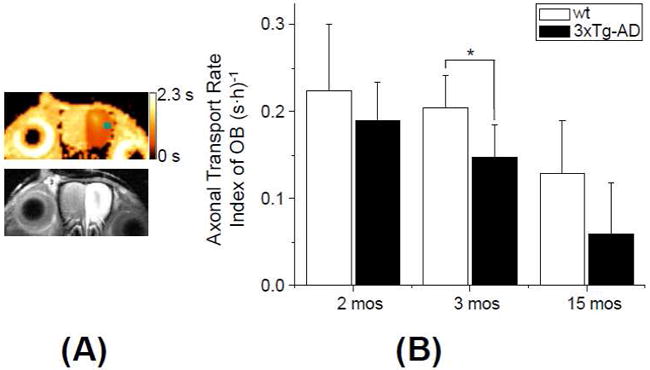
Figure 4. Axonal transport deficits in the LOT.
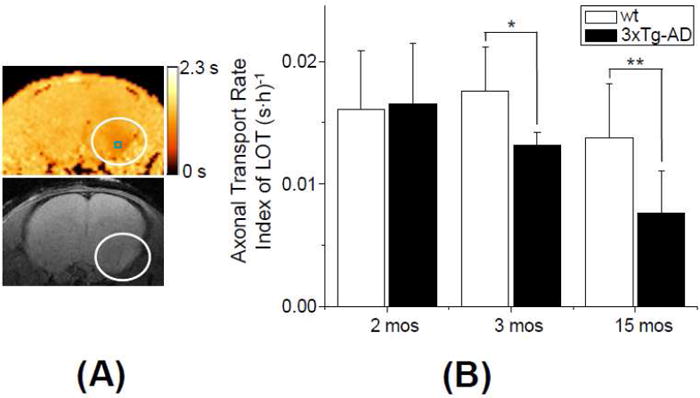
(A) T1 map with corresponding T1w MEMRI at the LOT of a 3xTg-AD mouse at 2 mos of age. MEMRI was performed at 24h post MnCl2 administration. The circles indicate the LOT area with unilateral enhancement. A small square in the upper panel shows an ROI in which the ATRI ((R1(24h)-R1(Pre))/24) of the LOT was obtained. The color scale bar indicates the range of T1 values of 0 - 2.3 s. (B) Comparison of the ATRI in the LOT between wt and 3xTg-AD at 2 mos (n = 9 for wt and n = 8 for 3xTg-AD), 3 mos (n = 8 for wt and n = 5 for 3xTg-AD) and 15 mos (n = 5 for wt and n = 6 for 3xTg-AD). (p=0.88 for 2 mos; *: p = 0.039 for 3 mos; **: p = 0.028 for 15 mos of age)
Lower axonal transport rate in the OB of 3xTg-AD
An average ATRI of the OB was calculated from the difference between R1 values at 1h and 6h in the same manner as in Fig. 2C. Group comparisons between 3mos old 3xTg-AD and wt showed that 3xTg-AD mice had a significantly lower axonal transport rate (p = 0.034) (Fig. 3). Figure 3A shows T1 maps and the corresponding T1w MEMRI of the OB (slice position ii in Fig. 1A) with the clear unilateral signal enhancement in the left OB of 3xTg-AD at 6h post MnCl2 administration. The axonal transport rate remained lower in 3xTg-AD mice compared to wt mice at 15 mos, although it did not reach statistical significance (p = 0.087). The overall ATRI of 3xTg-AD mice was lower by 27% at 3 mos and lower by 54% at 15 mos compared to wt mice.
Figure 3. Axonal transport deficit in the OB.
(A) T1 map with corresponding T1w MEMRI at the OB of a 3xTg-AD mouse at 2 mos of age. MEMRI was performed at 6h post MnCl2 administration. A small square in the upper panel shows an ROI where the ATRI in the OB (R1(6h)-R1(1h))/5) was obtained. The color scale bar indicates the range of T1 values of 0 - 2.3 s. (B) Comparison of the ATRI in the OB between wt and 3xTg-AD at 2 mos (n = 9 for wt, n = 8 for 3xTg-AD), 3 mos (n = 8 for wt, n = 4 for 3xTg-AD) and 15 mos (n = 5 for wt, n = 6 for 3xTg-AD) of age at the OB. (p=0.3 for 2 mos; *: p = 0.034 for 3 mos; p = 0.087 for 15 mos of age)
The effect of aging on the axonal transport rate was assessed in three age groups (2 mos, 3 mos, and 15 mos). The average ATRI fell with age for both wt and 3xTg-AD groups although 3xTg-AD mice transport rates fell more in all age groups. The difference between young mice (2 mos and 3 mos) and old mice was statistically significant in both groups (3xTg-AD: p = 0.001 for 2 mos vs. 15 mos, and p = 0.028 for 3 mos vs. 15 mos; wt: p = 0.033 for 2 mos vs. 15 mos, and p = 0.017 for 3 mos vs. 15 mos). Age-dependent decreases of the ATRI from 2 mos of age were 22% and 69% at 3 mos and 15 mos of age for 3xTg-AD mice, respectively, while the decreases were 9% and 43% for wt mice.
Measurement of trans-synaptic axonal transport rate in the lateral olfactory tract
Figure 4A shows T1 maps and the corresponding T1w MEMRI of the LOT (slice position iii in Fig. 1A) with the unilateral T1 reduction in the left LOT of 3xTg-AD at 24h post MnCl2 administration. At earlier time points (1h or 6h post MnCl2 administration), no signal enhancement was observed in the LOT.
The ATRI was measured at the LOT in 2 mos, 3 mos and 15 mos old 3xTg-AD mice. Overall the axonal transport deficits in the LOT were similar to transport deficits observed in the OB of 3 mos and 15 mos mice. The results of the comparison indicate that a dramatic axonal transport deficit occurred at 3 mos (p = 0.039) of age and persisted in older age mice (15 mos) (p = 0.028) compared to age-matched wt mice (Fig. 4B). The difference between young mice (2 mos and 3 mos) and old mice was statistically significant in 3xTg-AD mice (p = 0.003 for 2 mos vs. 15 mos, and p = 0.016 for 3 mos vs. 15 mos), but there were no differences in wt mice (p > 0.1). The age-dependent decreases of the ATRI from 2 mos 3xTg AD mice were 14% and 54% at 3 mos and 15 mos of age, respectively. Trans-synaptic transmission efficiency index of Mn2+ in 3xTg-AD mice did not differ from that of wt mice in all age groups (p > 0.19).
Discussion
Early axonal transport deficit in the 3xTg-AD mouse brain
In this study, axonal transport deficits in 3xTg-AD mice preceded deposition of Aβ plaques and neurofibrillary tangles. Our findings of the early axonal transport deficit in 3xTg-AD mice at 3 mos of age are coincident with the timing of intraneuronal Aβ accumulation, as 3xTg-AD mice are known to develop this pathological lesion at 3 – 4 mos in the neocortex, extracellular Aβ pathology such as Aβ plaque deposition at 5 – 6 mos in the frontal cortex, and the Tau pathology at 12 mos of age (Oddo et al. 2003). In light of the recent demonstration by Pigino and colleagues that intraneuronal Aβ, especially oligomers, can induce fast axonal transport deficits in the giant squid axoplasm (Pigino et al. 2009), the intraneuronal Aβ accumulation in 3xTg-AD mice at 3 – 4 mos of age may be a contributor to the observed axonal transport deficits. Furthermore, the axonal transport deficits could be linked to cognitive impairment observed in 3xTg-AD at the same age (Billings et al. 2005). Early axonal transport deficits in 3xTg-AD were also consistent with previous findings in Tg2576 mice in which axonal transport deficits occurred at 6 – 7 mos of age, prior to Aβ plaque deposition (Smith et al. 2007).
The axonal transport deficits in 3xTg-AD persisted to the later age of 15 mos, the age range in which both extracellular Aβ and Tau pathologies are known to be present (Oddo et al. 2003). Although extracellular Aβ and/or Tau pathology may not contribute to the initial axonal transport deficits, it is highly probable that both pathologies contribute to the further reduction of axonal transport rates at a later age compared to those at 3 mos of age.
Trans-synaptic axonal transport of Mn2+
The axonal transport in the LOT of 3xTg-AD mice was also impaired as observed in the OB of 3 mos and 15 mos. Note that the ATRI in the LOT is an order of magnitude lower than that in the OB. The ATRI reflects the rate of Mn2+ accumulation in each region of interest and the amount of Mn2+ accumulation at a given time in each region depends on the distance from the Mn2+ uptake site (i.e., turbinate) and the availability of Mn2+ in the neurons for transport after the uptake. The longer axonal distances from the turbinate to the LOT and the Mn2+ dilution factor at the OB as Mn2+ are transported from the OB to various brain regions have contributed to the lower accumulation of Mn2+ in the LOT.
The transport deficits at the LOT could be caused either by slow movement of vesicles along the axons or by low efficiency of synaptic transport of vesicles, since the ATRI at the olfactory tracts includes contributions from (1) axonal transport into the OB, (2) synaptic transmission from the olfactory sensory neurons to mitral cells at glomeruli in the OB and (3) axonal transport to the LOT. Considering that there was no difference in trans-synaptic transmission efficiency indices of Mn2+ (synaptic transmission from the olfactory sensory neurons to mitral cells) between 3xTg-AD and wt mice in all age groups, the lower axonal transport rate index at the LOT in 3xTg-AD is most likely due to slow axonal transport within the neurons.
Quantitative measurement of T1 mapping at high magnetic field, 9.4 T
We have achieved quantitative axonal transport rate measurements in the mouse brain in vivo using our T1 mapping method. One of the major challenges of T1 mapping in mice is the long acquisition time when using multiple TR / flip angle sequences or conventional single-slice Look-Locker sequences. Another challenge is the possible image distortion and/or signal dropout when echo planar imaging sequences are used to reduce the acquisition time. To overcome these problems, we used our fast multi-slice Look-Locker method that provided T1 mapping in less than 9 min. By using B1 corrected quantitative T1 mapping, with an excellent image resolution (156 × 156 × 500 μm3) across the mouse brain we visualized the T1 shortening in the OB and the LOT.
Significantly lower dose of MnCl2 for MEMRI
Mn2+ has proven to be useful in monitoring Ca2+ influx and measuring axonal transport rates in biological research (Serrano et al. 2008; Smith et al. 2007); however it is important to note that manganese is neurotoxic at high concentrations. Since the toxicity of manganese is associated with high concentrations, it is imperative to reduce the dose to avoid possible neurotoxicity, especially in longitudinal studies. In this study, we could lower the concentration of MnCl2 to 20 times lower (<5% of the dosages) than those used in previous studies (Serrano et al. 2008; Smith et al. 2007) with a sufficiently high contrast-to-noise ratio (CNR). By allowing 6 hr of Mn2+ accumulation in the OB in conjunction with our T1 mapping method and high magnetic field, the detection sensitivity of MRI signal changes was greatly enhanced. Thus, we were able to obtain robust detection of MEMRI signal changes at this low total dose of Mn2+ and to quantify the axonal transport rates reliably. When animals were subjected to multiple MEMRI sessions, the axonal transport rates were consistent, and we did not observe any behavioral changes, suggesting no observable ill effects from Mn2+ at the current dose.
Potential limitation of axonal transport measurement using MEMRI and future directions
Since MEMRI measurements rely on Mn2+ accumulation and its concentration in the OB, the axonal transport rate measured using MEMRI methods may include other contributing factors, such as uptake of Mn2+ in the olfactory sensory neurons in the turbinate, packaging of Mn2+ into the vesicles, and cargo binding to the motor protein, kinesin. In this study, we did not observe any difference in signal enhancement in the turbinate area between 3xTg-AD and wt mice in all age groups demonstrating that uptake of Mn2+ in the olfactory sensory neurons is largely identical. However, MEMRI does not provide any information regarding packaging of Mn2+ and cargo binding. Therefore, the axonal transport indices measured using MEMRI should be interpreted as an index for overall axonal transport integrity rather than a simple rate of axonal cargo movement. Considering the fact that there are multiple targets for disturbing axonal transport in neurodegenerative diseases including AD, axonal transport rate measurement using MEMRI in vivo can be used to assess overall integrity of axonal transport system that may be relevant to cognitive and behavioral outcomes.
The current findings of the axonal transport deficit could be correlated with biochemical and histochemical analysis results to associate with the presence of Aβ and tau pathology. Further study is needed to understand the mechanisms responsible for early axonal transport deficits in 3xTg-AD mice. In addition, the longitudinal axonal transport measurements should be possible by taking advantage of lower MnCl2 dosage and T1 mapping techniques to investigate the axonal transport deficits in disease progression and the effect of the drug treatment in the same cohorts of animals.
Conclusion
This study demonstrates that high resolution quantitative MEMRI is a valuable method for non-invasive measurements of axonal transport in the mouse brain. The combination of a novel quantitative T1 mapping MEMRI technique, a high sensitivity RF coil set and high magnetic field of 9.4 T, provided a robust measurement of R1 changes in OB and other parts of the brain as well as a visualization of cellular layers of the OB structure with high signal-to-noise ratio. Thus, this in vivo MEMRI approach should enable us to investigate axonal transport deficits in various transgenic mouse models of AD to evaluate the disease progression and the effect of drug treatments. This study also reports quantitative measurements of very early, yet subtle, axonal transport deficits in olfactory systems of 3xTg-AD mice. Our data suggest that accumulation of intra-neuronal Aβ rather than the extra-cellular Aβ or abnormal Tau may initially lead to the axonal transport impairment. However, further studies are needed to directly link intra-neuronal Aβ and axonal transport deficits and to assess the effect of extracellular Aβ and Tau pathology on axonal transport.
Acknowledgments
This study was supported in part by the Alzheimer’s Association (NIRG-07-60405 to Dr. Lee), the National Institutes of Health (5R21AG027419 to Dr. Michaelis, C76 HF00201 and P30 HD002528) and the Hoglund Family Foundation. The Hoglund Brain Imaging Center is supported by a generous gift from Forrest and Sally Hoglund.
Footnotes
Publisher's Disclaimer: This is a PDF file of an unedited manuscript that has been accepted for publication. As a service to our customers we are providing this early version of the manuscript. The manuscript will undergo copyediting, typesetting, and review of the resulting proof before it is published in its final citable form. Please note that during the production process errors may be discovered which could affect the content, and all legal disclaimers that apply to the journal pertain.
References
- Billings LM, Oddo S, Green KN, McGaugh JL, LaFerla FM. Intraneuronal Abeta causes the onset of early Alzheimer’s disease-related cognitive deficits in transgenic mice. Neuron. 2005;45:675–688. doi: 10.1016/j.neuron.2005.01.040. [DOI] [PubMed] [Google Scholar]
- Chuang K, Koretsky AP. Improved neuronal tract tracing using manganese enhanced magnetic resonance imaging with Fast T1 mapping. Magn Reson Med. 2006;55:604–611. doi: 10.1002/mrm.20797. [DOI] [PubMed] [Google Scholar]
- Cross DJ, Minoshima S, Anzai Y, Flexman JA, Keogh BP, Kim Y, Maravilla KR. Statistical mapping of functional olfactory connections of the rat brain in vivo. NeuroImage. 2004;23:1326–1335. doi: 10.1016/j.neuroimage.2004.07.038. [DOI] [PubMed] [Google Scholar]
- Cross DJ, Flexman JA, Anzai Y, Maravilla KR, Minoshima S. Age-related decrease in axonal transport measured by MR imaging in vivo. NeuroImage. 2008;39:915–926. doi: 10.1016/j.neuroimage.2007.08.036. [DOI] [PubMed] [Google Scholar]
- De Vos K, Grierson AJ, Ackerley S, Miller CCJ. Role of Axonal Transport in Neurodegenerative Diseases. Annu Rev Neurosci. 2008;31:151–173. doi: 10.1146/annurev.neuro.31.061307.090711. [DOI] [PubMed] [Google Scholar]
- Gotz J, Ittner LM, Kins S. Do axonal defects in tau and amyloid precursor protein transgenic animals model axonopathy in Alzheimer’s disease? J Neurochem. 2006;98:993–1006. doi: 10.1111/j.1471-4159.2006.03955.x. [DOI] [PubMed] [Google Scholar]
- Hutton M, Lendon CL, Rizzu P, Baker M, Froelich S, Houlden H, Pickering-Brown S, Chakraverty S, Isaacs A, Grover A, Hackett J, Adamson J, Lincoln S, Dickson D, Davies P, Petersen RC, Stevens M, de Graaff E, Wauters E, van Baren J, Hillebrand M, Joosse M, Kwon JM, Nowotny P, Che LK, Norton J, Morris JC, Reed LA, Trojanowski J, Basun H, Lannfelt L, Neystat M, Fahn S, Dark F, Tannenberg T, Dodd PR, Hayward N, Kwok JB, Schofield PR, Andreadis A, Snowden J, Craufurd D, Neary D, Owen F, Oostra BA, Hardy J, Goate A, van Swieten J, Mann D, Lynch T, Heutink P. Association of missense 5’-splice-site mutations in tau with the inherited dementia FTDP-17. Nature. 1998;393:702–705. doi: 10.1038/31508. [DOI] [PubMed] [Google Scholar]
- Kim J, Choi I-Y, Michaelis ML, Lee S-P. Early impaired axonal transport in a triple transgenic mouse model of Alzheimer’s disease. Proc Intl Soc Mag Reson Med. 2009;18:540. [Google Scholar]
- Lee S-P. Quantitative assessment of axonal transport integrity in the mouse brain in vivo using MEMRI at 9.4 T. Proc Intl Soc Mag Reson Med. 2007;15:2441. [Google Scholar]
- Look DC, Locker DR. Time saving in measurement of NMR and EPR relaxation times. Rev Sct Instrum. 1970;41:250–251. [Google Scholar]
- Morfini GA, Burns M, Binder LI, Kanaan NM, LaPointe N, Bosco DA, Brown RH, Brown H, Tiwari A, Hayward L, Edgar J, Nave K, Garberrn J, Atagi Y, Song Y, Pigino G, Brady ST. Axonal Transport Defects in Neurodegenerative Disease. J Neurosci. 2009;29:12776–12786. doi: 10.1523/JNEUROSCI.3463-09.2009. [DOI] [PMC free article] [PubMed] [Google Scholar]
- Morfini GA, Burns M, Binder LI, Kanaan NM, LaPointe N, Bosco DA, Brown RH, Jr, Brown H, Tiwari A, Hayward L, Edgar J, Nave KA, Garberrn J, Atagi Y, Song Y, Pigino G, Brady ST. Axonal transport defects in neurodegenerative diseases. J Neurosci. 2009;29:12776–12786. doi: 10.1523/JNEUROSCI.3463-09.2009. [DOI] [PMC free article] [PubMed] [Google Scholar]
- Oddo S, Caccamo A, Shepherd JD, Murphy MP, Golde E, Kayed R, Metherate R, Mattson MP, Akbari Y, LaFerla FM. Triple-Transgenic Model of Alzheimer’s Disease with Plaques and Tangles: Intracellular Ab and Synaptic Dysfunction. Neuron. 2003;39:409–421. doi: 10.1016/s0896-6273(03)00434-3. [DOI] [PubMed] [Google Scholar]
- Pan JW, Twieg DB, Hetherington HP. Quantitative Spectroscopic Imaging of the Human Brain. Magn Reson Med. 1998;40:363–369. doi: 10.1002/mrm.1910400305. [DOI] [PubMed] [Google Scholar]
- Pautler RG, Silva AC, Koretsky AP. In Vivo Neuronal Tract Tracing Using Manganese-Enhanced Magnetic Resonance Imaging. Magn Reson Med. 1998;40:740–748. doi: 10.1002/mrm.1910400515. [DOI] [PubMed] [Google Scholar]
- Pautler RG, Koretsky AP. Tracing Odod-Induced Activation in the Olfactory Bulbs of Mice Using Manganese-Enhanced Magnetic Resonance Imaging. NeuroImaging. 2002;16:441–448. doi: 10.1006/nimg.2002.1075. [DOI] [PubMed] [Google Scholar]
- Pautler RG. In vivo, trans-synaptic tract-tracing utilizing manganese-enhanced magnetic resonance imaging (MEMRI) NMR Biomed. 2004;17:595–601. doi: 10.1002/nbm.942. [DOI] [PubMed] [Google Scholar]
- Pigino G, Morfini G, Atagi Y, Deshpande A, Yu C, Jungbauer L, LaDu M, Busciglio J, Brady S. Disruption of fast axonal transport is a pathogenic mechanism for intraneuronal amyloid beta. Proc Natl Acad Sci U S A. 2009;106:5907–5912. doi: 10.1073/pnas.0901229106. [DOI] [PMC free article] [PubMed] [Google Scholar]
- Schindowski K, Belarbi K, Buee L. Neurotrophic factors in Alzheimer’s disease: role of axonal transport. Genes Brain and Behav. 2007;7:43–56. doi: 10.1111/j.1601-183X.2007.00378.x. [DOI] [PMC free article] [PubMed] [Google Scholar]
- Serrano F, Deshazer M, Smith KDB, Ananta JS, Wilson LJ, Pautler RG. Assessing Transneuronal Dysfunction Utilizing Manganese-Enhanced MRI (MEMRI) Magn Reson Med. 2008;60:169–175. doi: 10.1002/mrm.21648. [DOI] [PubMed] [Google Scholar]
- Smith KDB, Kallhoff V, Zheng H, Pautler RG. In vivo axonal transport rates decrease in a mouse model of Alzheimer’s disease. NeuroImage. 2007;35:1401–1408. doi: 10.1016/j.neuroimage.2007.01.046. [DOI] [PMC free article] [PubMed] [Google Scholar]
- Spillantini MG, Murrell JR, Goedert M, Farlow MR, Klug A, Ghetti B. Mutation in the tau gene in familial multiple system tauopathy with presenile dementia. Proc Natl Acad Sci U S A. 1998;95:7737–7741. doi: 10.1073/pnas.95.13.7737. [DOI] [PMC free article] [PubMed] [Google Scholar]
- Stokin GB, Lillo C, Falzone TL, Brusch RG, Rockenstein E, Mount SL, Raman R, Davies P, Masliah E, Williams DS, Goldstein LS. Axonopathy and transport deficits early in the pathogenesis of Alzheimer’s disease. Science. 2005;307:1282–1288. doi: 10.1126/science.1105681. [DOI] [PubMed] [Google Scholar]
- Strupp JP. Stimulate: A GUI based fMRI Analysis Software Package. NeuroImage. 1996;3:S607. [Google Scholar]
- Wilson RJ. Towards a cure for dementia: the role of axonal transport in Alzheimer’s disease. Sci Prog. 2008;91:65–80. doi: 10.3184/003685008X285375. [DOI] [PMC free article] [PubMed] [Google Scholar]
- Wirths O, Weis J, Kayed R, Saido TC, Bayer TA. Age-dependent axonal degeneration in an Alzheimer mouse model. Neurobiol Aging. 2007;28:1689–1699. doi: 10.1016/j.neurobiolaging.2006.07.021. [DOI] [PubMed] [Google Scholar]