Abstract
In ultrahigh field (UHF), human magnetic resonance imaging (MRI) concerns related to the homogeneity of the field [the radiofrequency (RF) magnetic field component responsible for the excitation of the spins] and the local/average specific absorption rate (SAR) are highly evident. In this work, through RF shimming techniques, a full-wave electromagnetic model that treats a coupled-RF coil and the load (an 18-tissue anatomically detailed human head model) as a single system is utilized to simultaneously (1) improve the homogeneity of field in various regions of interest across the volume of the human head and (2) minimize the total RF power deposition at 7 and 9.4 T. The numerical results illustrate that the field homogeneity (evaluated by the coefficient of variance) can be greatly improved in 3D slabs that vary in orientations and sizes, in the brain, and in the entire head volume without increasing the total RF power deposition in the head to exceed that obtained with quadrature excitation. The RF shimming simulation results are experimentally validated (by performing RF shimming without experimental B1 measurements) on a head-sized phantom using a 7-T human MRI scanner equipped with a transmit array excitation system. The SAR and associated temperature changes under quadrature and RF shimming excitation conditions are calculated and compared.
Keywords: B1 shimming, specific absorption rate, ultrahigh fields, transmit arrays, electromagnetic and temperature simulations, 7 T, 9.4 T
Introduction
High-field magnetic resonance imaging (MRI) (1–6) provides the potential for increased signal-to-noise ratio (SNR) (7). This attractive feature combined with advancement in current superconducting wire technology (8, 9) has resulted in significant increases in the field strength of current human scanners to reach 4 (10, 11), 7 (3, 4), 8 (12), 9.4 (1, 13) T and in the near future 10.5, 12, and 14.7 T. High-field imaging also leads to an increased Larmor (operating) frequency, thus the operating wavelength in tissue can become comparable to the size of the load and/or the coil. The performance of the radiofrequency (RF) coil, as a result, becomes increasingly dependent on its electromagnetic interactions with the load, human body or head. In other words, variations in the coil load can significantly affect the performance of the coil. As a result, high-field imaging has also been associated with significant technical and physical difficulties including inhomogeneous field (circularly polarized component of the time varying transverse magnetic field that excites the spins) distribution, increased RF power requirements, and, thus, excessive tissue heating (3, 12, 14–19). For high-field MRI to flourish in medical and research settings, it is imperative to improve the homogeneity of field and simultaneously maintain RF power requirements within the Food and Drug Administration (FDA) or the International Electro-technical Commission (IEC) limits.
To improve the homogeneity of the field and/or to obtain a specific RF excitation, several theoretical and experimental techniques have been proposed. Variable phase and variable amplitude excitation or “B1 shimming” has demonstrated theoretically using full-wave electromagnetic numerical methods (16, 17, 20–24) and experimentally (5, 25, 26) a good potential of achieving relatively homogeneous field excitation at 7 T. In recent work, Van den Berg et al. (27, 28) have demonstrated using electromagnetic simulations a theoretical improvement on the nonuniformity and specific absorption rate (SAR) hotspot for imaging of the pelvis area of body models at 3 and 7 T using 12-idealized (the effect of the load was not considered) TEM elements (29). Li et al. have also demonstrated using electromagnetic numerical simulations focusing the RF fields in the chest (30).
In ultrahigh field (UHF; ≥ 7 T) human MRI, the electromagnetic interactions of the RF field with the human body leads to a heterogeneous distribution of electromagnetic power dissipation especially at the interfaces between the different tissues. SAR is most often used to describe the absorption rate of RF energy in tissue. One direct parameter used to evaluate thermal responses of the tissue with RF energy deposition during an MRI exam is the temperature change induced by the RF field. Generally, inhomogeneous electric fields result in uneven distributions of the RF power deposition and “hotspots” may develop at locations in association with high electrical field strength and restrictive conductive tissue property (31). As a result, numerical calculations of SAR in anatomical detailed human have been carried out for MRI applications at various field strengths (12, 16, 19, 27, 32–40). As the human thermal responses are more related to the patients' thermoregulatory systems, temperature calculations have been performed to assess patients' safety (15, 41–45) during MRI experiment.
In this work, full-wave electromagnetic technique, finite difference time domain (FDTD) method, was used to provide an elaborate simulation of a coil-head system using a rigorous (as described in (46)) model of a highly-coupled TEM coil (47, 48) that operates as a transmit array. A set of genetic- and gradient-based routines were applied to achieve a shimming scheme that is capable of both optimizing the uniformity and the average SAR at 300 and 400 MHz (approximate Larmor frequencies for proton imaging at 7 and 9.4 T, respectively). The analysis is presented for a wide variety of regions that vary in dimension, orientation, and geometry in the human head model. Using finite difference method, this work also examines the temperature elevation caused by shimming.
For the first time, we verify the utilized modeling approaches with experimental shimming data obtained at 7 T without any experimental RF field measurements. We implement the phases and amplitudes of the excitation pulses calculated using our homemade electromagnetic full-wave modeling software directly into the console of a human MRI 7 T scanner (equipped with a multitransmit capability) without RF/B1 field measurements (transmit or receive.) The agreement between the experimental and simulated images demonstrates the capability of simultaneously predicting electromagnetic coupling, field, and RF power in loaded transmit arrays; a first step toward utilizing MRI electromagnetic simulations in the design of practical and subject-specific multi-transmission UHF MRI.
Methods
FDTD Modeling of the Transmit Array
A 16-element TEM coil (49), operating as a transmit array and loaded with an anatomically detailed 18-tissue human head mesh (24), was modeled using the FDTD (50) technique. The TEM resonator consists of 16 copper coaxial rods (14 mm in diameter), which are contained in an open resonant cavity. The coil shield has a diameter of 346 mm and a length of 212 mm. Two circular rings (outer edge with 346 mm diameter and inner edge with 236 mm) are attached to the top and bottom of the open cavity. Teflon material is filled between each pair of inner and outer coaxial elements. Figure 1 shows the utilized coil (left) and details of the coaxial elements inside it (right). The coil-head FDTD system has the resolution of 2 mm × 2 mm × 2 mm. The mathematical model of the coil was tuned while loaded with the human head mesh (21) for each individual coil element/port. From analytical models based on the multiconductor transmission line theory (49), nine modes exist for a 16-element TEM coil; Mode 1, the second mode on the coil's frequency spectrum was utilized. The tuning frequencies were set to ∼300 MHz (∼7 T for 1H imaging) and 400 MHz (∼9.4 T for 1H imaging).
Figure 1.
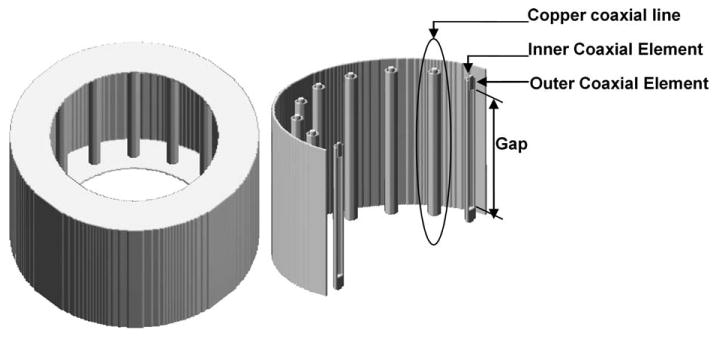
Schematics of a 16-element TEM coil.
Both the RF coil and the load were modeled as a single system (18, 46) throughout the calculations including the field and SAR. In such a modeling approach, the electromagnetic effects on the load due to the coil and on the coil due to the load are captured. To capture the coil's response, the coil-head mesh system is excited with a voltage source with a bandwidth spanning from 200 to 500 MHz, which includes both frequencies of interest: 300 and 400 MHz. To tune the coil, the gap between each pair of TEM inner rods (as shown in Fig. 1) is adjusted until the TEM resonator is resonant at the desired frequencies of operation. This is done by initially applying a guess for length of the gap then applying a Fast Fourier Transform (FFT) to the FDTD solution to obtain the frequency response of the coil. If the resonance frequency of the solution is not at the desired frequency (300 and 400 MHz in this work,) the gap length is adjusted, and the FDTD program is rerun. This process is repeated until the coil is appropriately tuned. The load is always numerically present in the coil through both of the excitation and tuning processes, and thus, no idealized current distribution is applied on the coil struts. The FDTD simulations, after tuning, result in 16 sets of individual electric and magnetic field distributions (both phase and amplitude) at the above-mentioned frequencies.
Calculations of the Field
The transverse magnetic (B1) field contains two circularly polarized components, defined as and fields, which are represented as follows,
| [1] |
| [2] |
B1x and B1y are the x and y components of the B1 field and are represented as complex values with amplitudes and phases. As we are concerned with field excitation, only the field, the flip-inducing component, was considered in our analysis.
Calculations of RF Power and SAR
The RF input power (after matching circuits) to the coil can be approximated as the sum of the absorbed (in tissue) power, the radiated (exiting from the coil and not absorbed in the tissue) power, and the power dissipated in the coil and shield (17). Because the absorbed power is associated with tissue dissipation and heating concerns, we deliberately consider only the power absorbed in the human head mesh. Power absorbed in the load is calculated as the summation of power deposition over the whole volume of the head model. Since the results demonstrate that the homogeneity of the field is excellent in all of the selected ROIs after performing shimming. The power absorbed in different cases is scaled to obtain a mean in a region of interest (ROI), field intensity of 1.957 μT, which is the field strength required to produce a flip angle of π/2 with a 3-ms rectangular RF pulse. This can be clearly achieved with the linearity of Maxwell's equations because Driving_Voltage ∝ E ∝ H, and therefore, Power ∝ E2 ∝ , where E and H are the electric and magnetic field intensities, and ∝ indicates linear dependence.
The RF power deposition during MRI experiment can induce the thermoregulatory imbalance; therefore, the distribution of the RF energy inside the head is very important in assessing safety concerns. The SAR is defined as the energy absorbed in a tissue of a given density from a radio transmitter. In FDTD, it is calculated by the following equation:
| [3] |
Where ρ(i,j,k) (kg/m3) and σ(i,j,k), (S/m) are the tissue density and conductivity of the FDTD cell at the (i, j, k) location, Ex, Ey, and Ez (V/m) are the magnitudes of the electric field components in the x, y, and z directions, respectively. SAR is presented in the unit W/kg per 1 or 10 g.
Shimming with RF Power Constrains
With the superposition of the fields produced by the 16-phased array TEM elements, the field in an ROI is optimized to be homogenous by varying the amplitude and phase of every drive port/coil element ( shimming) (22, 26–28, 51–54). Under the typical quadrature excitation (55), the characteristics of the excitation pulses possess the same amplitudes and integer multiples of 2π/(# of excitation ports = 16) phase shifts. According to previous work (24), uniformity improvement at many instances results in decreased mean and/or peak field strength in ROI. In this work, the total RF power absorption by the whole head model was constrained and included as a part of the shimming mechanism not to exceed the value obtained under quadrature excitation while still providing maximum uniformity.
The optimization algorithm is based on a combination of gradient-based and genetic algorithm functions. Starting from quadrature excitation condition, the coefficient of variation (COV = standard deviation/mean) of the field distribution within the ROI and the total absorbed power are calculated. The optimization function works to decrease COV to its minimum value while constraining the RF power below the initial value (quadrature excitation condition) through adjusting 31 variables (16 amplitudes and 15 phase shifts of the fields and of the electric fields induced by the transmit array elements). Calculations of total RF power absorption (over the whole head) and of the homogeneity of the field distributions on nine 3-cm-thick slabs and three 6-cm-thick slabs oriented in axial, sagittal, and coronal directions, the whole-brain, and the whole head were performed. SAR was calculated both under quadrature excitation condition and also for shimming. The influence on SAR by field optimization simultaneously with total RF power minimization is investigated by evaluating the SAR peak values, the SAR COV values, and the SAR distribution within the whole head model. FDA had regulated SAR in any 1 g of tissue and IEC does the same in any 10 g of tissue. The data are presented for the IEC regulation.
Thermal Property Model and Bio-Heat Equation
The thermal properties of the tissues in the head model (42, 56–59) are used in the calculation of temperature changes due to RF power deposition caused by UHF MRI, as shown Table 1.
Table 1. Thermal Properties of the Tissues in the Head Model.
| Basal Metabolic Rate A0 [J/(m3 s)] |
Specific Heat C [J/kg °C] |
Blood Perfusion Coeff. B [J/(m3 s °C)] |
Thermal Conductivity K [J/m s °C] |
|
|---|---|---|---|---|
| Air | 0 | 1,000 | 0 | 0.03 |
| Bone cancellous | 590 | 1,300 | 3,300 | 0.4 |
| Bone cortical | 610 | 1,300 | 3,400 | 0.4 |
| Brain grey matter | 7,100 | 3,700 | 40,000 | 0.57 |
| Brain white matter | 7,100 | 3,600 | 15,925 | 0.5 |
| Cartilage | 1,600 | 3,500 | 9,000 | 0.47 |
| Cerebellum | 7,100 | 3,700 | 40,000 | 0.57 |
| Cerebro spinal fluid | 0 | 4,200 | 0 | 0.62 |
| Dura | 860 | 2,802 | 4,830 | 0.31 |
| Eye sclera | 0 | 4,200 | 0 | 0.58 |
| Mucous membrane | 1,600 | 3,300 | 9,000 | 0.43 |
| Muscle | 690 | 3,600 | 2,700 | 0.5 |
| Nerve | 7,100 | 3,500 | 40,000 | 0.46 |
| Skin dry | 1,620 | 3,500 | 9,100 | 0.42 |
| Skin wet | 1,620 | 3,500 | 9,100 | 0.42 |
| Spinal chord | 7,100 | 3,500 | 40,000 | 0.46 |
| Tonguea | 690 | 3,600 | 2,700 | 0.5 |
| Tooth | 0 | 1,340 | 0 | 0.5 |
| Vitreous humor | 0 | 4,200 | 0 | 0.6 |
Taken as muscle.
The above thermal properties are not constants at any temperature condition. When tissues are heated excessively, regulation mechanisms result in vasodilatation and increasing perspiration, which makes the rates of metabolism, radiation, perfusion, and perspiration are all functions of temperature. According to the work of Wang et al. (43), the presence of thermoregulatory mechanism can decrease the temperature elevation at high RF power absorption condition; however, the case will not occur in normal practice within FDA/IEC temperature regulatory limits (i.e., obvious changes in thermal properties of the tissues happen only when the temperature increases far beyond the safety regulations). Therefore, physiological response to temperature is ignored in calculations of temperature elevation in this work.
The transport of thermal energy in living tissue is a complex process involving multiple phenomenological mechanisms including conduction, convection, radiation, metabolism, evaporation, and phase change (60). Based on the suggestion that the rate of heat transfer between blood and tissue is proportional to the product of the volumetric perfusion rate and the difference between the arterial blood temperature and the local tissue temperature, Pennes derived bioheat equation, which is applied in most of the temperature simulations, as shown in Eq. [4].
| [4] |
Where Cp (J/kg °C) denotes the specific heat (the amount of heat per unit mass required to raise the temperature by 1°C), K (J/m s °C) denotes the thermal conductivity (the property of a material that indicates its ability to conduct heat), Ao (J/m3 s) denotes the basal metabolic rate (the minimum calorific requirement needed to sustain life in a resting individual), and B (J/m3 s °C) denotes the blood perfusion coefficient (57, 61). The initial body temperature Tb was set to 37°C. The temperature increase of the tissues due to the RF energy absorption is calculated and analyzed using this bio-heat equation. The transfer or dispersion of heat can occur by means of three main mechanisms: conduction, convection, and radiation. In this work, the boundary condition of the thermal modeling contains convection consideration only. Without including sweating and radiation in real cases, the removal of the heat from the body model to the environment in simulation is less than in practical occasions, that is, the calculated temperature increase within regulatory limit here is more conservative than real applications. The transfer of heat between the domain and the surrounding environment is proportional to temperature difference between the surface and the environment. The following boundary condition is applied:
| [5] |
Where Ha denotes the convective transfer coefficient (a constant with a value of 20 J/m2 s °C) (62). The ambient temperature, Ta, is set to 24°C (57, 61).
Results and Disscussion
Experimental Verification of the RF Modeling/Shimming Techniques
To demonstrate the future implementation of our RF modeling and numerical optimization approaches using coupled transmit arrays, shimming without measurements (based on simulated field distributions) must be performed and successfully validated. In such scenario, the tuning, excitation, and reception (it was used for reception) of the transmit array is performed fully based on our RF modeling scheme without implementing measurements or artificial decoupling/matching circuits. A comparable 8-element coupled (minimum of −10 dB coupling between the transmit ports) TEM coil design was modeled, built, and tested in a transmit array mode. In the 8-strut TEM coil (outer and inner diameter is 13.5″/10″, length is 7″, half-wavelength semirigid coaxial transmission line connected to each excitation/reception port), four elements (alternate ones) were used as transmitting and receiving channels. The transmit array was tested with a head-sized spherical phantom (17.5-cm in diameter) filled with brain-like constitutive properties on a 7-T human MRI scanner. The electromagnetic properties of the phantom are: conductivity = 0.46 s/m and dielectric constant = 80. In essence, the choice of the phantom/load does not affect the accuracy of our RF modeling, that is, for full-wave computational electromagnetic software that utilize FDTD, the effectiveness of MRI RF modeling scheme is not measured by how accurately the load is modeled. The true test of the effectiveness of MRI RF modeling is accounting for the RF coupling between the transmit array elements, whereas the head coil is loaded with a head-sized conductive load.
shimming was performed with a 7-T system equipped with a multitransmit array system (Siemens Medical Solutions, Erlangen, Germany). Using the shimming scheme described in the previous section, the field distribution was optimized to achieve the lowest COV across a 5-mm thick axial slice while maintaining or lowering the total power absorption by the phantom. Before the 7-T experiment, FDTD calculations were performed to attain the intended amplitudes and phases of the excitation voltages. The calculated values of amplitudes and phases were applied directly (without RF field measurements) to excite the array elements in the 7-T experiment. Figure 2 shows a picture of the loaded coil and a very good agreement between the FDTD calculations and the experimental images. The experimental images shown in Fig. 2 were obtained without measurements and were fully based on the FDTD simulations. Comparing with quadrature excitation, the presented results show that the shimming scheme can lower COV by ∼59% while consuming only 94% of the total RF power absorbed during quadrature excitation.
Figure 2.
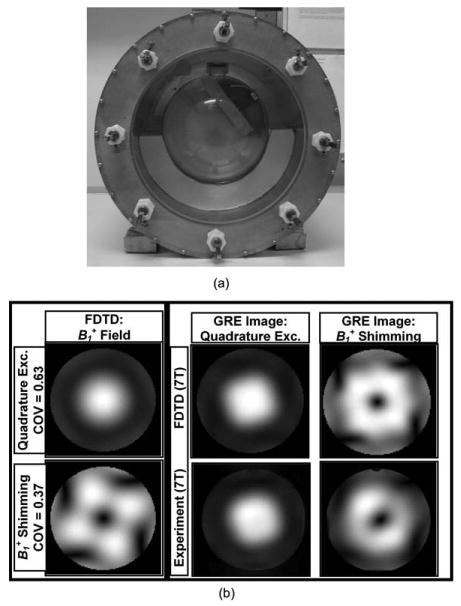
(a) Picture of the coupled 8-element TEM resonator loaded with a spherical phantom filled with brain-like constitutive properties; (b) field distribution and GRE images FDTD method under quadrature excitation and shimming (optimized for minimization of (1) the coefficient of variation of field distribution and (2) total RF power absorption by the phantom) and the corresponding experimental images obtained using 7-T whole-body scanner equipped with a multitransmit array. The images were obtained using four-port excitation/reception. The phases and amplitudes of the excitation pulses, and parameters for the coil tuning and matching were fully obtained and directly implemented from the rigorous FDTD modeling and without any (transmit/receive) measurements.
Power Deposition Validation
Using infrared thermal mapping (63) and Luxtron temperature measurements (64), our group has studied thermal responses of similar coils at UHFs. Figure 3 shows sample simulation and radiation measured with infrared camera near the surface of a spherical phantom filled with 1.15 S/m salinity and loaded in a 16-strut TEM coil. The results demonstrate good correlation between the numerical modeling and the infrared measurements (63).
Figure 3.
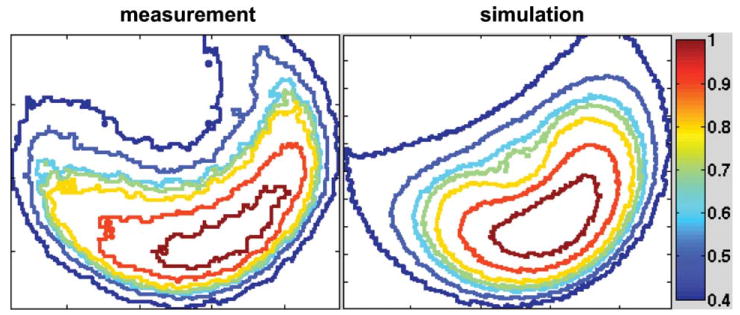
Contours of surface radiation (temperature rise) measured with infrared camera [65] and simulated power deposition inside a TEM coil loaded with a spherical saline phantom.
Analysis of the Field Distribution
For the human head model, the field distribution was analyzed under quadrature excitation and using shimming. Optimization of the field distribution homogeneity was performed at 7 T and 9.4 T in 3D regions over the whole head, brain, and 12 slab regions labeled from “A” to “N” as shown in Table 2 and Fig. 4. Figure 4 shows the normalized field distribution through these 14 regions using quadrature excitation and shimming. The values presented in the corner of each subfigure represent the COV of the field distribution and the total RF power absorbed (by the whole head) scaled to obtain 1.957 μT. Compared with quadrature excitation, Fig. 4 demonstrates that the homogeneity of the field distribution can be significantly improved while reducing the RF power absorbed by the head. The results demonstrate that the maximum improvement of field distribution homogeneity occurred over:
Table 2. Labels of the Optimized Regions of Interest Shown in Figs. 4–7.
| Label | Orientation | Thickness (cm) | Region |
|---|---|---|---|
| A | N/A | N/A | Whole head |
| B | N/A | N/A | Brain |
| C | Inferior | 3 | Axial slab |
| D | Middle | 3 | Axial slab |
| E | Superior | 3 | Axial slab |
| F | Posterior | 3 | Coronal slab |
| G | Middle | 3 | Coronal slab |
| H | Anterior | 3 | Coronal slab |
| I | Left (seen from the back) | 3 | Sagittal slab |
| J | Middle | 3 | Sagittal slab |
| K | Right (seen from the back) | 3 | Sagittal slab |
| L | Middle | 6 | Axial slab |
| M | Middle | 6 | Coronal slab |
| N | Middle | 6 | Sagittal slab |
The columns represent the orientations, thicknesses, and directions of the 3D regions (labeled A through N) over which the homogeneity of field distribution was optimized to achieve minimal coefficient of variation while constraining the total (over the whole head) RF power deposition to be less than or equal to that obtained with quadrature excitation.
Figure 4.
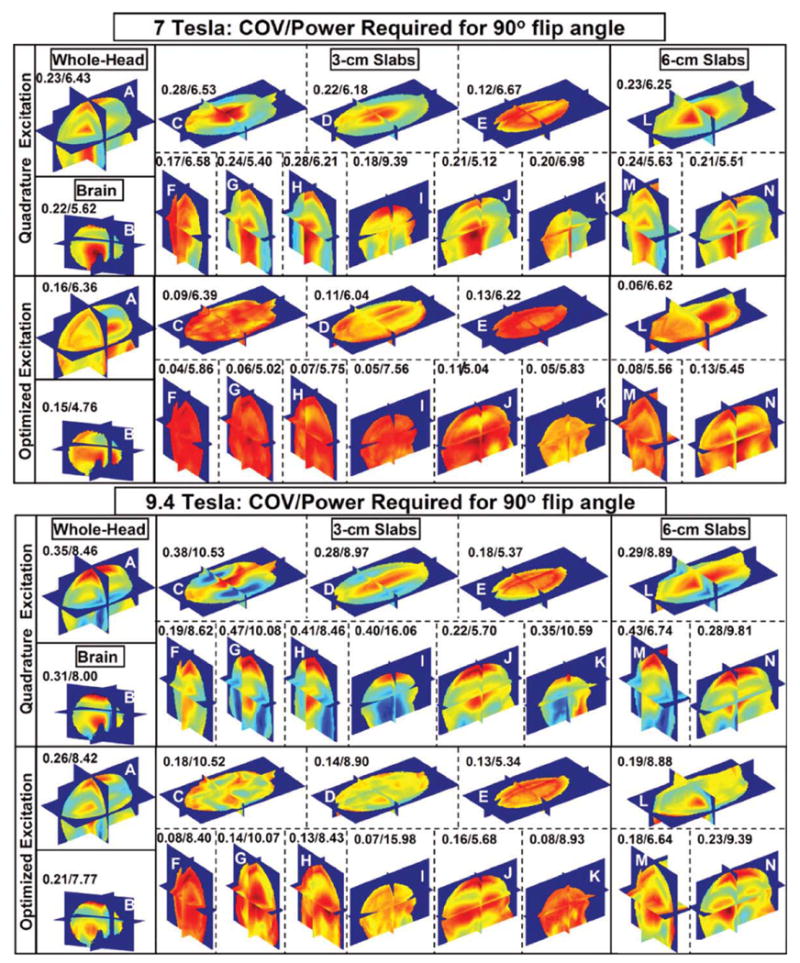
Normalized field distributions calculated using the FDTD model at 7 and 9.4 T. The 14 subfigures represent the distributions for whole head, brain, 3-cm slabs, and 6-cm slabs (all labeled in Table 2) under 16-port, quadrature and optimized ( shimming) excitations. The results are presented for an 18-tissue human head model numerically loaded in a 16-element TEM coil (numerically tuned to ∼300 and 400 MHz) and operating as a transmit array. The homogeneity of field distribution in each region of interest was optimized to achieve minimum coefficient of variance while maintaining or reducing the total (over the whole head) RF power deposition (obtained with quadrature excitation.) The letter on each subfigure represents the label of the optimized region of interest as shown in Table 2. The numbers above each subfigure represent the values of the coefficient of variance/absorbed power, where the absorbed power in each case is scaled to achieve a mean field intensity of 1.957 μT in the volume of any ROI.
Posterior 3-cm coronal slab “F” where the COV of the field distribution improved by a factor of 4.26 while consuming only 89.1% of the total RF power absorbed during quadrature excitation at 7 T and
Left 3-cm sagittal slab “I” where the COV of the field distribution improved by a factor of 5.71 while consuming 98.9% RF power absorbed under quadrature excitation at 9.4 T.
When shimming was applied to large 3D regions such as the whole head, compared with quadrature excitation, the COV of the field distribution improved by 43.7% with 98.9% power absorption at 7 T and 34.6% with 99.5% power absorption at 9.4 T.
Analysis of the RF Power Deposition
Manipulating the field distribution affects electric field inside the human head and the total power absorption as a result. From Fig. 4, homogenizing the field distribution (as measured by COV) in a wide variety of ROIs can always be achieved with less total RF power absorption when compared to quadrature excitation. Figure 5 shows the changes of RF power absorption within the 13 specified ROIs (excluding the whole human head shown in Table 2) and within three other regions that represent the average power absorption over the volume of the combined four axial (Ax), four coronal (Co), or four sagittal (Sa) slabs presented in Table 2. The black bars show the absorbed power (watts) under quadrature excitation condition by each ROI, and the gray bars represent the power absorption after shimming is performed.
Figure 5.
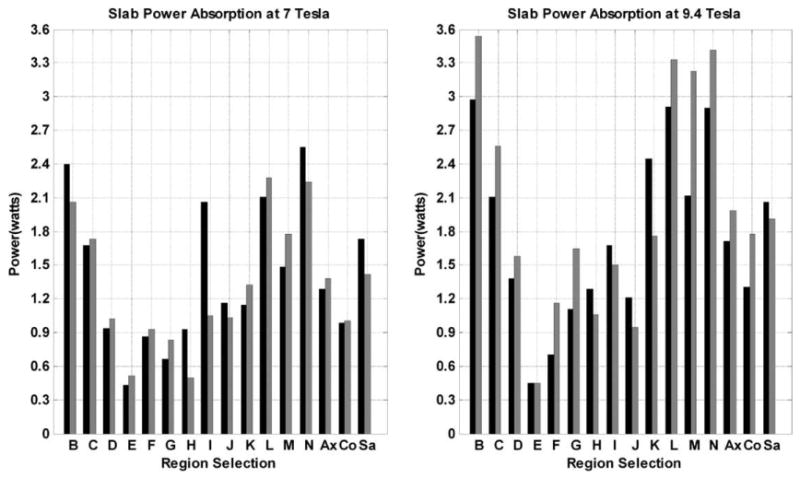
Comparisons of the RF power absorption in each ROI shown in Table 2 and Figure 4 at 7 and 9.4 T. The ROIs are shown in x axis and “Ax,” and “Co,” “Sa” represent the averaged absorbed power within grouping of the four slabs (three 3-cm thickness slabs and one 6-cm thickness slab) along axial, coronal, sagittal directions, respectively. The numbers on the y axis represent the total RF power absorption in each labeled region which produces a mean field intensity of 1.957 μT in that same region. The black bars represent the RF absorbed power (Watts) under quadrature excitation and the gray bars represent the RF power absorption with shimming.
At 7 T, the RF power absorbed by ROIs “B, H, I, J, N,” and “Sa” decrease with shimming when compared with quadrature excitation, whereas the RF absorbed power in other ROIs increases although the total RF power absorption by the whole head is still lower than that achieved with quadrature excitation. At 9.4 T, the power absorption decreases in ROIs “E, H, I, J, K” and “Sa” while increasing in the remaining ROIs; still the total RF power absorption by the whole head is lower than that achieved with quadrature excitation for all the ROIs.
The results demonstrate that the homogeneity of the field distribution can be improved in an ROI with reduction of the RF power absorption in the same ROI. This clearly indicates that the shimming scheme is capable of repolarizing the transverse magnetic field in the ROI to the MRI necessary polarization (counter clockwise circular.) In other words, shimming reverses the relative electric field constructive interference and field destructive interference caused by quadrature excitation to relative electric field destructive interference and field constructive interference (65, 66). The opposite also holds true if the total RF absorption in an ROI increases as a result of performing shimming. In addition, the changes of the regional power absorption with shimming do not follow the same patterns at 7 and 9.4 T. At UHF imaging, both the electric and fields are highly inhomogeneous. Using our optimization routine, it is possible for two sets of the amplitudes and phases to render the same level of homogeneity, that is, different magnetic field distributions might result in the same COV values across the ROI even at the same frequency (24). As the electric field distribution also varies with the amplitudes and phases of the voltages exciting the transmit array, the RF power absorption in an ROI can significantly vary even for a homogenous field in an ROI.
Analysis of SAR
Using Eq. [3], SAR (W/kg) (averaged over cubical volumes that constitute 10 g of tissue) is calculated using quadrature excitation and shimming. The SAR peak values and distributions throughout the whole head volume are compared under the two excitations. Figure 6 shows the locations of SAR peak values and Fig. 7 shows (1) the SAR peak values (over the whole head) that occur when a mean field intensity equals to 1.957 μT is achieved in ROIs and (2) the COV of SAR distributions (over the whole head) obtained at 7 and 9.4 T. Several observations are depicted from these results.
Figure 6.
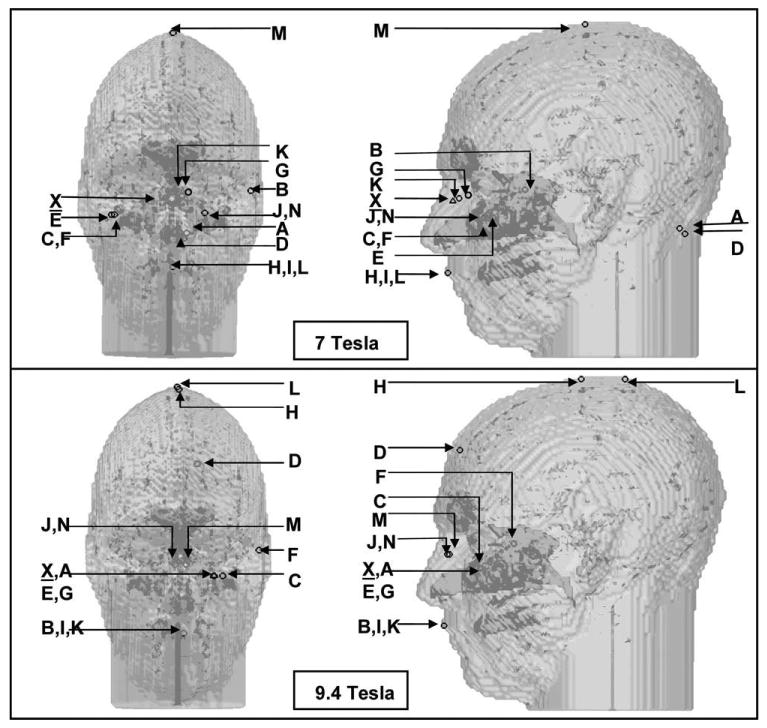
Locations of the SAR peaks under quadrature excitation (labeled as X) and under shimming (labeled as A to N as shown in Table 2.) The front view and side view of the 3D head model are shown to visualize each location's relative coordinates.
Figure 7.
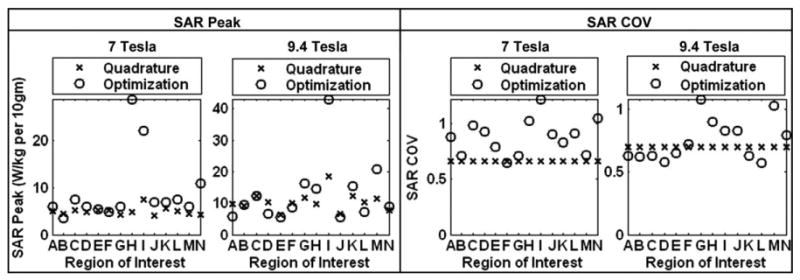
SAR peak values (over the whole-head) and the SAR distribution COV values (over the whole-head) under quadrature excitation (labeled as X) and under optimized excitation ( shimming) labeled as O. The labels for the ROIs on the x axis are defined in Table 2, and the values on the y axis represent the SAR peaks averaged for every 10 g tissue (Watts/kilogram per 10 g) or the SAR distribution COV.
Figure 6 shows that all the SAR peak values occur in tissue near air cavities (nasal, mouth, etc.) and/or outside namely front, top, and back of the head at both 7 and 9.4 T under both quadrature excitation and shimming. The results also show redundancy of the locations of the SAR peak values under shimming with different ROIs. At 7 T, shimming targeted for groups (C and F), (J and N), and (H, I, and L) exhibited identical locations for the SAR peak values. The same is also observed for groups (J and N), (X and A), (E and G), and (B, J, and K) at 9.4 T. The interpretation of these observations is cumbersome. On one hand, these results can demonstrate that the SAR peak values (and not overall distributions) are frequently dominated by properties related to the tissue such as location (proximity to air) and geometry more than the characteristics of the excitation itself. On the other hand, SAR calculations using FDTD possess inherent localized inaccuracies near tissue interfaces in general and near air-tissue interfaces in particular, as the second-order accuracy no longer exists (50).
Compared with quadrature excitation, the most increase in the SAR peak values occur in peripheral sagittal/axial slices (region H for 7 T and region I for 9.4 T).
Homogenizing the distribution of field in specific regions can lead significant inhomogeneity in the SAR distribution across the human head.
Analysis of Temperature Elevation
We have performed numerical simulations to study the effects of shimming on temperature elevation in tissue.
The head model, initially uniform at 37°C, was put in a 24°C environment without power deposition (SAR = 0) firstly until equilibrium condition T0 was met. A steady state is defined here when dT/dt = 2 × 10⁻⁷°C/s for 30 min, where the time step in the calculation of temperature, dt, is set as 0.05 s. After equilibrium was achieved, the calculation of temperature continued using Eq. [4] with SAR inputs. Temperature elevation (ΔT) was calculated by subtracting T0 from the final T at the equilibrium.
The SAR was calculated using Eq. [3], and then scaled to obtain an averaged field intensity of 1.174 μT in the regions of interest (ROI) at 7 and 9.4 T B0 field strengths. Under quadrature and shimming (on the brain) exciting condition, SARs over the whole head are calculated and then applied to bio-heat equation to derive the temperature changes. As shown in Fig. 8, it takes about 30 min for the energy transfer to arrive at the equilibrium state. For instance, the results show that the maximum temperature elevations are 0.31 and 0.26°C for quadrature excitation and shimming over the volume of the brain at 7 T.
Figure 8.
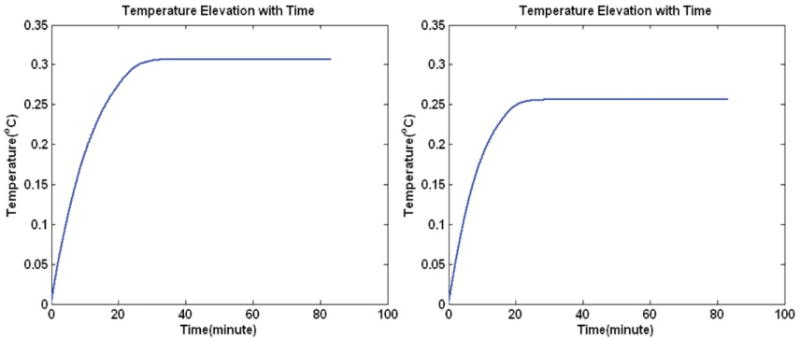
Temperature elevation (DT) changes with time for 7 T MRI. The left subplot is the increased temperature at the position where peak DT is located using quadrature excitation condition, and the right subplot is the peak DT under shimming aimed at minimizing the COV of the field distribution in the brain.
Figure 9 demonstrates the simulated results of ΔT and SAR within the human head model using quadrature excitation and the shimming (aimed at homogenizing the brain region) at 7 and 9.4 T. In each excitation case, the ΔT and SAR distributions are shown in the axial planes, where the maximum ΔT and the maximum SAR occur. For example, quadrature excitation results in a maximum local SAR of 1.79 W/kg, which results in 0.31°C temperature elevation to obtain an averaged field intensity of 1.174 μT over the brain. The results generally show that higher SAR results in higher temperature elevation, however, the SAR peak and the highest temperature rise do not always occur at locations within close proximity. For instance, the locations at which maximum ΔT and maximum SAR occur are quite different for shimming (aimed at homogenizing the brain region) at 9.4 T (see Fig. 9) where the SAR peak is located on the skin/air interface and the peak temperature elevation occur at a relatively far away location. These types of SAR peaks (occur at tissue/air interfaces) do not induce the highest temperature rise because the thermal energy at the boundary of the head model easily convicts to the cool environment. On the other hand and according to Fig. 9, the temperature rises due to the RF power deposition have very close spatial correlations with the SAR distributions away from air/tissue boundaries. The differences between ΔT and SAR in some cases are due to the variation of the perfusion rate between different tissues.
Figure 9.
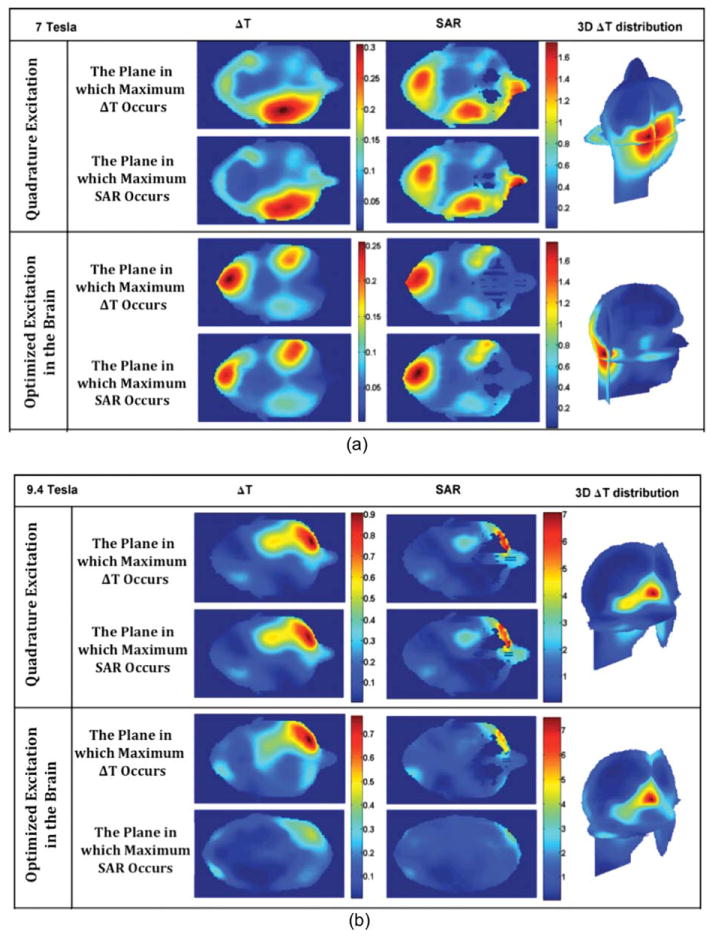
Temperature elevation (DT) and SAR (averaged over any 10 g of tissue) distributions using quadrature excitation and shimming in the brain at 7 and 9.4 T.
Conclusions
In this work, an in-house finite difference time domain MRI RF modeling package combined with shimming scheme is demonstrated numerically at 7 and 9.4 T and verified experimentally at 7 T, where shimming (fully based on RF modeling) using a coupled transmit array is performed without measurements. The agreement between the experimental and simulated data demonstrates the capability of simultaneously predicting RF coupling, field, and RF power. This presents a first step in changing the perception of MRI RF modeling as an educational/analytical tool to be more integrated into real-life, subject-specific MRI applications.
The presented numerical results show that the homogeneity of the field distribution can be improved in 14 regions across the volume of the human head model while constraining the total RF power absorbed by the human head. The selection of the 14 regions covers various volumes in different orientations throughout the volume of the whole head model. The results also show that in many regions across the volume of the human head, the proposed shimming scheme is capable of repolarizing the transverse magnetic field to the MRI necessary polarization (circular).
The results of the associated temperature calculation in the human head model show that the increased temperature has close spatial correlation with the SARs when the SAR peak is not located on the skin of the head. The little difference in the correlation between the ΔT and SAR distributions is due to the variation of the perfusion rate between different tissues.
Acknowledgments
This work was supported by National Institute of Health (grants # 1R01EB00984 and 1R01NS062065-01A2), Siemens Medical Solutions, and University of Pittsburgh's Alzheimer Disease Research Center.
References
- 1.Damen F, Holdsworth S, Atkinson I, Boskamp E, Claiborne T, Nauerth A, et al. Initial Experience with Sodium MRI of Phantoms and Human Brain at 9.4 Tesla. International Society for Magnetic Resonance in Medicine Annual Meeting; Seattle, WA. 2006. p. 3103. [Google Scholar]
- 2.Ugurbil K, Garwood M, Rath AR. Optimization of modulation functions to improve insensitivity of adiabatic pulses to variations in B1 magnitude. J Magn Reson. 1988;80:448–469. [Google Scholar]
- 3.Vaughan JT, Garwood M, Collins CM, Liu W, Dela-Barre L, Adriany G, et al. 7T vs. 4T: RF power, homogeneity, and signal-to-noise comparison in head images. Magn Reson Med. 2001;46:24–30. doi: 10.1002/mrm.1156. [DOI] [PubMed] [Google Scholar]
- 4.Lee R, Xue R, Brown R, Stephanescu C, Wang Y, Mizsei G, et al. Implementation of Mode-Scanning Excitation Method with a 16-ch Transmit/Receive Volume Strip Array at 7T. Proceedings 14th Scientific Meeting, International Society for Magnetic Resonance in Medicine; Seattle. 2006. p. 125. [Google Scholar]
- 5.Adriany G, Van de Moortele PF, Wiesinger F, Moel-ler S, Strupp JP, Andersen P, et al. Transmit and receive transmission line arrays for 7 Tesla parallel imaging. Magn Reson Med. 2005;53:434–445. doi: 10.1002/mrm.20321. [DOI] [PubMed] [Google Scholar]
- 6.Robitaille PML, Abduljalil AM, Kangarlu A, Zhang X, Yu Y, Burgess R, et al. Human magnetic resonance imaging at 8 T. NMR Biomed. 1998;11:263–265. doi: 10.1002/(sici)1099-1492(199810)11:6<263::aid-nbm549>3.0.co;2-0. [DOI] [PubMed] [Google Scholar]
- 7.Chen CN, Sank VJ, Cohen SM, Hoult DI. The field dependence of NMR imaging. I. Laboratory assessment of signal-to-noise ratio and power deposition. Magn Reson Med. 1986;3:722–729. doi: 10.1002/mrm.1910030508. [DOI] [PubMed] [Google Scholar]
- 8.Rosner CH, Markiewicz WD. High-field superconducting tape magnet technology. IEEE Trans Magn. 1992;28:782–786. [Google Scholar]
- 9.Heussner RW, Nunes CB, Lee PJ, Larbalestier PJ, Jablonski PD. Properties of niobium-titanium superconducting wires with Nb artificial pinning centers. J Appl Phys. 1996;80:1640–1646. [Google Scholar]
- 10.Bomsdorf H, Helzel T, Kunz D, Roschmann P, Tschendel O, Wieland J. Spectroscopy and imaging with a 4 tesla whole-body MR system. NMR Biomed. 1988;1:151–158. doi: 10.1002/nbm.1940010308. [DOI] [PubMed] [Google Scholar]
- 11.Schenck JF, Dumoulin CL, Redington RW, Kressel HY, Elliott RT, McDougall IL. Human exposure to 4.0-Tesla magnetic-fields in a whole-body scanner. Med Phys. 1992;19:1089–1098. doi: 10.1118/1.596827. [DOI] [PubMed] [Google Scholar]
- 12.Ibrahim TS, Abduljalil AM, Baertlein BA, Lee R, Robitaill PM. Analysis of B1 field profiles and SAR values for multi-strut transverse electromagnetic RF coils in high field MRI applications. Phys Med Biol. 2001;46:2545–2555. doi: 10.1088/0031-9155/46/10/303. [DOI] [PubMed] [Google Scholar]
- 13.Vaughan JT. How to do RF at high fields. The International Society of Magnetic Resonance in Medicine Annual Meeting: Morning Categorical Course: Human MRI and MRS at High Static Magnetic Fields; Miami, Florida. 2005. [Google Scholar]
- 14.Hoult DI. Sensitivity and power deposition in a high-field imaging experiment. J Magn Reson Imaging. 2000;12:46–67. doi: 10.1002/1522-2586(200007)12:1<46::aid-jmri6>3.0.co;2-d. [DOI] [PubMed] [Google Scholar]
- 15.Collins CM, Liu W, Wang J, Gruetter R, Vaughan JT, Ugurbil K, et al. Temperature and SAR calculations for a human head within volume and surface coils at 64 and 300 MHz. J Magn Reson Imaging. 2004;19:650–656. doi: 10.1002/jmri.20041. [DOI] [PubMed] [Google Scholar]
- 16.Collins CM, Smith MB. Signal-to-noise ratio and absorbed power as functions of main magnetic field strength, and definition of “90 degrees” RF pulse for the head in the birdcage coil. Magn Reson Med. 2001;45:684–691. doi: 10.1002/mrm.1091. [DOI] [PubMed] [Google Scholar]
- 17.Ibrahim TS. A numerical analysis of radio-frequency power requirements in magnetic resonance imaging experiment. IEEE Trans Microwave Theory Tech. 2004;52:1999–2003. [Google Scholar]
- 18.Chen J, Feng ZM, Jin JM. Numerical simulation of SAR and B-1-field inhomogeneity of shielded RF coils loaded with the human head. IEEE Trans Biomed Eng. 1998;45:650–659. doi: 10.1109/10.668756. [DOI] [PubMed] [Google Scholar]
- 19.Collins CM, Li S, Smith MB. SAR and B1 field distributions in a heterogeneous human head model within a birdcage coil. Specific energy absorption rate. Magn Reson Med. 1998;40:847–856. doi: 10.1002/mrm.1910400610. [DOI] [PubMed] [Google Scholar]
- 20.Collins CM, Liu W, Swift BJ, Smith MB. Combination of optimized transmit arrays and some receive array reconstruction methods can yield homogeneous images at very high frequencies. Magn Reson Med. 2005;54:1327–1332. doi: 10.1002/mrm.20729. [DOI] [PubMed] [Google Scholar]
- 21.Ibrahim TS, Lee R, Baertlein BA, Abduljalil AM, Zhu H, Robitaille PM. Effect of RF coil excitation on field inhomogeneity at ultra high fields: a field optimized TEM resonator. J Magn Reson Imaging. 2001;19:1339–1347. doi: 10.1016/s0730-725x(01)00404-0. [DOI] [PubMed] [Google Scholar]
- 22.Ibrahim TS, Lee R, Baertlein BB, Robitaille PML. Optimized radiofrequency resonators for high field NMR clinical imaging. IEEE International Symposium on Antennas and Propagation; Salt Lake City, Utah. 2000. pp. 1080–1083. [Google Scholar]
- 23.Wang ZJ, Wang DJ. An RF field pattern with improved B-1 amplitude homogeneity. Concepts Magn Reson B: Magn Reson Eng. 2005;24:1–5. [Google Scholar]
- 24.Ibrahim TS, Tang L. Insight into RF power requirements and B1 field homogeneity for human MRI via rigorous FDTD approach. J Magn Reson Imaging. 2007;25:1235–1247. doi: 10.1002/jmri.20919. [DOI] [PubMed] [Google Scholar]
- 25.Ibrahim TS, Hue YK, Gilbert R, Boada FE. Tic tac toe: highly-coupled, load insensitive Tx/Rx array and a quadrature coil without lumped capacitors. International Society for Magnetic Resonance in Medicine Annual Meeting; Toronto, Canada. 2008. [Google Scholar]
- 26.Setsompop K, Alagappan V, Gagoski B, Witzel T, Polimeni J, Potthast A, et al. Slice-selective RF pulses for in vivo B1+ inhomogeneity mitigation at 7 tesla using parallel RF excitation with a 16-element coil. Magn Reson Med. 2008;60:1422–1432. doi: 10.1002/mrm.21739. [DOI] [PMC free article] [PubMed] [Google Scholar]
- 27.Van den Berg CA, van den Bergen B, Van de Kamer JB, Raaymakers BW, Kroeze H, Bartels LW, et al. Simultaneous B1 1 homogenization and specific absorption rate hotspot suppression using a magnetic resonance phased array transmit coil. Magn Reson Med. 2007;57:577–586. doi: 10.1002/mrm.21149. [DOI] [PubMed] [Google Scholar]
- 28.van den Bergen B, van den Berg CAT, Bartels LW, Lagendijk JJW. 7 T body MRI: B-1 shimming with simultaneous SAR reduction. Phys Med Biol. 2007;52:5429–5441. doi: 10.1088/0031-9155/52/17/022. [DOI] [PubMed] [Google Scholar]
- 29.Roschmann PK. High-frequency coil system for magnetic resonance imaging apparatus. 4746866 US Patent. 1988
- 30.Li BK, Liu F, Crozier S. Focused, eight-element transceive phased array coil for parallel magnetic resonance imaging of the chest-theoretical considerations. Magn Reson Med. 2005;53:1251–1257. doi: 10.1002/mrm.20505. [DOI] [PubMed] [Google Scholar]
- 31.Shellock FG. Radiofrequency energy-induced heating during MR procedures: a review. J Magn Reson Imaging. 2000;12:30–36. doi: 10.1002/1522-2586(200007)12:1<30::aid-jmri4>3.0.co;2-s. [DOI] [PubMed] [Google Scholar]
- 32.Collins CM, Smith MB. Calculations of B(1) distribution, SNR, and SAR for a surface coil adjacent to an anatomically-accurate human body model. Magn Reson Med. 2001;45:692–699. doi: 10.1002/mrm.1092. [DOI] [PubMed] [Google Scholar]
- 33.Collins CM, Smith MB. Spatial resolution of numerical models of man and calculated specific absorption rate using the FDTD method: a study at 64 MHz in a magnetic resonance imaging coil. J Magn Reson Imaging. 2003;18:383–388. doi: 10.1002/jmri.10359. [DOI] [PubMed] [Google Scholar]
- 34.Zhai Z, DeMeester G, Morich M, Shvartsman S, Kleihorst R. Numerical evaluation of B1-field and SAR for heterogeneous and homogeneous body model. Proceedings of the 12th Annual Meeting of ISMRM; Kyoto, Japan. 2004. [Google Scholar]
- 35.Hand J, Li Y, Thomas E, Rutherford M, Hajnal J. Prediction of specific absorption rate in mother and fetus associated with MRI examinations during pregnancy. Magn Reson Med. 2006;55:883–893. doi: 10.1002/mrm.20824. [DOI] [PubMed] [Google Scholar]
- 36.Liu W, Mao W, Smith M, Collins C. Calculated local and average SAR in comparison with regulatory limits. Proceedings 14th Scientific Meeting, International Society for Magnetic Resonance in Medicine; Seattle. 2006. p. 2044. [Google Scholar]
- 37.Ibrahim TS, Lee R, Baertlein BA, Robitaille PM. B1 field homogeneity and SAR calculations for the birdcage coil. Phys Med Biol. 2001;46:609–619. doi: 10.1088/0031-9155/46/2/324. [DOI] [PubMed] [Google Scholar]
- 38.Jin JM, Chen J. On the SAR and field inhomogeneity of birdcage coils loaded with the human head. Magn Reson Med. 1997;38:953–963. doi: 10.1002/mrm.1910380615. [DOI] [PubMed] [Google Scholar]
- 39.Schwarz AJ, Rijpkema M, Collins DJ, Payne GS, Prock T, Woodward AC, et al. SAR and tissue heating with a clinical (31)P MRS protocol using surface coils, adiabatic pulses, and proton-decoupling. Magn Reson Med. 2000;44:692–700. doi: 10.1002/1522-2594(200011)44:5<692::aid-mrm6>3.0.co;2-d. [DOI] [PubMed] [Google Scholar]
- 40.Simunic D, Wach P, Renhart W, Stollberge R. Spatial distribution of high-frequency electromagnetic energy in human head during MFU: numerical results and measurements. IEEE Trans Biomed Eng. 1996;43:88–96. doi: 10.1109/10.477704. [DOI] [PubMed] [Google Scholar]
- 41.Hand JW, Lau RW, Lagendijk JJW, Ling JX, Burl M, Young IR. Electromagnetic and thermal modeling of SAR and temperature fields in tissue due to an RF decoupling coil. Magn Reson Med. 1999;42:183–192. doi: 10.1002/(sici)1522-2594(199907)42:1<183::aid-mrm24>3.0.co;2-i. [DOI] [PubMed] [Google Scholar]
- 42.Wang Z, Lin JC, Mao W, Liu W, Smith MB, Collins CM. SAR and temperature: simulations and comparison to regulatory limits for MRI. J Magn Reson Imaging. 2007;26:437–441. doi: 10.1002/jmri.20977. [DOI] [PMC free article] [PubMed] [Google Scholar]
- 43.Wang Z, Lin JC, Vaughan JT, Collins CM. Consideration of physiological response in numerical models of temperature during MRI of the human head. J Magn Reson Imaging. 2008;28:1303–1308. doi: 10.1002/jmri.21556. [DOI] [PMC free article] [PubMed] [Google Scholar]
- 44.Nguyen U, Brown J, Chang I, Krycia J, Mirotznik M. Numerical evaluation of heating of human head due to magnetic resonance image. IEEE Trans Biomed Eng. 2004;51:1301–1309. doi: 10.1109/TBME.2004.827559. [DOI] [PubMed] [Google Scholar]
- 45.Hand JW, Lagendijk JJW, Hajnal JV, Lau RW, Young IR. SAR and temperature changes in the leg due to an RF decoupling coil at frequencies between 64 and 213 MHz. J Magn Reson Imaging. 2000;12:68–74. doi: 10.1002/1522-2586(200007)12:1<68::aid-jmri7>3.0.co;2-2. [DOI] [PubMed] [Google Scholar]
- 46.Ibrahim TS, Mitchell C, Schmalbrock P, Lee R, Cha-keres DW. Electromagnetic perspective on the operation of RF coils at 1.5-11.7 Tesla. Magn Reson Med. 2005;54:683–690. doi: 10.1002/mrm.20596. [DOI] [PubMed] [Google Scholar]
- 47.Vaughan JT, Hetherington HP, Otu JO, Pan JW, Pohost GM. High frequency volume coils for clinical NMR imaging and spectroscopy. Magn Reson Med. 1994;32:206–218. doi: 10.1002/mrm.1910320209. [DOI] [PubMed] [Google Scholar]
- 48.Ibrahim TS, Kangarlu A, Chakeress DW. Design and performance issues of RF coils utilized in ultra high field MRI: experimental and numerical evaluations. IEEE Trans Biomed Eng. 2005;52:1278–1284. doi: 10.1109/TBME.2005.847564. [DOI] [PubMed] [Google Scholar]
- 49.Vaughan JT, Hetherington HP, Otu JO, Pan JW, Pohost GM. High-frequency volume coils for clinical NMR imaging and spectroscopy. Magn Reson Med. 1994;32:206–218. doi: 10.1002/mrm.1910320209. [DOI] [PubMed] [Google Scholar]
- 50.Yee KS. Numerical solutions of the initial boundary value problems involving Maxwell's equations in isotropic media. IEEE Trans Ant Prop. 1966;14:302–317. [Google Scholar]
- 51.Ibrahim TS, Lee R, Baertlein BA, Kangarlu A, Robitaille PL. Application of finite difference time domain method for the design of birdcage RF head coils using multi-port excitations. Magn Reson Imaging. 2000;18:733–742. doi: 10.1016/s0730-725x(00)00143-0. [DOI] [PubMed] [Google Scholar]
- 52.Abraham R, Ibrahim TS. Proposed radiofrequency phased-array excitation scheme for homogenous and localized 7-Tesla whole-body imaging based on full-wave numerical simulations. 2007;57:235–242. doi: 10.1002/mrm.21139. [DOI] [PubMed] [Google Scholar]
- 53.Ugurbil K, Vaughan J, DelaBarre L, Snyder C. A parallel transceiver for human imaging at 9.4T. Proceedings 14th Scientific Meeting, International Society for Magnetic Resonance in Medicine; Seattle. 2006. p. 130. [Google Scholar]
- 54.Collins C, Smith M, Vaughan J, Wang Z, Mao W, Fang J, et al. Multi-coil composite pulses for whole-brain homogeneity improved over RF shimming alone. Proceedings 14th Scientific Meeting, International Society for Magnetic Resonance in Medicine; Seattle. 2006. p. 702. [Google Scholar]
- 55.Hoult DI, Chen CN, Sank VJ. Quadrature detection in the laboratory frame. Magn Reson Med. 1984;1:339–353. doi: 10.1002/mrm.1910010305. [DOI] [PubMed] [Google Scholar]
- 56.Ibrahim TS, Abraham D, Rennaker RL. Electromagnetic power absorption and temperature changes due to brain machine interface operation. Ann Biomed Eng. 2007;35:825–834. doi: 10.1007/s10439-007-9264-3. [DOI] [PubMed] [Google Scholar]
- 57.DeMarco SC, Lazzi G, Liu WT, Weiland JD, Humayun MS. Computed SAR and thermal elevation in a 0.25-mm 2-D model of the human eye and head in response to an implanted retinal stimulator. I. Models and methods. IEEE Trans Antennas Propag. 2003;51:2274–2285. [Google Scholar]
- 58.Duck FA. Physical Properties of Tissue: A Comprehensive Reference Book. Academic Press; 1990. [Google Scholar]
- 59.Bernardi P, Cavagnaro M, Pisa S, Piuzzi E. Specific absorption rate and temperature elevation in a subject exposed in the far-field of radio-frequency sources operating in the 10–900-MHz range. IEEE Trans Biomed Eng. 2003;50:295–304. doi: 10.1109/TBME.2003.808809. [DOI] [PubMed] [Google Scholar]
- 60.Beckmann G, Gilli PV. Thermal Energy Storage: Basics, Design, Applications to Power Generation and Heat Supply. 1st. Springer; 2002. [Google Scholar]
- 61.Lazzi G, DeMarco SC, Liu WT, Weiland JD, Humayun MS. Computed SAR and thermal elevation in a 0.25-mm 2-D model of the human eye and head in response to an implanted retinal stimulator. II. Results. IEEE Trans Antennas Propag. 2003;51:2286–2295. [Google Scholar]
- 62.Ibrahim TS, Abraham D, Rennaker R. Electromagnetic power absorption and temperature changes due to brain machine interface operation. Ann Biomed Eng. 2007;35:825–834. doi: 10.1007/s10439-007-9264-3. [DOI] [PubMed] [Google Scholar]
- 63.Ibrahim TS, Lee R. Evaluation of MRI RF probes utilizing infrared sensors. IEEE Trans Biomed Eng. 2006;53:963–967. doi: 10.1109/TBME.2006.871892. [DOI] [PubMed] [Google Scholar]
- 64.Kangarlu A, Ibrahim TS, Shellock FG. Effects of coil dimensions and field polarization on RF heating inside a head phantom. Magn Reson Imaging. 2005;23:53–60. doi: 10.1016/j.mri.2004.11.007. [DOI] [PubMed] [Google Scholar]
- 65.Ibrahim TS, Mitchell C, Abraham R, Schmalbrock P. In-depth study of the electromagnetics of ultra-high-field MRI. NMR Biomed. 2007;20:58–68. doi: 10.1002/nbm.1094. [DOI] [PubMed] [Google Scholar]
- 66.Ibrahim TS, Lee R, Baertlein BA, Kangarlu A, Robitaille PML. On the physical feasibility of achieving linear polarization at high-field: a study of the birdcage coil. International Society for Magnetic Resonance in Medicine Annual Meeting; Philadelphia, PA. 1999. p. 2058. [Google Scholar]


