

Abstract
Four influenza pandemics have struck the human population during the last 100 years causing substantial morbidity and mortality. The pandemics were caused by the introduction of a new virus into the human population from an avian or swine host or through the mixing of virus segments from an animal host with a human virus to create a new reassortant subtype virus. Understanding which changes have contributed to the adaptation of the virus to the human host is essential in assessing the pandemic potential of current and future animal viruses. Here, we develop a measure of the level of adaptation of a given virus strain to a particular host. We show that adaptation to the human host has been gradual with a timescale of decades and that none of the virus proteins have yet achieved full adaptation to the selective constraints. When the measure is applied to historical data, our results indicate that the 1918 influenza virus had undergone a period of preadaptation prior to the 1918 pandemic. Yet, ancestral reconstruction of the avian virus that founded the classical swine and 1918 human influenza lineages shows no evidence that this virus was exceptionally preadapted to humans. These results indicate that adaptation to humans occurred following the initial host shift from birds to mammals, including a significant amount prior to 1918. The 2009 pandemic virus seems to have undergone preadaptation to human-like selective constraints during its period of circulation in swine. Ancestral reconstruction along the human virus tree indicates that mutations that have increased the adaptation of the virus have occurred preferentially along the trunk of the tree. The method should be helpful in assessing the potential of current viruses to found future epidemics or pandemics.
Keywords: adaptive evolution, antigenic shift, virus evolution, H1N1, selective constraints, Spanish flu
Introduction
Influenza A is a negative-strand RNA virus with a genome composed of eight genetic segments encoding 11 proteins. Influenza A viruses are categorized by the antigenicity of the two surface glycoproteins, the hemagglutinin (HA) and neuraminidase, which are differentiated as 16 (H1–H16) and 9 (N1–N9) subtypes, respectively. Although the natural reservoir of influenza A is waterfowl, where the virus propagates causing little or no disease (Webster et al. 1992), viruses periodically transmit to other host species resulting infrequently in a stable lineage in, for example, poultry, swine, and most significantly, humans. These host-shift events can result from the transfer of a complete virus from one host to another or from genetic reassortment, where a chimera is formed by the mixing of genetic segments from a virus of a different host with genetic segments of a virus already circulating in the “new” host.
Over the last century, four influenza pandemics have resulted from the establishment of a new virus in humans as a result of the introduction of genetic elements from an animal virus either in toto or through reassortment causing substantial morbidity and mortality. In 1918–1919, an influenza A H1N1 virus pandemic struck the human population, infecting a third of the world population and killing 2.5% of those infected (Taubenberger and Morens 2006), causing over 50 million deaths (Johnson and Mueller 2002). Around the same time, a panzootic was observed in swine, which is thought to have been the origin of the “classical swine” lineage observed especially in North America. The timing and nature of the host-shift events that caused the near simultaneous human and swine epidemics have been a matter of controversy (Reid et al. 2004; Taubenberger et al. 2005; Antonovics et al. 2006; Gibbs M and Gibbs A 2006; Taubenberger 2006; dos Reis et al. 2009; Smith, Bahl, et al. 2009). Reassortment, whereby circulating human viruses acquired novel avian-like gene segments, resulted in two further pandemics in 1957 (H2N2) and 1968 (H3N2) (Kawaoka et al. 1989; Schafer et al. 1993). After each of these pandemics, the new virus replaced the previously circulating subtype. In 1977, an H1N1 virus reappeared in the human population and cocirculated with H3N2 until 2009. The reemerging virus closely resembled the H1N1 viruses that had circulated approximately 25 years earlier (Nakajima et al. 1978; dos Reis et al. 2009), suggesting that the virus was a member of the 1957 lineage and had been held in artificial evolutionary stasis during this time (Palese 2004).
In the late 1970s, an independent “Eurasian swine” H1N1 lineage resulted from a direct transmission from an avian host to pigs (Pensaert et al. 1981). In the late 1990s, a series of reassortant viruses appeared in pigs in North America that initially combined genetic elements from human H3N2 (PB1, H3, and N2) with classical swine viruses followed by the introduction of genetic elements from avian influenza (PA and PB2) (Zhou et al. 1999). This “triple-reassortant” strain then underwent various reassortments acquiring genetic elements from classical swine (H1) and Eurasian swine (N1 and MP) before undergoing a host shift to humans, resulting in the novel “swine origin” influenza virus (pandemic H1N1 2009). First identified in April 2009 (Centers for Disease Control and Prevention 2009; Dawood et al. 2009; Smith, Vijaykrishna, et al. 2009), it quickly spread throughout the world, causing the first pandemic of the 21st century (Fraser et al. 2009). The major events over the last century of relevance to humans are listed in table 1.
Table 1.
Significant Events of Relevance to Recent Human Pandemics.
| Year | Event | Segments | Resulting Pandemic/Panzootic Lineage |
| Pre-1918 | Host shift: ? to swine | ? | Classical swine (H1N1) |
| Pre-1918 | Host shift: ? to human | ? | Spanish flu (H1N1) |
| 1957 | Host shift: avian to human | H2, N2, PB1 | Asian flu (H2N2) |
| 1968 | Host shift: avian to human | H3, PB1 | Hong Kong flu (H3N2) |
| 1977 | Reintroduction of human H1N1 virus | All segments | Russian flu (H1N1) |
| Late 1970s | Avian to swine | All segments | Eurasian swine (H1N1) |
| Late 1990s | Host shift: human to swine | H3, N2, PB1 from human | Reassortant swine (H3N2) |
| Late 1990s | Host shift: avian to swine | PA, PB2 | Triple-reassortant swine (H3N2) |
| Pre-2009 | Mixing between swine | H1 from classical swine; N1, M from Eurasian swine; NS, NP, PA, PB1, PB2 from Triple-reassortant | H1N1 |
| 2009 | Swine to human | All segments | Pandemic H1N1 2009 |
Although sporadic cross-species transmissions are common, transmissions leading to the establishment of new mammalian lineages have been relatively rare. For a virus to infect, replicate, and transmit efficiently in a different host species, it must undergo a series of host-specific adaptations. It must have a HA protein that can efficiently bind to and infect the host cell (Rogers et al. 1983; Nobusawa et al. 1991; Connor et al. 1994; Vines et al. 1998; Matrosovich et al. 2000). It also requires a polymerase and nucleoprotein complex that can actively replicate the virus genome within the targeted host cells. This involves the polymerase and ribonucleoprotein complex interacting with host-specific nuclear import factors so that replication can take place inside the nucleus. The polymerase complex should also efficiently replicate the virus RNA at the host-specific body temperature (for reviews, see Naffakh et al. 2008; Ruigrok et al. 2010). The virus must also confront the various host-specific immune responses. The mechanisms of adaptation are poorly understood, and all virus proteins may potentially play some role. Host shifts occur due to a mixture of factors, including virus potential, host susceptibility, and possibly chance occurrences. Although a comprehensive understanding of host shifts would require addressing all these aspects, assessing the degree of adaptation of the virus to the new host is an important factor in assessing the potential pandemic risk of new strains.
We recently developed a maximum likelihood phylogenetic method to detect and characterize amino acid locations in influenza virus proteins that evolve under host-specific constraints (Tamuri et al. 2009). In this paper, we describe how we can use these measures to characterize how well any given virus sequence is adapted to the selective constraints imposed by avian or human hosts. We focus on the host shift that led to the 1918 H1N1 pandemic and the process of adaptation of the viral proteins during the approximately 70 years that the viruses have circulated in the human population. We address such questions as the rate of host adaptation for the individual proteins, the degree of human adaptation found in currently circulating strains, and how the avian viruses that initiate human pandemics compare with other avian viruses.
Materials and Methods
Host Adaptation Measure
In addition to identifying locations in influenza proteins where there is a change in selective constraints following a host shift from birds to humans, our previous work also provided us with the expected equilibrium frequency of amino acid Ai at identified location k evolving in host h, πkh(Ai) (Tamuri et al. 2009). We can use these equilibrium frequencies to construct a measure of host adaptation. Consider that we have identified N locations in a given protein where there is a difference in selective constraints in human and avian hosts. If we assume that the selective constraints act at the protein level, we can, following Yang and Nielsen (2008), express the equilibrium frequencies πkh(Ai) in terms of the “fitness parameters” for those amino acids Fkh(Ai):
| (1) |
where πIl* represents the background equilibrium frequency for the nucleotide found in position l of codon I, and the sum is over all codons that code for amino acid Ai. With this expression, we can write Fkh(Ai) = K(Ai) + log(πkh(Ai)), where K(Ai) represents the nucleotide biases and the proportionality constant. Assuming that the fitness effects of the different locations are additive, we can create a measure of host adaptation θh({Sk}) of a virus with amino acid sequence {Sk}, where Sk is the amino acid found at identified location k:
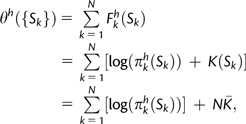 |
(2) |
where we have replaced the sum of K(Ai) with the average value of K(Ai), N times  , which is only a function of the background distribution of nucleotides and should not vary significantly from one sequence to another.
Fully adapted proteins that had equilibrated with the selective constraints would have amino acid frequencies at the various sites given by the equilibrium frequencies πkh(Ai). We can model random proteins as having amino acid frequencies at each location given by π0(Ai), the frequency of amino acid Ai averaged over our influenza sequence database. For convenience, we scale θh({Sk}) so that an ensemble of random proteins have an average host adaptedness of 0, whereas an ensemble of fully adapted proteins have an average host adaptedness of 1 by computing
| (3) |
where 〈θh〉Random and 〈θh〉Adapted represent the average value of θh({Sk}) for an ensemble of random and adapted sequences, respectively:
 |
(4) |
Note that N drops out of equation (3) and does not need to be computed. Our results and conclusions were negligibly affected by our choice of π0(Ai), which was only used to scale the adaptedness values. We call Hh the “human adaptedness” when the host h is human and the “avian adaptedness” when the host is avian. Further discussion of this measure as well as a numerical example is provided in the Appendix.
Individual sequences can have host adaptedness values less than zero or greater than one if the sequences have a greater number of especially unfavorable (low equilibrium frequency πkh(Ai)) residues compared with random sequences or a greater number of favorable (high equilibrium frequency πkh(Ai)) residues compared with fully adapted sequences.
The maximum likelihood estimate of πkh(Ai) is zero for all amino acids not present at identified location k. In order to avoid logarithms of zero in equations (2) and (4), we incorporated pseudocounts into the calculation of πkh(Ai):
| (5) |
where δ was set equal to 10−6. Varying δ did not appreciably change the results.
Sequence Data and Analysis
The data collection and analysis were performed as described previously (Tamuri et al. 2009). Briefly, sequences for human and avian influenza A viruses (excluding laboratory strains) were obtained from the NCBI Influenza Virus Resource Database (Bao et al. 2008). The sequence data were culled to eliminate near-identical sequences and the result of sporadic transmissions between hosts. The sequences were aligned at the amino acid level (MUSCLE; Edgar 2004) and converted to nucleotide codon alignments (PAL2NAL; Suyama et al. 2006); the nucleotide data were used to construct separate phylogenetic trees for each gene segment using PhyML (Guindon and Gascuel 2003; HKY85 model; Hasegawa et al. 1985; gamma-distributed rates). Branch lengths representing amino acid evolutionary distances were then optimized for this fixed-tree topology using the corresponding amino acid data (PAML; Yang 1997, 2007; WAG substitution matrix; Whelan and Goldman 2001; gamma-distributed rates). The number of sequences used (with the exception of the PB1, M1, and M2; see below) is listed in table 2. The phylogenetic trees are shown in figure 1.
Table 2.
Protein Sequences Used in the Analysis.
| Protein | Alignment Length | Number of Human Sequences | Number of Avian Sequences |
| H1 | 566 | 404 | 30 |
| N1 | 470 | 274 | 232 |
| NS1 | 305 | 61 | 312 |
| NP | 507 | 122 | 308 |
| PA | 716 | 60 | 347 |
| PB2 | 759 | 80 | 321 |
FIG. 1.

Phylogenetic trees of the various genes in the analysis, with host and lineage indicated by branch colors: avian (black), human (red), classical swine (blue), and Eurasian swine (cyan). For PA and PB2, we additionally include triple-reassortant swine sequences (green). The location of the host shift used in the calculations is indicated by an orange dot. Shifting the location of the host-shift event did not appreciably change the results. 1918 and pandemic H1N1 2009 sequences are labeled. Horizontal line represents a branch length corresponding to 0.1 nucleotide substitutions per site. Only the avian and human sequences were used in determining the significant locations, the equilibrium amino acid frequencies, and the ancestral reconstructions as explained in the text.
We then identified locations with significant support for having undergone changes in selective constraints accompanying the host-shift event from birds to humans, using the analysis described previously (Tamuri et al. 2009), related to the approach described by Forsberg and Christiansen (2003). In this method, locations in the influenza genome were analyzed under two models. The first model assumes that the pattern of evolution for the given location is host independent, and the site-specific amino acid composition is estimated. The second model assumes that the pattern of evolution for the given location depends on the particular host (avian or human), and two sets of site-specific amino acid compositions (one for each host) are estimated. The likelihoods of the two models were compared, and the statistical significance of the host-specific model was obtained for the given location. The procedure was then repeated for all polymorphic locations in all proteins, and a false discovery rate (FDR) approach (Benjamini and Hochberg 1995) was used to correct for multiple testing, resulting in a set of locations that differ in the two hosts.
Using a FDR cutoff of 0.20, we identified 294 sites on six different proteins as described in the supplementary material, Supplementary Material online (H1: 84 sites, N1: 68 sites, NS1: 28 sites, NP: 48 sites, PA: 27 sites, and PB2: 39 sites). (M1, M2, and PB1 have relatively few locations undergoing changes in selective constraints and thus do not have sufficiently robust statistics for computing human and avian adaptedness.) We used these 294 sites to calculate host adaptedness for the various human and avian virus sequences as well as for the pandemic H1N1 2009 virus and selected classical swine and Eurasian swine virus sequences, using equations (2–4) described above. The strains used in the analysis and their host adaptedness values are included as supplementary material, Supplementary Material online. Varying the FDR threshold between 5% and 20% or random resampling of included sites results in different magnitudes of change in adaptedness but has little effect on the qualitative results.
Reconstructing the Host-Shift Sequence
We are also interested in studying the host adaptedness of the ancestor of the 1918 pandemic virus. The host shift was assumed to have occurred at the midpoint of the branch connecting the parent node of the 1918 human H1N1 sequence with its parent as shown in figure 1. (Moving the host shift along this branch did not appreciably affect the results of the calculation.) Using the maximum likelihood of our site-wise nonhomogenous model, we calculated the posterior probability of every amino acid for every site at the host-shift event (Koshi and Goldstein 1996). We sampled sequences from the posteriors 1,000 times, calculating the host adaptedness for each reconstruction. The mean and 95% confidence intervals (CIs) of the human adaptedness and avian adaptedness measures were constructed based on this sampling.
Reconstructing the Pattern of Sequence Changes
We performed a reconstruction of the most likely set of substitutions for each protein using the joint reconstruction method of Pupko (Pupko et al. 2000) under the WAG amino acid substitution model (Whelan and Goldman 2001) with site-optimized rates. We then calculated human adaptedness measures for each node of the phylogenetic tree following the avian-to-human host shift. By traversing the phylogenetic tree for the protein starting at the host-shift node down through the human lineage, we calculated the change in human adaptedness along the trunk of tree, leaf nodes, and the remaining internal branches.
Fits to Host Adaptedness Data
To study the change in host adaptedness with time, we fit the host adaptedness of human virus sequences (ignoring sporadic H5N1 infections) as a function of isolation date to two possible functional forms: (a) an exponential decay to baseline equal to 1.0, where H(t) = 1 − Aexp( − t/τ), and (b) an exponential decay to an adjustable baseline, where H(t) = B − Aexp( − t/τ). The adjustable parameters are, as appropriate, the amplitude of change A, the adaptation time τ, and the asymptotic value B. We subtracted 25 years from the isolation date of post-1977 human H1N1 viruses corresponding to the time that these viruses were in artificial evolutionary stasis (dos Reis et al. 2009). We used the likelihood ratio test (P < 0.05) to test whether model (a) can be rejected in favor of (b) as outlined in the Appendix. For the chosen model, we calculated CIs for the parameters and the time when the fit matches the human adaptedness at the host-shift sequence through bootstrapping by sampling the residuals.
Results
Figure 2 shows the host adaptedness (human or avian) values computed for the H1, N1, NS1, NP, PA, and PB2 proteins for a variety of avian, human, and swine viruses. Points representing the human pandemic viruses of 1918 and 2009 are indicated. In addition, we represent the position of the reconstructed virus at the host-shift event that gave rise to the 1918 pandemic. This figure highlights that the avian sequences are at equilibrium, clustering around 1.0, whereas mammalian viruses are spread out, suggesting an ongoing adaptation process.
FIG. 2.

Host adaptedness values for a series of different virus sequences, including avian (black), human (red), classical swine (blue), Eurasian swine (cyan), and the host-shift sequence (orange). Open red circles represent post-1977 human H1N1 viruses whose isolation times were corrected as described in the text. Error bars for the host-shift sequence represent the 95% CI indicating the uncertainty in the ancestral reconstruction. For PA and PB2, we additionally include triple-reassortant swine sequences (green). 1918 and pandemic H1N1 2009 sequences are labeled. Human sequences inside the distribution of avian sequences represent sporadic H5N1 infections.
To evaluate whether the virus at the pre-1918 host-shift event was a typical or exceptional avian virus, we calculated the fraction of avian viruses that were less well adapted to avian and human hosts compared with the host-shift virus. As shown in figure 3, the avian adaptedness and human adaptedness of the host-shift virus are generally within the distribution of values obtained for other avian viruses, although, interestingly, the polymerase proteins (PA and PB2) have relatively high avian adaptedness. This suggests that the host-shift virus was not exceptionally preadapted to humans. Figure 3 also shows how the pandemic H1N1 2009 virus proteins compared with the corresponding proteins of the lineage from which the genetic element came (i.e., the human adaptedness and avian adaptedness values for the H1, NS1, and NP proteins are compared with those from classical swine viruses, those for PA and PB2 are compared with avian virus proteins, and N1 is compared with the corresponding protein of Eurasian swine viruses). The pandemic H1N1 2009 virus proteins, with the exception of N1, seem to be more adapted to humans than might be expected. In particular, the human adaptedness of the pandemic H1N1 2009 PA protein is larger than 99% of the corresponding proteins from avian viruses. The N1 protein actually has a lower human adaptedness than the other Eurasian swine N1 proteins, with a human adaptedness value more typical of avian sequences; the latter results from residues V13, A75, and R257, all three of which are rare in human and swine (as well as avian) viruses. The pandemic H1N1 2009 PA and PB2 proteins have high human adaptedness, even relative to the distribution found in the swine triple reassortants. Contributing to this are the PB2 A684S and PA K356R substitutions that have occurred in these two proteins prior to the 2009 pandemic (Tamuri et al. 2009).
FIG. 3.

Comparison of various proteins from the pre-1918 host-shift reconstruction and pandemic H1N1 2009 virus with those of the host viruses from which they emerged. Points in blue show the percentage of avian virus protein sequences that have avian and human adaptedness values lower than that of the pre-1918 host-shift reconstruction. Points in red show the percentage of avian (PA and PB2), Eurasian swine (N1), or classical swine (H1, NP, and NS1) virus sequences with human adaptedness or avian adaptedness values lower than the pandemic H1N1 2009 sequences. The human adaptedness values for the pre-1918 host-shift proteins are well within the distribution expected for avian sequences, suggesting that the host-shift virus was not exceptional, whereas the pandemic H1N1 2009 virus proteins, with the exception of N1, have greater than average human adaptedness, indicating preadaptation to the new human host.
Figure 4 shows the changing avian adaptedness and human adaptedness values as a function of isolation year. Waterfowl virus proteins show an average avian adaptedness close to one, agreeing with the notion that waterfowl is the natural reservoir of influenza A. Conversely, human viruses show a trend toward increasing human adaptedness and decreasing avian adaptedness with time of isolation. Interestingly, the 1918 human virus shows intermediate values for both avian adaptedness and human adaptedness, especially for the H1 segment.
FIG. 4.

Human adaptedness and avian adaptedness values for a series of different virus sequences as a function of time. Color coding is as in figure 1, including avian (black), human (red), classical swine (blue), Eurasian swine (cyan), triple-reassortant (green), and the host-shift sequence (orange). Open red circles represent post-1977 human H1N1 viruses whose isolation times were corrected as described in the text. Human sequences inside the distribution of avian sequences represent sporadic H5N1 infections. Abscissa error bars for the host-shift sequence represent 95% CIs for the timing of this event as determined from an analysis of nucleotide evolution (dos Reis et al. 2009), whereas ordinate error bars indicate the uncertainty of the ancestral reconstruction. Least-squares fits to the human adaptedness of the human virus sequences, as described in the text, are included as a solid line, whereas the extrapolation to the host-shift event is shown as a dashed line.
Also included in figure 4 is a least-squares fit of an exponential to the human adaptedness data for the human virus lineage, performed as described in the Materials and Methods section. Fitting parameters are shown in table 3. Best fits were obtained with a timescale for adaptation (τ, the time necessary for 63.2% of the adaptation to occur) on the order of 30–70 years, fastest for H1, N1, NP, and PB2 and slowest for NS1. We would expect that the asymptotic human adaptedness values for these extrapolations should equal 1.0. In fact, significantly better fits were obtained for four of the proteins when the asymptotic values are larger (H1 and N1) or smaller (NP and PB2) than 1.0. Extrapolation of these fits to the human adaptedness at the host-shift event can provide an estimate of the timing of this host shift. We performed a bootstrap analysis by sampling on the residuals. The estimated host-shift timings are all consistent with previous estimates (1883–1912) based on nucleotide evolution (dos Reis et al. 2009).
Table 3.
Curve-Fitting Parameters with 95% CIs.
| Protein | Adaptation Time τ (years) | Equilibrium Value (if different from 1.0) | Host-Shift Year |
| H1 | 33.50 (33.21, 35.42) | 1.08 (1.08, 1.09) | 1907.3 (1906.1, 1907.8) |
| N1 | 33.57 (31.10, 35.64) | 1.04 (1.03, 1.05) | 1905.1 (1903.4, 1906.8) |
| NS1 | 71.54 (62.88, 84.03) | 1894.6 (1891.5, 1903.5) | |
| NP | 31.94 (23.58, 43.29) | 0.98 (0.97, 0.99) | 1894.9 (1883.0, 1904.9) |
| PA | 50.36 (42.44, 61.76) | 1888.2 (1872.5, 1898.0) | |
| PB2 | 34.15 (24.70, 50.09) | 0.84 (0.81, 0.88) | 1904.7 (1894.2, 1911.6) |
In addition to reconstructing the virus at the time of the host shift, we also performed an optimal reconstruction of the various substitutions that occurred in the human lineage following the host-shift event. We separated these into changes that occurred in the “trunk” of the tree connecting the host-shift event directly with recent virus sequences, other interior branches, and exterior branches ending at isolates. As shown in figure 5, we found significant differences in the nature of the sequence changes that occur along these different sets of branches; branches along the trunk of the tree are characterized by a much higher likelihood of an increase in human adaptedness compared with other branches in the tree. This was observed for every gene considered separately.
FIG. 5.

Relative fraction of “trunk” branches (red), other interior branches (green), or exterior branches to isolates (blue) that are characterized by a negative, neutral, or positive change in human adaptedness, following the shift from avian-to-human host prior to 1918. Error bars represent standard error based on the number of observations. All genes show a similar distribution.
Discussion
Properties, Limitations, and Approximations of the Model
We previously developed a method for identifying changes in selective constraints acting on influenza virus proteins corresponding to a change in host (Tamuri et al. 2009). In contrast to previous methods that ignore the phylogenetic relationship of the isolates and treat each sequence as an independent observation (Chen et al. 2006; Finkelstein et al. 2007; Miotto et al. 2008) resulting in both lack of sensitivity and exaggerated estimation of statistical significance, we analyzed the nature of the substitutions that occur during the evolutionary process and identified when there is statistical support that these substitution patterns are host dependent. In this way, we were able to both identify locations where selective constraints differ and characterize the nature of these differences.
In particular, rather than calculating the observed frequencies of the amino acids found in different positions, our analysis provides the equilibrium amino acid frequencies, given the estimated substitution rates. Observed frequencies are biased by similarities between evolutionarily related viruses and are time dependent as the viruses adapt to the new host following the host-shift event. In contrast, equilibrium frequencies represent the asymptotic value for an ensemble of adapted viruses at equilibrium with the host selective constraints and can be used to describe those constraints. We have used these equilibrium frequencies to develop a measure of how well any virus protein matches the host-specific selective constraints and can compute the corresponding host adaptedness of the viruses to the two hosts. We can then visualize the process of adaptation to the new host following a host shift and provide insight into what might have occurred both prior to and following the host-shift event.
Our evolutionary model assumes that fitness effects at each location are additive and constant within each host only changing at the host shift. Previous work indicates that these assumptions are not strictly valid. Selective constraints can change as the proteins evolve within a host, especially for the HA during changes in antigenic properties (Blackburne et al. 2008). Adaptation to humans can occur through different sets of substitutions, indicating that the selective constraints at one site are influenced by the amino acids found at other locations. This is clearly seen in HA, where significant differences in structure are reflected in different characteristic substitutions necessary for recognition of receptors on the target human cells (Rogers et al. 1983; Nobusawa et al. 1991; Connor et al. 1994; Vines et al. 1998; Matrosovich et al. 2000). Different substitutions in response to host shifts to human are not confined to these membrane proteins as is clear from considering PB2 627; E627K was experimentally identified as an important substitution necessary for the virus to replicate and spread in mammals (Subbarao et al. 1993; Hatta et al. 2001; Tarendeau et al. 2008; Steel et al. 2009). The pandemic H1N1 2009 virus maintains an glutamic acid at this location, and it appears that a basic amino acid (E) at position 591 compensates for the absence of the basic amino acid at position 627 (Yamada et al. 2010).
Such violations might explain the asymptotic values for the exponential fits to the human adaptedness with isolation time. According to our model, we would expect this asymptotic value to be 1.0, which is the average adaptedness of viruses at equilibrium with the human selective constraints. For four of the proteins, the asymptotic human adaptedness value was not 1.0, suggesting that the selective constraints on the individual locations might be changing either because of changes in the immunity of the host population or because of interaction between the various locations in the protein. Herd immunity dynamics would tend to increase the asymptotic values over 1.0 as there would be a need for the virus to continue to adapt to the new constraints represented by the adapting host immune response. Correspondingly, H1 and N1, the surface glycoproteins most involved in antigenic recognition, have asymptotic values of 1.08 and 1.04, respectively. Conversely, we might expect that there were a number of different ways that a protein could adapt to its host, and adaptation in some locations might lessen the pressure to adapt in others (as in the example of the complementarity of the basic amino acids at positions 591 and 627 of PB2 as mentioned above) in violation of our assumption of additivity. In this case, we would expect asymptotic values less than 1.0 as is observed for PB2 (0.84) and NP (0.98).
The magnitudes of the changes in host adaptedness are different for the different proteins, representing the variety of degrees of difference in selective constraints in the two hosts. Locations that undergo a relaxation in selective constraints during the host shift to humans will have a relatively small change in human adaptedness (avian virus sequences are compatible with the human constraints) but a larger change in avian adaptedness (many human viruses will not be compatible with the avian constraints). The opposite relationship would hold for a tightening of selective constraints. The amount of scatter in host adaptedness values for the various proteins mostly reflects the number of significant sites considered, which range from 27 sites in PA to 84 locations in H1.
Our exponential fit to human adaptedness, extrapolated to the host-shift event, is in rough agreement with the estimate of 1883–1912 obtained through the analysis of nucleotide composition changes (dos Reis et al. 2009). These extrapolated values, however, should be treated with caution as they assume that adaptation to the human host occurred in a similar manner prior to and following 1918. If the intermediate host prior to the 1918 pandemic was swine, it is likely that the rate of adaptation was slower before 1918 and the host shift occurred earlier than indicated by the extrapolations. The extrapolation also assumes that the functional form of the adaptation process is correct and that the changing human adaptedness can be represented by an exponential with a single timescale. It might be conjectured that the adaptation was faster immediately following the host shift, suggesting a more recent event. This can be modeled as a mixture of exponentials with different adaptation times; the locations with the shortest adaptation times would equilibrate fastest, leaving locations with longer adaptation times to equilibrate longer after the host-shift event. To test this possibility, the human adaptedness data were fit to an ensemble of exponentials with a Gaussian distribution of adaptation rates. This more complicated model could not be justified by the data, but this does not indicate that some mixture of substitution rates would not give an improved fit.
It is clear that the mathematical model developed here still leaves much unknown about evolution of influenza and host shifts. Our current model should be considered as a basic framework onto which more complete models can be developed. Particularly, modeling variation in selective constraints along time and within hosts could provide a better understanding of the adaptation process. Our assumption of additiveness can also be relaxed, and models that consider interactions among locations could be developed.
How Typical Was the Host-Shift Virus?
It is not clear why a particular virus undergoes a host-shift event. One possibility is that chance mutations result in a “preadapted” virus particularly fit for the new host prior to the host transfer event. The other possibility is that the virus is not distinctive, and the host transfer of a particular virus is simply a chance occurrence. The answer to this question has important consequences for our ability to characterize the pandemic potential of zoonotic viruses. To distinguish between these two possibilities, we reconstructed the ancestral sequence of the virus that underwent the shift to humans prior to the 1918 pandemic as well as analyzing the 2009 pandemic virus.
We observed that the avian-like pre-1918 host-shift virus, as best shown in figure 3, has human adaptedness values within the distribution of what would be expected for an avian virus, which suggests that the identity of the virus that underwent the host-shift event was a matter of opportunity. In contrast, the pandemic H1N1 2009 virus proteins, with the exception of N1, were more adapted to humans than would be expected, given their origin. The most interesting examples of such preadaptation are in PB2 and PA; in both proteins, there was an initial host shift from birds to swine, presumably around 1998, followed by the host shift to humans in 2009. While circulating in swine, both experienced substitutions identified with increasing human adaptedness (e.g., PB2 A684S and PA K356R) prior to the shift to humans (Tamuri et al. 2009). The resulting increase in human adaptedness for PA is especially large as there are comparatively fewer host-specific locations in this protein compared with PB2. N1 of the 2009 pandemic virus was not as well adapted to humans as N1 from other Eurasian influenza viruses, although it is about as well adapted as a typical avian virus. The relatively lower adaptedness for this particular gene may represent a random fluctuation that is compensated for by the greater adaptedness of the other genes.
Changing Adaptedness in the Phylogenetic Tree
We note that adaptation to the new host has occurred preferentially along the “trunk” of the phylogenetic tree, whereas other branches where the adaptation does not occur as quickly tend to represent evolutionary “dead ends.” This would be expected if such sequence changes increase the fitness of these sequences in the new host relative to those viruses experiencing alternative substitutions. This points to the possibility that measures, such as human adaptedness, can be used to provide insight into why certain lineages persisted and others did not.
Ancestral Reconstruction Methods
Analyses of both the host-shift viruses and the changes along the tree required reconstruction of the evolutionary trajectories. We used marginal reconstruction for the ancestral sequences (Koshi and Goldstein 1996) and joint reconstruction (Pupko et al. 2000) for the historical changes.
The reconstruction of the ancestral sequence relies on an accurate model of the substitution process, which we observe to depend upon the host, especially for the locations under consideration here. The use of host-specific substitution models is especially important for examining the evidence for preadaptation in the host-shift virus as some changes that might reflect the adaptation of the virus to the new host may, with an inappropriate host-independent evolutionary model, appear to be prior to the host shift. We were specifically interested in identifying evidence for preadaptation that cannot be explained by such changes in selective constraints, which required the use of host-dependent models and the exclusion of viruses from other than avian and human hosts. Although it is standard, especially for experimental work, to consider the most likely sequence, we generated an ensemble of sequences by sampling from the posterior probabilities of the reconstruction, allowing us to determine unbiased statistical properties of this ensemble (Williams et al. 2006). For this paper, we recreated an ensemble of sequences representing the virus at the point of host transfer. In this way, we were able to obtain the mean and CIs for the human adaptedness and avian adaptedness at this point.
More accurate ancestral reconstruction could have been achieved by modeling selective constraints in swine. Identification of three sets of selective constraints per location provides computational and statistical challenges. Particularly, with three sets of constraints, alternative models are not nested, and the likelihood ratio test cannot be used. We are currently working on updating our models to included swine, and we are exploring computationally intensive Monte Carlo methods to construct suitable null distributions for hypothesis testing. For this reason, in our joint reconstruction, we used a more standard method with substitution models that did not depend on either host or location.
The History of the 1918 Pandemic
As is clear in figures 2 and 4, significant adaptation to human selective constraints had occurred prior to the 1918 pandemic. This is in seeming contrast to the conclusions made by Taubenberger et al. (2005), who concluded that the 1918 virus sequences more closely resemble avian than human virus sequences. The difference in conclusions between earlier work and this work can be explained by a difference in focus; previous work considered all the amino acid changes that had occurred in the virus proteins, whereas our methods allow us to focus on locations involved in host adaptation.
The degree of human adaptation prior to the 1918 pandemic can be explained in three ways: (a) The virus had “preadapted” to humans in its avian host, presumably as a result of stochastic fluctuations, perhaps explaining why that particular virus was able to establish itself so readily in humans; (b) the virus had evolved in humans for a period of time prior to 1918; or (c) the virus had evolved in a nonhuman nonavian host that exerted similar selective pressure on the virus as exerted by a human host. (a) seems unlikely as the human adaptedness values of the 1918 virus are well outside the range of observed avian viruses. In addition, our reconstruction of the sequence of the virus at the host-shift event shows that the host-shift proteins were avian like in their human adaptedness, suggesting that there was little evidence of preadaptation. Although we cannot rule out the possibility that the 1918 pandemic virus evolved in humans for a significant period of time prior to the subsequent pandemic, the similarity of avian and porcine cell receptors, the observed successful avian-to-swine host shift in 1979 compared with the lack of precedent for a successful avian-to-human shift, and the difficulty in the virus existing undetected for so long in the human population argue for swine as an intermediate host (Scholtissek 2008; dos Reis et al. 2009; Smith, Bahl, et al. 2009).
Adaptation to humans during virus evolution in swine is possible if there are similarities in the selective constraints imposed on viruses in these two species. In fact, human adaptedness values for H1, NP, PA, and PB2 are higher in the classical swine lineage than in avian isolates. The increasing human adaptedness of the Eurasian swine H1 after the initial host shift in 1979 is clear in figure 4. If the evolution of the human virus prior to 1918 occurred mostly in swine, we would expect the human adaptedness values for the 1918 human virus to resemble the human adaptedness values of classical swine. This is true for most proteins, although the 1918 virus N1 and NP proteins have significantly higher human adaptedness than is observed in later classical swine viruses. Resolution of this issue will require greater availability of early influenza viruses or more sophisticated evolutionary models. We also note that the 2009 virus seems to have preadapted to humans during its circulation in swine. This again highlights the ability of swine to preadapt viruses to human hosts, suggesting a potentially similar role for swine in facilitating the 1918 and 2009 human pandemics.
The results described above seem to suggest that, although the virus that underwent the first host-shift event from birds to mammals before the 1918 pandemic seems unexceptional, the virus had substantially adapted to humans prior to the subsequent pandemic. Similarly, we can detect substantial adaptation to humans in five of the virus genes in the triple reassortant prior to the 2009 pandemic. Although the causes of a pandemic are complex, involving a mixture of virus properties, host susceptibilities, and historical contingencies, these results indicate that the degree of human adaptation of the virus plays an important role in host shifts to humans.
Supplementary Material
Supplementary material is available at Molecular Biology and Evolution online (http://www.mbe.oxfordjournals.org/).
Acknowledgments
We would like to thank John McCauley for helpful discussions. This work was supported by the National Institute for Medical Research (Medical Research Council, UK), the Wellcome Trust, and the European Union FP6 FLUPOL contract (grant number SPSB-CT-2007-044263).
Appendix. Example of Adaptedness Calculation
Consider an aligned set of protein sequences of length 2 where two different residues, A and B, are observed. Imagine our analysis indicates that A is strongly favored in humans in both sites (πAHuman = 0.7 and πBHuman = 0.3). Over the entire viral genome, both residue types are found equally often (πA0 = πB0 = 0.5). Ignoring the effect of N (which drops out at the end of the calculation), we can express the raw “fitness” of sequences AA, AB, BA, and BB as the sum of logs of the equilibrium frequencies:
 |
(A1) |
An ensemble of random sequences, where each possible sequence is equally likely, would have an average θHuman of 〈θHuman〉Random = 0.25×( − 0.71) + 0.5×( − 1.56) + 0.25×( − 2.41) = − 1.56. In an ensemble of fully adapted sequences, where the proportion of As and Bs at each location matches the equilibrium frequencies, we would expect to find 49% AA, 21% AB, 21% BA, and 9% BB. Such an ensemble would have an average θHuman of 〈θHuman〉Adapted = 0.49×( − 0.71) + 0.42×( − 1.56) + 0.09×( − 2.41) = − 1.22. We scale the human adaptedness values by subtracting the average value of the random ensemble and dividing by the difference between the average of the adapted and random ensembles to yield
 |
(A2) |
As desired, our random ensemble of sequences (with equal mixtures of AA, AB, BA, and BB) would have an average human adaptedness value of 0, whereas our adapted ensemble would have an average human adaptedness value of 0.49×2.5 + 0.42×0 + 0.09×( − 2.5) = 1.
In this case, BB has an adaptedness value less than 0, whereas AA has an adaptedness value greater than 1. This is because BB is less adapted than the average of a random ensemble, 75% of which have at least one more favored A; conversely, AA is better adapted than the average of an ensemble of adapted proteins, 51% of which have at least one less favored B.
As we sum over an increasingly large number of locations with a similar degree of selective constraints, both random and adapted proteins would have more representative mixtures of more favorable and less favorable residues. As a result, random sequences would have adaptedness values approximately normally distributed around 0, whereas adapted proteins would have adaptedness values approximately normally distributed around 1. For example, imagine we had N identical independent locations such as the one described above, with a favorable residue A (equilibrium frequency in humans πAHuman) and less favorable residue B (equilibrium frequency in humans πBHuman = 1 − πAHuman). Imagine that over the entire genome, both residues are equally represented (πA0 = πB0 = 0.5). In this case, the human adaptedness is equal to
| (A3) |
| Gene | P Value for Rejecting a |
| H1 | <10−16 |
| N1 | <10−16 |
| NS1 | 0.228 |
| NP | 0.044 |
| PA | 0.814 |
| PB2 | 2.27 × 10⁻⁴ |
where nA is the fraction of residues in the sequence that are A. In this simple model, the distribution of nA in random sequences would follow a binomial distribution with  , resulting in a distribution of human adaptedness values with mean 0 and standard deviation
  . Conversely, the distribution of nA for adapted sequences would follow a binomial distribution with
  , resulting in a distribution of human adaptedness values with mean 1 and SD
  .
.
Fits to Adaptedness Data
As described in the text, we fit the host adaptedness of human viral sequences as a function of isolation date H(t) to two possible functional forms:
| (A4) |
Assuming that the errors are normally distributed with variance δ2, the likelihood function Λ for the fit can be represented as
 |
(A5) |
where  . This function is a maximum when
  , where
| (A6) |
We then used the likelihood ratio test (1 degree of freedom, P < 0.05) to test whether model (a) can be rejected in favor of (b). Computed P values were
References
- Antonovics J, Hood ME, Baker CH. Molecular virology: was the 1918 flu avian in origin? Nature. 2006;440:E9. doi: 10.1038/nature04824. Discussion: E9–E10. [DOI] [PubMed] [Google Scholar]
- Bao YM, Bolotov P, Dernovoy D, Kiryutin B, Zaslavsky L, Tatusova T, Ostell J, Lipman D. The influenza virus resource at the national center for biotechnology information. J Virol. 2008;82:596–601. doi: 10.1128/JVI.02005-07. [DOI] [PMC free article] [PubMed] [Google Scholar]
- Benjamini Y, Hochberg T. Controlling the false discovery rate: a practical and powerful approach to multiple testing. J Royal Stat Soc B. 1995;85:289–300. [Google Scholar]
- Blackburne BP, Hay AJ, Goldstein RA. Changing selective pressure during antigenic changes in human influenza H3. PLoS Pathog. 2008;4:e1000058. doi: 10.1371/journal.ppat.1000058. [DOI] [PMC free article] [PubMed] [Google Scholar]
- Centers for Disease Control and Prevention. Swine influenza A (H1N1) infection in two children—Southern California, March–April 2009. MMWR Morb Mortal Wkly Rep. 2009;58:400–402. [PubMed] [Google Scholar]
- Chen GW, Chang SC, Mok CK, Lo YL, Kung YN. Genomic signatures of human versus avian influenza A viruses. Emerg Infect Dis. 2006;12:1353–1360. doi: 10.3201/eid1209.060276. [DOI] [PMC free article] [PubMed] [Google Scholar]
- Connor RJ, Kawaoka Y, Webster RG, Paulson JC. Receptor specificity in human, avian, and equine H2 and H3 influenza-virus isolates. Virology. 1994;205:17–23. doi: 10.1006/viro.1994.1615. [DOI] [PubMed] [Google Scholar]
- Dawood FS, Jain S, Finelli L, Shaw MW, Lindstrom SE, Garten RJ, Gubareva L, Xu X, Bridges CB, Uyeki TM. Emergence of a novel swine-origin influenza A (H1N1) virus in humans. N Engl J Med. 2009;361:10. doi: 10.1056/NEJMoa0903810. [DOI] [PubMed] [Google Scholar]
- dos Reis M, Hay AJ, Goldstein RA. Using non-homogeneous models of nucleotide substitution to identify host shift events: application to the origin of the 1918 `Spanish' influenza pandemic virus. J Mol Evol. 2009;69:333–345. doi: 10.1007/s00239-009-9282-x. [DOI] [PMC free article] [PubMed] [Google Scholar]
- Edgar RC. MUSCLE: multiple sequence alignment with high accuracy and high throughput. Nucleic Acids Res. 2004;32:1792–1797. doi: 10.1093/nar/gkh340. [DOI] [PMC free article] [PubMed] [Google Scholar]
- Finkelstein D, Mukatira S, Mehta P, Obenauer J, Su X, Webster R, Naeve C. Persistent host markers in pandemic and H5N1 influenza viruses. J Virol. 2007;81:10292–10299. doi: 10.1128/JVI.00921-07. [DOI] [PMC free article] [PubMed] [Google Scholar]
- Forsberg R, Christiansen FB. A codon-based model of host-specific selection in parasites, with an application to the influenza A virus. Mol Biol Evol. 2003;20:1252–1259. doi: 10.1093/molbev/msg149. [DOI] [PubMed] [Google Scholar]
- Fraser C, Donnelly CA, Cauchemez S, et al. (28 co-authors) Pandemic potential of a strain of influenza A (H1N1): early findings. Science. 2009;324:1557–1561. doi: 10.1126/science.1176062. [DOI] [PMC free article] [PubMed] [Google Scholar]
- Gibbs M, Gibbs A. Molecular virology: was the 1918 pandemic caused by a bird flu? Nature. 2006;440:E8. doi: 10.1038/nature04823. [DOI] [PubMed] [Google Scholar]
- Guindon S, Gascuel O. A simple, fast, and accurate algorithm to estimate large phylogenies by maximum likelihood. Syst Biol. 2003;52:696–704. doi: 10.1080/10635150390235520. [DOI] [PubMed] [Google Scholar]
- Hasegawa M, Kishino H, Yano TA. Dating of the human ape splitting by a molecular clock of mitochondrial-DNA. J Mol Evol. 1985;22:160–174. doi: 10.1007/BF02101694. [DOI] [PubMed] [Google Scholar]
- Hatta M, Gao P, Halfmann P, Kawaoka Y. Molecular basis for high virulence of Hong Kong H5N1 influenza A viruses. Science. 2001;293:1840–1842. doi: 10.1126/science.1062882. [DOI] [PubMed] [Google Scholar]
- Johnson NPAS, Mueller J. Updating the accounts: global mortality of the 1918–1920 “Spanish” influenza pandemic. Bull Hist Med. 2002;76:105–115. doi: 10.1353/bhm.2002.0022. [DOI] [PubMed] [Google Scholar]
- Kawaoka Y, Krauss S, Webster RG. Avian-to-human transmission of the Pb1 gene of influenza-a viruses in the 1957 and 1968 pandemics. J Virol. 1989;63:4603–4608. doi: 10.1128/jvi.63.11.4603-4608.1989. [DOI] [PMC free article] [PubMed] [Google Scholar]
- Koshi JM, Goldstein RA. Probabilistic reconstruction of ancestral protein sequences. J Mol Evol. 1996;42:313–320. doi: 10.1007/BF02198858. [DOI] [PubMed] [Google Scholar]
- Matrosovich M, Tuzikov A, Bovin N, Gambaryan A, Klimov A, Castrucci MR, Donatelli I, Kawaoka Y. Early alterations of the receptor-binding properties of H1, H2, and H3 avian influenza virus hemagglutinins after their introduction into mammals. J Virol. 2000;74:8502–8512. doi: 10.1128/jvi.74.18.8502-8512.2000. [DOI] [PMC free article] [PubMed] [Google Scholar]
- Miotto O, Heiny A, Tan T, August J, Brusic V. Identification of human-to-human transmissibility factors in PB2 proteins of influenza A by large-scale mutual information analysis. BMC Bioinformatics. 2008;9:S18. doi: 10.1186/1471-2105-9-S1-S18. [DOI] [PMC free article] [PubMed] [Google Scholar]
- Naffakh N, Tomoiu A, Rameix-Welti MA, van der Werf S. Host restriction of avian influenza viruses at the level of the ribonucleoproteins. Annu Rev Microbiol. 2008;62:403–424. doi: 10.1146/annurev.micro.62.081307.162746. [DOI] [PubMed] [Google Scholar]
- Nakajima K, Desselberger U, Palese P. Recent human influenza-a (H1n1) viruses are closely related genetically to strains isolated in 1950. Nature. 1978;274:334–339. doi: 10.1038/274334a0. [DOI] [PubMed] [Google Scholar]
- Nobusawa E, Aoyama T, Kato H, Suzuki Y, Tateno Y, Nakajima K. Comparison of complete amino-acid-sequences and receptor-binding properties among 13 serotypes of hemagglutinins of influenza a-viruses. Virology. 1991;182:475–485. doi: 10.1016/0042-6822(91)90588-3. [DOI] [PubMed] [Google Scholar]
- Palese P. Influenza: old and new threats. Nat Med. 2004;10:S82–S87. doi: 10.1038/nm1141. [DOI] [PubMed] [Google Scholar]
- Pensaert M, Ottis K, Vandeputte J, Kaplan MM, Bachmann PA. Evidence for the natural transmission of influenza-a virus from wild ducks to swine and its potential importance for man. Bull World Health Organ. 1981;59:75–78. [PMC free article] [PubMed] [Google Scholar]
- Pupko T, Pe'er I, Shamir R, Graur D. A fast algorithm for joint reconstruction of ancestral amino acid sequences. Mol Biol Evol. 2000;17:890–896. doi: 10.1093/oxfordjournals.molbev.a026369. [DOI] [PubMed] [Google Scholar]
- Reid AH, Taubenberger JK, Fanning TG. Evidence of an absence: the genetic origins of the 1918 pandemic influenza virus. Nat Rev Microbiol. 2004;2:909–914. doi: 10.1038/nrmicro1027. [DOI] [PMC free article] [PubMed] [Google Scholar]
- Rogers GN, Paulson JC, Daniels RS, Skehel JJ, Wilson IA, Wiley DC. Single amino-acid substitutions in influenza hemagglutinin change receptor-binding specificity. Nature. 1983;304:76–78. doi: 10.1038/304076a0. [DOI] [PubMed] [Google Scholar]
- Ruigrok RWH, Crepin T, Hart DJ, Cusack S. Towards an atomic resolution understanding of the influenza virus replication machinery. Curr Opin Struct Biol. 2010;20:104–113. doi: 10.1016/j.sbi.2009.12.007. [DOI] [PubMed] [Google Scholar]
- Schafer JR, Kawaoka Y, Bean WJ, Suss J, Senne D, Webster RG. Origin of the pandemic 1957 H2 influenza-a virus and the persistence of its possible progenitors in the avian reservoir. Virology. 1993;194:781–788. doi: 10.1006/viro.1993.1319. [DOI] [PubMed] [Google Scholar]
- Scholtissek C. History of research on avian influenza. In: Klenk H-D, Matrosovic MN, Stech J, editors. Avian influenza. Basel (Switzerland): Karger; 2008. pp. 101–117. [Google Scholar]
- Smith GJD, Bahl J, Vijaykrishna D, Zhang JZ, Poon LLM, Chen H, Webster RG, Peiris JSM, Guan Y. Dating the emergence of pandemic influenza viruses. Proc Natl Acad Sci U S A. 2009;106:11709–11712. doi: 10.1073/pnas.0904991106. [DOI] [PMC free article] [PubMed] [Google Scholar]
- Smith GJD, Vijaykrishna D, Bahl J, et al. (13 co-authors) Origins and evolutionary genomics of the 2009 swine-origin H1N1 influenza A epidemic. Nature. 2009;459:1122–1125. doi: 10.1038/nature08182. [DOI] [PubMed] [Google Scholar]
- Steel J, Lowen A, Mubareka S, Palese P, Baric R. Transmission of influenza virus in a mammalian host is increased by pb2 amino acids 627K or 627E/701N. PLoS Pathog. 2009;5:e1000252. doi: 10.1371/journal.ppat.1000252. [DOI] [PMC free article] [PubMed] [Google Scholar]
- Subbarao EK, London W, Murphy BR. A single amino-acid in the Pb2-gene of influenza-a virus is a determinant of host range. J Virol. 1993;67:1761–1764. doi: 10.1128/jvi.67.4.1761-1764.1993. [DOI] [PMC free article] [PubMed] [Google Scholar]
- Suyama M, Torrents D, Bork P. PAL2NAL: robust conversion of protein sequence alignments into the corresponding codon alignments. Nucleic Acids Res. 2006;34:W609–W612. doi: 10.1093/nar/gkl315. [DOI] [PMC free article] [PubMed] [Google Scholar]
- Tamuri AU, dos Reis M, Hay AJ, Goldstein RA. Identifying changes in selective constraints: host shifts in influenza. Plos Comput Biol. 2009;5:e1000564. doi: 10.1371/journal.pcbi.1000564. [DOI] [PMC free article] [PubMed] [Google Scholar]
- Tarendeau F, Crepin T, Guilligay D, Ruigrok RW, Cusack S, Hart DJ. Host determinant residue lysine 627 lies on the surface of a discrete, folded domain of influenza virus polymerase PB2 subunit. PLoS Pathog. 2008;4:e1000136. doi: 10.1371/journal.ppat.1000136. [DOI] [PMC free article] [PubMed] [Google Scholar]
- Taubenberger JK. The origin and virulence of the 1918 “Spanish” influenza virus. Proc Am Philos Soc. 2006;150:86–112. [PMC free article] [PubMed] [Google Scholar]
- Taubenberger JK, Morens DM. 1918 influenza: the mother of all pandemics. Emerg Infect Dis. 2006;12:15–22. doi: 10.3201/eid1201.050979. [DOI] [PMC free article] [PubMed] [Google Scholar]
- Taubenberger JK, Reid AH, Lourens RM, Wang R, Jin G, Fanning TG. Characterization of the 1918 influenza virus polymerase genes. Nature. 2005;437:889–893. doi: 10.1038/nature04230. [DOI] [PubMed] [Google Scholar]
- Vines A, Wells K, Matrosovich M, Castrucci MR, Ito T, Kawaoka Y. The role of influenza a virus hemagglutinin residues 226 and 228 in receptor specificity and host range restriction. J Virol. 1998;72:7626–7631. doi: 10.1128/jvi.72.9.7626-7631.1998. [DOI] [PMC free article] [PubMed] [Google Scholar]
- Webster RG, Bean WJ, Gorman OT, Chambers TM, Kawaoka Y. Evolution and ecology of influenza A viruses. Microbiol Rev. 1992;56:152–179. doi: 10.1128/mr.56.1.152-179.1992. [DOI] [PMC free article] [PubMed] [Google Scholar]
- Whelan S, Goldman N. A general empirical model of protein evolution derived from multiple protein families using a maximum-likelihood approach. Mol Biol Evol. 2001;18:691–699. doi: 10.1093/oxfordjournals.molbev.a003851. [DOI] [PubMed] [Google Scholar]
- Williams PD, Pollock DD, Blackburne BP, Goldstein RA. Assessing the accuracy of ancestral protein reconstruction methods. Plos Comput Biol. 2006;2:e69. doi: 10.1371/journal.pcbi.0020069. [DOI] [PMC free article] [PubMed] [Google Scholar]
- Yamada S, Hatta M, Staker BL, et al. (26 co-authors) Biological and structural characterization of a host-adapting amino acid in influenza virus. PLoS Pathog. 2010;6:e1001034. doi: 10.1371/journal.ppat.1001034. [DOI] [PMC free article] [PubMed] [Google Scholar]
- Yang Z. PAML: a program package for phylogenetic analysis by maximum likelihood. Comput Appl Biosci. 1997;13:555–556. doi: 10.1093/bioinformatics/13.5.555. [DOI] [PubMed] [Google Scholar]
- Yang Z. PAML 4: phylogenetic analysis by maximum likelihood. Mol Biol Evol. 2007;24:1586–1591. doi: 10.1093/molbev/msm088. [DOI] [PubMed] [Google Scholar]
- Yang ZH, Nielsen R. Mutation-selection models of codon substitution and their use to estimate selective strengths on codon usage. Mol Biol Evol. 2008;25:568–579. doi: 10.1093/molbev/msm284. [DOI] [PubMed] [Google Scholar]
- Zhou NN, Senne DA, Landgraf JS, et al. Genetic reassortment of avian, swine, and human influenza A viruses in American pigs. J Virol. 1999;73:8851–8856. doi: 10.1128/jvi.73.10.8851-8856.1999. [DOI] [PMC free article] [PubMed] [Google Scholar]
Associated Data
This section collects any data citations, data availability statements, or supplementary materials included in this article.