

Abstract
We have screened the Library of Pharmacologically Active Compounds (LOPAC) and the National Institutes of Health (NIH) Small Molecule Repository (SMR) libraries in a horseradish peroxidase–phenol red (HRP-PR) H2O2 detection assay to identify redox cycling compounds (RCCs) capable of generating H2O2 in buffers containing dithiothreitol (DTT). Two RCCs were identified in the LOPAC set, the ortho-naphthoquinone β-lapachone and the para-naphthoquinone NSC 95397. Thirty-seven (0.02%) concentration-dependent RCCs were identified from 195,826 compounds in the NIH SMR library; 3 singleton structures, 9 ortho-quinones, 2 para-quinones, 4 pyrimidotriazinediones, 15 arylsulfonamides, 2 nitrothiophene-2-carboxylates, and 2 tolyl hydrazides. Sixty percent of the ortho-quinones and 80% of the pyrimidotriazinediones in the library were confirmed as RCCs. In contrast, only 3.9% of the para-quinones were confirmed as RCCs. Fifteen of the 251 arylsulfonamides in the library were confirmed as RCCs, and since we screened 17,868 compounds with a sulfonamide functional group we conclude that the redox cycling activity of the arylsulfonamide RCCs is due to peripheral reactive enone, aromatic, or heterocyclic functions. Cross-target queries of the University of Pittsburgh Drug Discovery Institute (UPDDI) and PubChem databases revealed that the RCCs exhibited promiscuous bioactivity profiles and have populated both screening databases with significantly higher numbers of active flags than non-RCCs. RCCs were promiscuously active against protein targets known to be susceptible to oxidation, but were also active in cell growth inhibition assays, and against other targets thought to be insensitive to oxidation. Profiling compound libraries or the hits from screening campaigns in the HRP-PR H2O2 detection assay significantly reduce the timelines and resources required to identify and eliminate promiscuous nuisance RCCs from the candidates for lead optimization.
INTRODUCTION
Aqueous solutions containing dithiothreitol (DTT) and oxygen or other oxidizers at neutral to acid pH generate hydrogen peroxide (H2O2) via a chain reaction, and if compounds capable of redox cycling are added to this environment, micromolar (μM) concentrations of H2O2 can be produced.1–7 H2O2 generated via redox cycling reactions can oxidize the accessible cysteine, tryptophan, methionine, or selenocysteine residues of proteins, producing a loss of catalytic activity, adverse effects on cofactor binding, or the disruption of disulfide bonds that contribute to the dimerization and/or folding of proteins.1–4,6,7 Several important classes of protein targets are susceptible to H2O2-mediated inactivation, including protein tyrosine phosphatases (PTPs), cysteine proteases (cathepsins and caspases), and metalloenzymes.1–4,6–14 Redox cycling compounds (RCCs) generate H2O2 in the presence of strong reducing agents such as DTT and tris(2-carboxyethyl)phosphine (TCEP), but not in the presence of weaker reducing agents like β-mercaptoethanol (BME), glutathione (GSH), or cysteine (Cys).1,3,7 However, DTT and TCEP are commonly utilized in high-throughput screening (HTS) buffers to preserve the reduced state of critical amino acids and to maintain the catalytic activity or the folding of target proteins.1–3,6,7,15,16 Compounds capable of redox cycling in buffers containing DTT or TCEP generate reactive oxygen species (ROS) including H2O2 that may indirectly inhibit the target activity of proteins that are susceptible to oxidation.1–4,6,7
A small molecule library of between 200,000 and 300,000 compounds has been assembled under the auspices of the National Institutes of Health (NIH) Roadmap Initiative, for distribution to the academic screening laboratories involved in the pilot and probe production phases of the Molecular Library Screening Centers Network (MLSCN and MLPCN).15,17–21 The NIH Small Molecule Repository (SMR) library contains chemically diverse substances that are being acquired from multiple sources: (1) a specialty set of FDA approved drugs, known bioactives, toxins, and metabolites; (2) natural products and derivatives; (3) targeted libraries of modulators for specific target protein classes including proteases, kinases, G-protein coupled receptors, ion channels, and nuclear hormone receptor families; and (4) compounds with chemically diverse scaffolds that include assorted small molecule libraries from commercial and academic sources.15,17–21 The NIH SMR distributes copies of this library to the centers of the network for screening against selected peer-reviewed assays that have been submitted by investigators throughout the broader scientific community.15,20–23 The screening centers develop, optimize, and adapt the assays for HTS, screen the NIH SMR library to identify actives, perform counter screens and secondary assay to confirm hits, and conduct limited analog synthesis efforts to confirm chemical structures, generate analogs with improved physiochemical properties, such as water solubility, and to explore the structure activity relationships of the probe compounds identified.15,20,21,23,24 Detailed assay descriptions, protocols, and data analysis procedures are uploaded together with the data to the PubChem database and are thus in the public domain.15,17–24 The presence of RCCs in any library that is to be screened in buffers containing DTT or TCEP against protein targets that are susceptible to oxidation has serious negative consequences for the probe and/or lead generation process: primary HTS campaigns may exhibit high hit rates that includes false positives due to RCCs; critical resources will be diverted to develop and implement follow-up assays to identify and eliminate RCCs from the hits; and screening databases like PubChem will become populated with the promiscuous activity of RCCs.1–4,6,7
Typically, the follow-up process to identify and eliminate RCCs from HTS hit lists requires the development and implementation of several secondary assays that significantly lengthen the timelines for hit characterization and lead selection while consuming critical resources: (i) conducting a detailed enzyme kinetic analysis to verify the time- and concentration-dependent inhibition of target activity by redox active compounds in the presence of DTT, (ii) testing whether catalase abolishes the target inhibition by compounds in DTT, (iii) examining compound inhibition in the presence of weaker reducing agents such as GSH or Cys, (iv) measuring the UV/Vis spectra of the compound in the presence and absence of the reducing agent to determine if it is reduced in a time-dependent manner, and (v) liquid chromatography and mass spectrometry analysis to confirm the oxidation of active site cysteines.1–3,6,7 Recently, we have reported the development and optimization of a rapid, economical, 384-well colorimetric HTS compatible assay to measure H2O2 generated by the redox cycling of compounds incubated with reducing agents.3 The assay readily detects H2O2 in the 1–100 μM range and is based on the H2O2-dependent horseradish peroxidase (HRP)-mediated oxidation of phenol red (PR) that produces a change in its absorbance at 610 nm in alkaline pH.3,25 The redox cycling generation of H2O2 depends upon the concentrations of both the RCC and reducing agent, and is abolished by catalase. Whereas both DTT and TCEP supported the generation of H2O2 by RCCs, weaker reducing agents such as BME, GSH, and Cys did not.3 The Pittsburgh Molecular Library Screening Center (PMLSC) has utilized the HRP-PR assay to identify RCCs among the confirmed hits from several of our MLSCN screening campaigns; PubChem assay identifiers (AIDs) 672, 682, 683, 876, and 936. Herein, we report for the first time on the application of the HRP-PR assay to profile the 1,280 compound Library of Pharmacologically Active Compounds (LOPAC) and 195,826 compounds from the NIH’s SMR library to identify RCCs (AIDs 878 and 1234). Additionally, we computationally interrogate the RCC bioassay activity profiles within the University of Pittsburgh Drug Discovery Institute (UPDDI) and PubChem databases.
EXPERIMENTAL DETAILS
Reagents and Supplies
H2O2 solution (30%, w/w) (catalog # H1009-100ML), phenol red (PR) (catalog # 114537-25G), and peroxidase type VI from horseradish (HRP) (catalog # P8375-250KU) were purchased from Sigma-Aldrich (St. Louis, MO); Hank’s balanced salt solution (HBSS, catalog # SH30268.02) was from Hyclone (Logan, UT); sodium hydroxide (catalog # VW6720-1) was from VWR (West Chester, PA); and dimethyl sulfoxide (DMSO, 99.9% HPLC grade under argon, CAS # 67-68-5) was from Alfa Aesar (Ward Hill, MA). All other materials were reagent grade from Sigma-Aldrich.
Compound Libraries
The 1,280 compound LOPAC library was purchased from Sigma-Aldrich. The 195,826 compounds and cherry-picked actives from the primary HRP-PR HTS assay were supplied to the PMLSC by the NIH SMR (Biofocus-DPI, a Galapagos company, San Francisco, CA) as part of the MLSCN pilot phase. Both the LOPAC and NIH libraries were supplied at 10 mM concentration in DMSO arrayed into 384-well microtiter master plates. NIH compounds were identified by their PubChem substance identity numbers (SIDs) and LOPAC compounds were identified by unique PMLSC substance identity numbers. Daughter plates containing 2 μL of 1 mM compounds in DMSO were prepared and replicated from the MLSCN or LOPAC master plates using the Vprep (Velocity11, Menlo Park, CA) outfitted with a 384-well transfer head. Aluminum adhesive plate seals were applied with an Abgene Seal-IT 100 (Rochester, NY) plate sealer and plates were stored at −20°C in a Matrical MatriMinistore™ (Spokane, WA) automated compound storage and retrieval system. For the primary screen, immediately prior to use daughter plates were withdrawn from −20°C storage, thawed at ambient temperature, centrifuged for 1–2 min at 50×g, and the plate seals were removed prior to the transfer of 64.7 μL of HBSS into wells using the FlexDrop liquid handler (Perkin Elmer, Waltham, MA) to generate a 30 μM intermediate stock concentration of library compounds (in 3% DMSO). The diluted compounds were mixed by repeated aspiration and dispensation using a 384-well P30 dispensing head on the Evolution-P3 (EP3) liquid handling platform (Perkin Elmer) and then 20 μL of diluted compounds were transferred to the wells of assay plates. In the primary screen, compounds were individually screened at a final concentration of 10 μM. For the determination of the 50% activation concentrations (AC50), 10-point 2-fold serial dilutions of test compounds in HBSS-DMSO were performed using a 384-well P30 dispensing head on the EP3 liquid handling platform. The diluted compounds were mixed by repeated aspiration and dispensation using a 384-well P30 dispensing head on the EP3 and then 20 μL of diluted compounds were transferred to the wells of assay plates to provide a final concentration response ranging from 0.195 to 50 μM.
384-Well H2O2 HTS Assay
The 384-well detection assay to measure H2O2 exogenously added to wells or generated by RCCs incubated in reducing agents has been described previously.3 The assay is performed in 384-well flat-bottomed clear polystyrene barcoded microtiter plates (Greiner Bio One, Catalog # 781101). Compounds and plate controls (100 μM H2O2 or 1 % DMSO final in the well) are diluted to the required concentrations in HBSS. DTT is diluted in HBSS from 200 mM stocks stored at −20°C to the required concentrations (typically a final concentration of 0.8 mM in the well). The HRP-PR detection reagent contains 300 μg/mL phenol red and 180 μg/mL HRP in HBSS. The assay involves 3 liquid transfer steps into the 384-well plate; 20 μL each of compounds/controls, DTT, and the HRP-PR detection reagent to give a final assay volume of 60 μL. Diluted compound and control additions (20 μL) were performed on an EP3 using a 384-well P30 dispensing head. DTT solution (20 μL) was added to the compound-containing wells using the FlexDrop liquid handler. Compounds and DTT are incubated together at ambient temperature for a minimum of 15 min prior to the addition of the HRP-PR detection reagent (100 μg/mL phenol red and 60 μg/mL HRP final in the well). The HRP-PR detection reagent (20 μL) was added to all wells using the FlexDrop liquid handler. After an additional incubation period at ambient temperature, minimally 5 min, the assay is terminated by the addition of 10 μL of 1 N NaOH to all wells using the FlexDrop liquid handler. The plates were mixed for 5 min on a shaker platform (Heidolph Titramax 1000) and the absorbance of the phenol red was measured at 610 nm on a M5 microtiter plate reader (Molecular Devices, Sunnyvale, CA).
HTS Data Analysis, Visualization, Statistical Analysis, and Curve Fitting
Data analysis for the primary HTS assay and IC50 determinations were performed using ActivityBase™ (IDBS, Guildford, UK), CytoMiner (University of Pittsburgh Drug Discovery Institute), and Spotfire Decision site (Somerville, MA) software. An ActivityBase primary HTS template was created that automatically calculated % activation together with plate control signal-to-background (S:B) and Z′-factors. The PMLSC also constructed an ActivityBase concentration–response template to calculate percent inhibition together with plate control signal to noise and Z′-factors for quality control purposes. AC50 values were calculated using an XLfit 4-parameter logistic model, also called the sigmoidal dose–response model: y = (A + ((B − A)/(1 + ((C/x)ˆD)))), where y was the percent activation and x was the corresponding compound concentration. The fitted C parameter was the AC50 and defined as the concentration giving a response half way between the fitted top (B) and bottom (A) of the curve. The A and B parameters were locked as 0 and 100, respectively.
We also used GraphPad Prism 5 software to plot and fit data to curves using the following equations: polynomial fourth order (Y = A + B*X + C*Xˆ2 + D*Xˆ3 + E*Xˆ4); sigmoidal dose–response equation Y = bottom + [top-bottom]/[1 + 10ˆ(LogEC50-X)]; and sigmoidal dose–response variable slope equation Y = Bottom + [top-bottom]/[1 + 10ˆ(LogEC50-X)*HillSlope].
Compound Structure Classification, Clustering Analysis, and Similarity Searching
The chemical structures of confirmed compounds with AC50 values <50 μM were classified and subjected to cluster analysis using Leadscope Enterprise Predictive software version 2.4.14-5 (Columbus, OH) as described previously.15,20,21,23 The Leadscope Enterprise Predictive software was also used to perform a similarity search of the compounds screened in the primary assay for compounds that exhibited ≥40% structural similarity to the compound members of the 6 clusters of confirmed RCCs: 9 ortho-quinones, 2 para-quinones, 4 pyrimidotriazinediones, 15 arylsulfonamides, 2 nitrothiophene-2-carboxylates, and 2 tolyl hydrazides. The structures returned by the similarity search were then manually inspected and either validated or excluded.
PubChem Cross-Target Query Data Mining
Confirmed compounds with AC50 values <50 μM were subjected to a cross-target query through the NIH PubChem database (http://pubchem.ncbi.nim.nih.gov) to identify promiscuously active compounds that have been reported in primary and confirmatory assays involving a variety of unrelated target proteins.
RESULTS
The PMLSC routinely employs the 1,280 compound LOPAC set to validate the performance of HTS assays by conducting 2 independent screening tests at the proposed screening compound concentration. The 4 × 384-well daughter plates of the LOPAC set were screened at 10 μM in the presence of 0.8 mM DTT and a scatter plot overlay of the % activation data from the 4 plates in the first of the 2 independent tests is presented (Fig. 1A). The 384-well HRP-PR H2O2 detection assay performed well in HTS with the maximum (100 μM H2O2 + 1.0% DMSO, n = 32) and minimum (1.0% DMSO, n = 24) plate controls providing a robust and reproducible assay signal window (Fig. 1A). The HRP-PR H2O2 detection assay plate controls exhibited average Z′-factors of 0.91 ± 0.01 and 0.80 ± 0.11 and average signal-to-background ratios of 6.03 ± 0.15 and 6.15 ± 0.06 for the 2 independent LOPAC screening tests, respectively. Only 2 compounds (0.16%) generated H2O2 in the presence of 0.8 mM DTT that was consistently above background levels in both screens; 2,3-bis(2-hydroxyethylthio)naphthalene-1,4-dione (NSC 95397, PubChem-SID 400206) and 2,2-dimethyl-3,4-dihydro-2H-benzo[h]chromene-5,6-dione (β-lapachone, PubChem-SID 207115) (Fig. 1B). β-Lapachone and NSC 95397 are ortho- and para-naphthoquinone structures, respectively (Fig. 1B), similar in structure to compounds that have previously been shown to generate H2O2 by redox cycling in the presence of DTT.1,2,4 The incubation of 10 μM of NSC 95397 with 0.8 mM DTT on average produced H2O2 levels that were 24% higher than the 100 μM H2O2 plate control signal, while the incubation of β-lapachone at 10 μM with 0.8 mM DTT produced H2O2 levels that were on average 10.5% above the background DMSO plate control signal.
Fig. 1. .
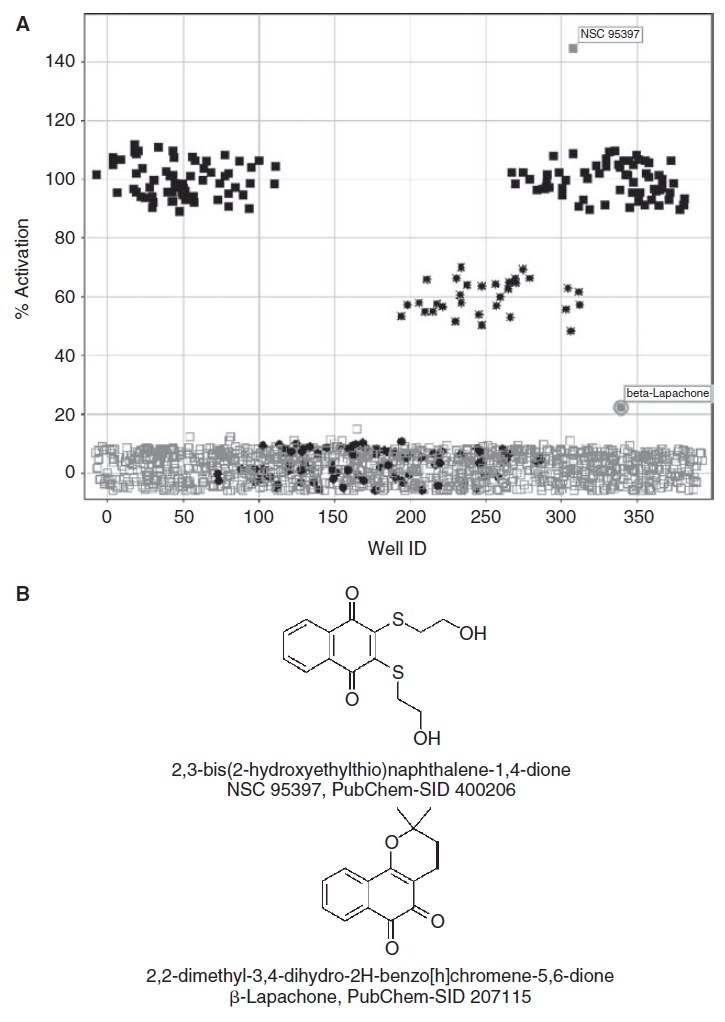
Screening the Library of Pharmacologically Active Compounds (LOPAC) set to identify redox cycling compounds (RCCs). (A) The 4 × 384-well plate overlay scatter plot of the % activation of H2O2 production data from the first iteration of the LOPAC screen. An ActivityBase™ HTS template was written to calculate the % activation based on the maximum (n = 32) and minimum (n = 24) plate controls for the HRP-PR H2O2 detection assay. A Spotfire® visualization of the % activation data from 4 × 384-well plates of the HRP-PR H2O2 production data for the first iteration of the LOPAC screen overlaid in a single scatter plot is presented; ( ) maximum (100 μM H2O2 in 1% Dimethyl Sulfoxide (DMSO), n = 32) plate controls, (
 ) minimum (1% DMSO, n = 24) plate controls, (
 ) 50% (50 μM H2O2 in 1% DMSO, n = 8) plate controls, and (
 ) 10 μM compounds in 0.8 mM DTT (1% DMSO, n = 320). (B) Chemical structures, names, and PubChem substance identity numbers (SIDs) of the RCCs identified in the LOPAC set. The chemical structures of 2,3-bis(2-hydroxyethylthio)naphthalene-1,4-dione (NSC 95397, PubChem-SID 400206), and 2,2-dimethyl-3,4-dihydro-2H-benzo[h]chromene-5,6-dione (β-lapachone, PubChem-SID 207115) are presented.
The redox cycling generation of H2O2 by the quinolinedione RCC DA3003-1 [NSC 663284 or 6-chloro-7-(2-morpholin-4-yl-ethylamino)quinoline-5,8-dione] requires a strong reducing agent and depends on the concentrations of both components.3 We therefore examined the concentration dependency of H2O2 generation for NSC 95397 and β-lapachone in the presence of the indicated concentrations of DTT, TCEP, or GSH (Fig. 2). Consistent with our previous observations,3 neither the compounds nor the reducing agents generated detectable levels of H2O2 when incubated separately (Fig. 2). Importantly, the physiologically relevant reducing agent GSH was unable to sustain the redox cycling production of H2O2 by either compound (Fig. 2). However, both NSC 95397 and β-lapachone generated H2O2 in the presence of DTT, and β-lapachone also generated H2O2 in the presence of TCEP. In the presence of 0.2 to 0.6 mM DTT, 10 μM NSC 95397 produced high levels of H2O2, which declined at the higher DTT concentrations of 0.8 and 1.0 mM, until at 5 and 10 mM DTT no signal above background was apparent (Fig. 2A). β-Lapachone at 10 μM generated maximal levels of H2O2 in the presence of 0.2 to 1.0 mM DTT, but at 5 and 10 mM DTT the levels of H2O2 were barely above background (Fig. 2B). In the presence of 0.2 to 0.6 mM TCEP, 10 μM β-lapachone produced high levels of H2O2, which declined at the higher TCEP concentrations of 0.8 and 1.0 mM, until at 5 and 10 mM TCEP no signal above background was apparent (Fig. 2B). These data were consistent with the biphasic DTT concentration response for H2O2 production by the quinolinedione RCC DA3003-1 [NSC 663284 or 6-chloro-7-(2-morpholin-4-yl-ethylamino)quinoline-5,8-dione].3 In the presence of 0.8 mM DTT, NSC 95397 exhibited concentration-dependent H2O2 generation with an AC50 of 10.23 ± 0.5 μM (Fig. 2C). In the presence of 0.8 mM DTT or 0.8 mM TCEP, β-lapachone exhibited concentration-dependent H2O2 generation with AC50s of 1.6 ± 1.1 μM and 30.2 ± 6.5 μM, respectively (Fig. 2D). These results demonstrated that H2O2 generation required both the test compound and a strong reducing agent, and that the level of H2O2 generated was proportional to the concentration of the 2 components of the redox cycling reaction. Furthermore, these data (Figs. 1 and 2) suggested that a compound concentration of 10 μM and a DTT concentration of 0.8 mM would be suitable conditions for profiling the redox cycling activity of the NIH SMR library.
Fig. 2. .

Concentration responses for the redox cycling compound (RCC)- and reducing agent-dependent redox cycling generation of H2O2. (A) Concentration responses of reducing reagents at 10 μM NSC 95397. In triplicate wells 20 μL of DTT ( ), TCEP (
 ), GSH (), or HBSS (
 ) (no reducing agent) at the indicated concentrations, ranging between 0.2 and 10 mM, were mixed together with 20 μL of 10.0 μM NSC 95397. The final concentrations of the components in the 60 μL assay volume are indicated. After 15 min, 20 μL of phenol red-HRP detection reagent was added and the assay was incubated for 5 min at ambient temperature before termination by the addition of 10 μL of 1 N NaOH and measurement of the absorbance at 610 nm in the M5 Spectromax plate reader. The data are presented as the mean absorbance ± SD of the mean of the triplicate wells, and connecting lines between the symbols were plotted by the Graphpad Prism software 4.03. (B) Concentration responses of reducing reagents at 10 μM β-lapachone. In triplicate wells 20 μL of DTT (), TCEP (), GSH (), or HBSS () (no reducing agent) at the indicated concentrations, ranging between 0.2 and 10 mM, were mixed together with 20 μL of 10.0 μM β-lapachone. The final concentrations of the components in the 60 μL assay volume are indicated. After 15 min, 20 μL of phenol red-HRP detection reagent was added and the assay was incubated for 5 min at ambient temperature before termination by the addition of 10 μL of 1N NaOH and measurement of the absorbance at 610 nm in the M5 Spectromax plate reader. The data are presented as the mean absorbance ± SD of the mean of the triplicate wells, and connecting lines between the symbols were plotted by the Graphpad Prism software 4.03. (C) Concentration responses of NSC 95397 in 0.8 mM reducing reagents. In triplicate wells 20 μL of NSC 95397 at the indicated concentrations, ranging between 0.2 and 50 μM, were mixed together with 20 μL of the indicated reducing reagents at 0.8 mM: DTT (), TCEP (), GSH (), or HBSS () (no reducing agent). The final concentrations of the components in the 60 μL assay volume are indicated. After 15 min, 20 μL of phenol red-HRP detection reagent was added and the assay was incubated for 5 min at ambient temperature before termination by the addition of 10 μL of 1 N NaOH and measurement of the absorbance at 610 nm in the M5 Spectromax plate reader. The data are presented as the mean absorbance ± SD of the mean of the triplicate wells, and the data were fit to a sigmoidal dose–response variable slope equation Y = bottom + [top-bottom]/[1 + 10ˆ(LogEC50-X)*HillSlope] by the Graphpad Prism software 4.03. (D) Concentration responses of β-lapachone in 0.8 mM reducing reagents. In triplicate wells 20 μL of β-lapachone at the indicated concentrations, ranging between 0.2 and 50 μM, were mixed together with 20 μL of the indicated reducing reagents at 0.8 mM: DTT (), TCEP (), GSH (), or HBSS () (no reducing agent). The final concentrations of the components in the 60 μL assay volume are indicated. After 15 min, 20 μL of phenol red-HRP detection reagent was added and the assay was incubated for 5 min at ambient temperature before termination by the addition of 10 μL of 1 N NaOH and measurement of the absorbance at 610 nm in the M5 Spectromax plate reader. The data are presented as the mean absorbance ± SD of the mean of the triplicate wells, and the data were fit to a sigmoidal dose–response variable slope equation Y = bottom + [top-bottom]/[1 + 10ˆ(LogEC50-X)*HillSlope] by the Graphpad Prism software 4.03.
A cross-target query of the UPDDI database revealed that NSC 95397 and β-lapachone have each been classified as active in 7/14 (50%) of the assays performed by the UPDDI (Table 1). At 10 μM, both compounds inhibited the activity of 4 PTPs MKP-1, MKP-3, YopH, and SptP by >90%, inhibited the induction of necroptosis in the L929-zVAD and Jurkat-FADD−/− TNFα cell models by >90%, and induced cell death in mouse embryo fibroblasts (Table 1). In contrast, neither compound exhibited significant activity at 10 μM in screening assays for several other targets including the PLK-1 and PKD kinases, the West Nile Virus NS2bNS3 serine protease (NS2bNS3), the HIV reverse transcriptase ribonuclease H (RT-RNase H), dexamethasone-induced glucocorticoid nuclear hormone translocation, and a p53-HDM2 protein–protein interaction biosensor assay. In data uploaded to PubChem, NSC 95397 (SID 400206) has been tested in 66 bioassays and active flags have been registered for 26 (39.4%) of these; 23 are for confirmed activity in National Cancer Institute (NCI) tumor cell growth inhibition assays; and 3 are in NCI yeast anticancer drug screens (Table 1). A cross-target query of PubChem reveals that β-lapachone (SID 207115) has been tested in 139 bioassays and active flags have been registered for 54 (39.8%) of these; 41 are for confirmed activity in NCI tumor cell growth inhibition assays, 5 are for inhibitors/substrates of CYP 450 isoforms, and the remaining active flags are in bioassays to identify NFkB signaling pathway inhibitors, Hsp90 inhibitors, PGE2 receptor inhibitors, thrombopoietin signaling pathway inhibitors, and inhibitors of cancer cells with p53 mutations (Table 1). These data demonstrate that there is a significant potential for RCCs to populate HTS databases with promiscuous bioactivity profiles, and that these RCCs are frequently confirmed as hits because their activity in bioassays is both reproducible and concentration-dependent.
Table 1. .
Cross-Target Queries of the UPDDI and PubChem Databases for the Bioactivity Profiles of the NSC 95397 and β-Lapachone Redox Cycling Hits From the LOPAC Set
| Compound | Database | Number of Assays | Number of Active Flags | Confirmed Targets |
|---|---|---|---|---|
| NSC 95397 SID 400206 |
UPDDI | 14 | 7 | MKP-1, MKP-3, YopH, SptP, L929-zVAD and Jurkat-FADD−/− TNFα necroptosis, and MEF cell death |
| β-Lapachone SID 207115 |
UPDDI | 14 | 7 | MKP-1, MKP-3, YopH, SptP, L929-zVAD and Jurkat-FADD−/− TNFα necroptosis, and MEF cell death |
| NSC 95397 SID 400206 |
PubChem | 66 | 26 | 23 NCI tumor cell growth inhibition assays and 3 NCI yeast anticancer drug screens |
| β-Lapachone SID 207115 |
PubChem | 139 | 54 | 41 NCI tumor cell growth inhibition assays, 5 CYP 450 isoform inhibitor/substrate assays, NFκB, Hsp90, PGE2 receptor, TPO, and cytotoxicity against cancer cells with p53 mutations |
University of Pittsburgh Drug Discovery Targets (UPDDI). Four protein tyrosine phosphatases (PTPs) targets: mitogen-activated protein kinase phosphatases 1 (MKP-1) and 3 (MKP-3); Yersinia enterocolitica outer protein H PTP (YopH); and Salmonella typhimurium PTP (SptP). Two cell models for the induction of necroptosis; the zVAD-induced necroptosis of L929 cells (L929-zVAD), and TNFα-induced necroptosis of Jurkat-FADD−/− cells (Jurkat-FADD−/− TNFα). Mouse embryo fibroblasts (MEF) cell death.
PubChem Targets include various National Cancer Institute (NCI) tumor cell growth inhibition assays and yeast anticancer drug screens. Assays for inhibitors or substrates of CYP 450 isoforms: 2C19, 3A4, 2D6, 2C9, and 1A2. NFκB signaling pathway inhibitors (NFκB), heat shock protein 90 kDa α (cytosolic) inhibitors (Hsp90), inhibitors of the EP2 prostaglandin E2 receptor (PGE2 receptor), antagonists of the thrombopoietin (TPO) signaling pathway, and selective inhibitors of cancer cells with p53 mutations.
We proceeded to screen 195,826 compounds from the NIH small molecule library for their ability to generate H2O2 at 10 μM when incubated in the presence of 0.8 mM DTT (Fig. 3). A 50-plate overlay of the % activation of H2O2 production from a single day of screening operations (Fig. 3A) demonstrates that the assay plate controls and corresponding assay signal window performed consistently and reproducibly, that the majority of compounds did not generate H2O2 in the presence of 0.8 mM DTT, and that an acceptable number of compounds (0.03% overall for the HTS) met the active criterion of ≥50% activation relative to the 100 μM H2O2 maximum plate controls. Indeed the HRP-PR H2O2 detection assay performed very well throughout the HTS campaign of 618 assay plates and the plate controls exhibited average Z′-factors and S:B ratios of 0.92 ± 0.02 and 7.4 ± 0.15, respectively. The majority of compounds failed to generate a signal significantly different from background and only 64 (0.03%) of the 195,826 compounds achieved the active criterion of ≥50% activation of H2O2 production (Fig. 3B). These data were uploaded by the PMLSC to PubChem and can be found as AID 878.
Fig. 3. .

Performance data for the HRP-PR H2O2 detection assay during the NIH compound library HTS. (A) A 50-plate overlay of the % activation of H2O2 production from a single day of screening operations. An ActivityBase™ HTS template was written to calculate the % activation based on the maximum (n = 32) and minimum (n = 24) plate controls for the HRP-PR H2O2 detection assay. A Spotfire® visualization of the % activation data from 50 × 384-well plates, utilized to screen 16,000 compounds from the NIH SMR library in the HRP-PR H2O2 production assay on 1 day of screening operations, are overlaid in a single scatter plot; () maximum (100 μM H2O2 in 1% Dimethyl Sulfoxide (DMSO), n = 32) plate controls, ( ) minimum (1% DMSO, n = 24) plate controls, (
 ) 50% (50 μM H2O2 in 1% DMSO, n = 8) plate controls, (
 ) compounds that were designated inactive (≤50% activation) at 10 μM in 0.8 mM DTT (1% DMSO), and (
 ) compounds that were designated active (≥50% activation) at 10 μM in 0.8 mM DTT (1% DMSO). (B) Overlay of the % activation of H2O2 production for the complete NIH Compound Library Screen. An ActivityBase™ HTS template was written to calculate the % activation based on the maximum (n = 32) and minimum (n = 24) plate controls for the HRP-PR H2O2 detection assay. A Spotfire® visualization of the % activation data from the 618 × 384-well assay plates utilized to screen 195,826 compounds from the NIH small molecule library in the HRP-PR H2O2 production assay are presented in a single overlaid scatter plot; (•) maximum (100 μM H2O2 in 1% DMSO, n = 32) plate controls, () minimum (1% DMSO, n = 24) plate controls, () compounds that were designated inactive (≤50% activation) at 10 μM in 0.8 mM DTT (1% DMSO), and () compounds that were designated active (≥50% activation) at 10 μM in 0.8 mM DTT (1% DMSO).
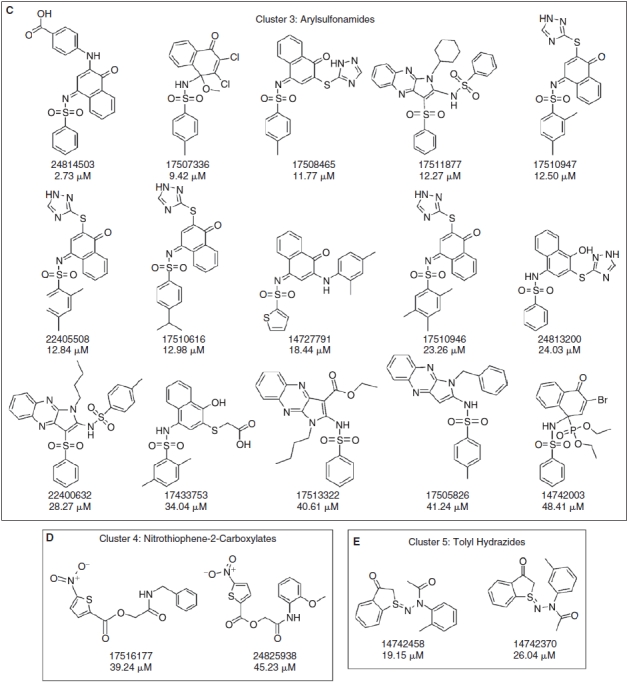
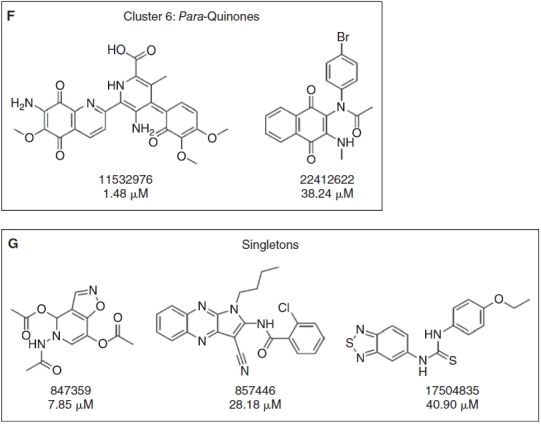
A total of 80 compounds, including the 64 actives from the primary screen and an additional 16 compounds that had achieved >30% but <50% activation, were requested from the SMR for confirmation. Only 73 of these compounds were available in the inventory, and 37 of the 73 (50.7%) were confirmed in 10-point concentration–response assays conducted in the presence of 0.8 mM DTT and starting at a maximum compound concentration of 50 μM (Fig. 4, Appendix Table 1). These data were uploaded by the PMLSC to PubChem (AID 1234). The chemical structures of the 37 compounds with AC50 values <50 μM were classified into 6 structural clusters and 3 singletons (Fig. 4). The core pharmacophores of the 6 clusters represent: 9 ortho-quinones, 2 para-quinones, 4 pyrimidotriazinediones, 15 arylsulfonamides, 2 nitrothiophene-2-carboxylates, and 2 tolyl hydrazides (Fig. 4). A similarity search was conducted on the compounds screened in the primary assay to identify compounds with structural similarity to the confirmed RCCs (Table 2). The most potent RCC compounds were quinones (Fig. 4A, 4B, and 4F), and of these 15 compounds 13 exhibited AC50s <10 μM, and 6 produced AC50s <1 μM. A total of 71 structurally similar quinone compounds were screened in the primary assay; 15 ortho-quinones, 51 para-quinones, and 5 pyrimidotriazinediones (Table 2). Interestingly, although 60% of the ortho-quinones and 80% of the pyrimidotriazinediones in the library were identified and confirmed as RCCs, only 3.9% of the para-quinones that were screened behaved as concentration-dependent RCCs in this assay (Table 2). The single largest cluster of RCCs was represented by the 15 arylsulfonamides (43% of RCCs), but they were less potent and exhibited AC50s in the 10–25 μM range (Fig. 4C). A substructure search of the screening library revealed that there were 17,868 compounds with a sulfonamide functional group and 251 compounds structurally related to the arylsulfonamide RCCs. Only 16 of the 251 arylsulfonamides exhibited the ability to generate H2O2 in the primary screen, and 15 (6%) were confirmed as concentration-dependent RCCs (Table 2). The concentration dependency of H2O2 generation for 3 of the arylsulfonamides in the presence of 0.8 mM DTT, TCEP, or GSH is presented in Figure 5. Consistent with our observations with quinone RCCs (Fig. 2),3 H2O2 generation by arylsulfonamide RCCs required a strong reducing agent such as DTT or TCEP, and the level of H2O2 generated was proportional to the concentration of arylsulfonamide (Fig. 5). The 2 representatives of the nitrothiophene-2-carboxylate (Fig. 4D) and tolyl hydrazide (Fig. 4E) clusters were also less potent RCCs with AC50s in the 20–50 μM range. The 2 confirmed nitrothiophene-2-carboxylate RCCs represent 50% of the 4 structurally similar compounds screened in the primary HTS, and the 2 tolyl hydrazides RCCs represent 66.7% of 3 related compounds in the library (Table 2). The AC50 values for the 3 singleton RCCs ranged from 7.85 to 40.9 μM (Fig. 4G). In the concentration range tested (0.09–50 μM), none of the compounds generated significant H2O2 levels in the absence of a reducing agent (HBBS) or in the presence of 0.8 mM GSH (Appendix Table 1). In contrast, 10 of the RCCs also exhibited AC50s <50 μM in the presence of 0.8 mM TCEP, and an additional 8 RCCs achieved between 15% and 30% activation at 50 μM in 0.8 mM TCEP (Appendix Table 1). Only compounds from the pyrimidotriazinedione (4/4), ortho-quinone (3/9), para-quinone (2/2), or arylsulfonamide (9/15) clusters generated H2O2 in the presence of TCEP, and 7 of the 10 RCCs that produced an AC50 in TCEP were compounds that exhibited AC50s <3 μM in DTT (Appendix Table 1).
Fig. 4. .

Compound structures and AC50s for redox cycling compounds (RCCs) confirmed in 10-point concentration dependence assays. RCCs that were identified in the HRP-PR H2O2 detection HTS and confirmed in 10-point dose–response AC50 assays were analyzed using the Leadscope Enterprise 2.4.6–1 software. The active compounds were subjected to structure-based clustering and classification techniques based on recursive partitioning that produced singleton structures and clusters of related structures. The PubChem substance identity numbers (SIDs), AC50s in μM, chemical structures, and names of the chemical clusters are presented; (A) Cluster 1: ortho-quinones, (B) Cluster 2: pyrimidotriazinediones, (C) Cluster 3: arylsulfonamides, (D) Cluster 4: nitrothiophene-2-carboxylates, (E) Cluster 5: tolyl hydrazides, (F) Cluster 6: para-quinones, and (G) singletons.
Table 2. .
Similarity Search of the NIH Compound Library for Compounds Related to the Confirmed RCC Structures
| Structural Class | Number of Compounds | % of Library | HTS RCC Actives | Number RCCs confirmed | % RCCs Confirmed | RCCs % in Library |
|---|---|---|---|---|---|---|
| Ortho-quinones | 15 | 0.008 | 9 | 9 | 100.0 | 60.0 |
| Para-quinones | 51 | 0.026 | 2 | 2 | 100.0 | 3.9 |
| Pyrimidotriazinediones | 5 | 0.003 | 5 | 4 | 80.0 | 80.0 |
| Tolyl hydrazides | 3 | 0.002 | 2 | 2 | 100.0 | 66.7 |
| Nitrothiophene-2-carboxylates | 4 | 0.002 | 3 | 2 | 66.7 | 50.0 |
| Arylsulfonamides | 251 | 0.129 | 16 | 15 | 93.8 | 6.0 |
The Leadscope Enterprise Predictive software was also used to perform a similarity search of the compounds screened in the primary assay for compounds that exhibited ≥40% structural similarity to the members of the 6 clusters of confirmed Redox Cycling Compounds (RCCs): 9 ortho-quinones, 2 para-quinones, 4 pyrimidotriazinediones, 15 arylsulfonamides, 2 nitrothiophene-2-carboxylates, and 2 tolyl hydrazides. The structures returned by the similarity search were then manually inspected and either validated or excluded. The number of compounds in the library that was screened that were structurally similar to the compounds in the 6 RCC clusters is presented (number of compounds) together with their % representation within the library (% of library). The number of RCC actives identified in the primary screen (HTS RCC actives) and number confirmed in concentration–response assays (number of RCCs confirmed) are also presented together with the % of the primary HTS RCC actives that were confirmed (% RCCs confirmed), and the % of the structurally similar RCCs contained within the library that were confirmed as RCCs.
Fig. 4. .
(Continued)
The PubChem database was queried with the SIDs of each of the 37 RCCs for their respective cross-target bioactivity profiles (Table 3). For comparison, we also queried the PubChem database with the SIDs of 37 substances randomly selected from the list of compounds that at 10 μM failed to generate significant levels (≥50%) of H2O2 in the presence of 0.8 mM DTT and were therefore designated inactive (non-RCCs) in the primary screen (Fig. 6). A substance or compound may be designated active in data uploaded to the PubChem database if it has met the active criterion in a primary screening campaign, and/or it has been “confirmed” to be active in a concentration-dependent manner. The number of bioassays that each RCC had been screened against ranged from 73 to 288 producing an average of 129 bioassays per compound, and for the non-RCC group the number of bioassays ranged from 110 to 250 giving an average of 148 bioassays per compound. A 2 sample t-test comparison between the RCC and non-RCC compound groups produced a P value of 0.055 indicating that the 2 groups of compounds had been screened in a comparable number of bioassays (Fig. 6A). The corresponding number of active flags in the PubChem database for each RCC ranged from 2 to 93, producing an average of 18 per compound, while for the non-RCC group the number of active flags ranged from 0 to 32, giving an average of 3 per compound (Fig. 6B). Despite having been screened in a comparable number of bioassays, a 2 sample t-test comparison between the RCC and non-RCC compound groups produced a P value of 0.000005 indicating that the number of active flags attributed to the RCC compounds was significantly higher (P value <0.01) (Fig. 6B). This was also true when the analysis was restricted to “confirmed” active flags (Fig. 6C), where the 2 sample t-test comparison between the RCC and non-RCC compound groups produced a P value of 0.0026, indicating that the higher number of confirmed active flags attributed to the RCC compounds was again significantly higher (P value < 0.01). Because of a concern that the cross-target bioactivity profiles might have been biased by the nature of the targets they had been screened against, we queried the PubChem database with the RCCs against a subset of 8 targets that are known to be sensitive to oxidation: the PTPs MKP-1, MKP-3, and Cdc25B; the cysteine proteases cathepsin L, cathepsin B, caspase 1, and caspase 7; and the heat shock protein 90 (Hsp90) (Appendix Table 2). However, the majority of the RCCs (34 of 37, 91.9%) have not been screened against any of these oxidation-sensitive targets. The pyrimidotriazinedione RCC SID 845167 has been screened against all 8 of the oxidation-sensitive targets and was confirmed active in all of them (Appendix Table 2). The 5-acetamido-4,5-dihydroisoxazolo[4,5-c]pyridine-4,7-diyl diacetate RCC (SID 847359) has only been screened against Cdc25B and Hsp90, and was confirmed active against both oxidation-sensitive targets (Appendix Table 2). In contrast, the N-(1-butyl-3-cyano-1H-pyrrolo[2,3-b]quinoxalin-2-yl)-2-chlorobenzamide benzooxadiazol-4-yl ester RCC (SID 857446) has been screened against all of the oxidation-sensitive targets except caspase 7, and was classified as inactive in all of these screens except for caspase 1, where its activity was considered inconclusive (Appendix Table 2). These data indicate that the apparent higher cross-target promiscuity of the RCC compounds (Fig. 6, Table 3, and Appendix Table 2) was not unduly biased or influenced by a high proportion of oxidation-sensitive targets.
Table 3. .
Cross-Target Query of the PubChem Database—Promiscuity Profile of Confirmed Redox Cycling Compounds (RCCs)
| Cluster | Core Functional group | PubChem-SID | # of Assays | # of Active Flags | # of Confirmed Flags | Confirmed Targets |
|---|---|---|---|---|---|---|
| 1 | Quinones | 14727570 | 73 | 11 | 2 | Smad-TF, ERα |
| 14727734 | 75 | 15 | 5 | Smad-TF, PLK-1-PBD | ||
| 22404392 | 109 | 13 | 3 | Tumor cell growth suppression | ||
| 16952991 | 144 | 27 | 5 | TNFα-stimulated VCAM-1, PLK-1-PBD, yeast lifespan | ||
| 14719117 | 153 | 20 | 4 | Smad-TF, tumor cell growth suppression | ||
| 14730721 | 164 | 33 | 6 | PLK-1-PBD, Smad-TF, MT1-MMP, NPY-Y2, cytotoxicity | ||
| 24809506 | 95 | 5 | 1 | — | ||
| 14742005 | 138 | 16 | 3 | Tumor cell growth suppression | ||
| 24812833 | 91 | 3 | 0 | — | ||
| 2 | Pyrimidotriazinediones | 14723875 | 165 | 36 | 7 | PLK-1-PBD, S1P2, Smad-TF, EBV, cytotoxicity |
| 845167 | 288 | 93 | 47 | S1P2, S1P3, MKP-1, MKP-3, LYP, RORA, SF-1, p53ts, caspase 1, caspase 7, Hsp90, cathepsin B, cathepsin L, 5HT1A, EBV, Cdc25B, RORA, LYP, cytotoxicity | ||
| 24809205 | 100 | 16 | 4 | Ras and Ras-related GTPases such as Rac and Cdc42 | ||
| 14726526 | 157 | 43 | 16 | p53ts, PLK-1-PBD, S1P2, Smad-TF, MT1-MMP, Ras and Ras-related GTPases such as Rac and Cdc42, tumor cell growth suppression, cytotoxicity | ||
| 3 | Arylsulfonamides | 24814503 | 99 | 9 | 3 | Mcl-1/Noxa, Bim-Bfl-1 |
| 17507336 | 110 | 22 | 2 | Mycobacterial GlmU | ||
| 17508465 | 111 | 20 | 3 | Mcl-1/Noxa, Mcl-1/Bid, Bim-Bfl-1 | ||
| 17511877 | 105 | 6 | 1 | — | ||
| 17510947 | 108 | 19 | 1 | — | ||
| 22405508 | 107 | 8 | 2 | Yeast lifespan shorteners, EBV | ||
| 17510616 | 110 | 17 | 4 | p53ts-cytox, Mcl-1/Noxa | ||
| 14727791 | 150 | 26 | 8 | p53ts-cytox, cytotoxicity, tumor cell growth suppression | ||
| 17510946 | 109 | 19 | 3 | Mcl-1/Noxa, Mcl-1/Bid | ||
| 24813200 | 103 | 10 | 1 | Mcl-1/Noxa | ||
| 22400632 | 108 | 3 | 0 | — | ||
| 17433753 | 112 | 8 | 1 | Mcl-1/Noxa | ||
| 17513322 | 109 | 3 | 1 | M1AAP | ||
| 17505825 | 111 | 7 | 1 | EBV | ||
| 14742003 | 163 | 26 | 9 | Mcl-1/Noxa, tumor growth suppression, 15-hLO-2, proliferation, ERα, EphA4 | ||
| 4 | Nitrothiophene-2-carboxylates | 17516177 | 107 | 2 | 1 | — |
| 24825938 | 95 | 2 | 1 | Mitochondrial fusion | ||
| 5 | Tolyl hydrazides | 14742458 | 147 | 7 | 2 | PLK-1-PBD |
| 14742370 | 157 | 8 | 3 | PLK-1-PBD, NFκB | ||
| 6 | para-Quinones | 11532976 | 110 | 19 | 3 | Yeast lifespan shorteners |
| 22412622 | 111 | 16 | 2 | Tumor cell growth suppression | ||
| Single-tons | Benzooxadiazol-4-yl ester | 847359 | 213 | 43 | 19 | S1P1, S1P2, S1P3, Cdc25B, Hsp90, 5HT1E, 5HT1A, p53ts-cytox, HADH2 |
| Cathepsin B, cathepsin L, E. coli tolc | ||||||
| Chlorobenzamide | 857446 | 251 | 16 | 2 | HSD17B4, cytotoxicity | |
| 4-Ethoxy-phenylthiourea | 17504835 | 109 | 6 | 0 | — |
The compounds were clustered on the basis of the relatedness of the chemical structures of their core pharmacaphores using Leadscope software. The PubChem substance identifier (SID) number of each compound was used to query the PubChem database to determine the number of assays the compound had been screened in (# of assays), the number of assays in which the compound had appeared to be active (# of active flags), and the number of times the compound had been confirmed active in confirmatory assays (# Confirmed). AC50 (μM) is the 50% effective concentration of activation of H2O2 generation in presence of 0.8 mM DTT from Appendix Table 1. The % of active flags (% active) was calculated from the (# of active flags × 100)/ # of assays. The % of confirmed flags was calculated from the (# confirmed × 100)/# of active flags.
Abbreviations: 5HT1A, 5-hydroxytryptamine (serotonin) receptor 1; A5HT1E, 5-hydroxytryptamine (serotonin) receptor 1E; Bfl-1, BCL-2-related protein A1; Bid, BH3 interacting domain death agonist; Bim, Bcl-2 interacting mediator of cell death; Cdc25B, Cell division cycle 25 homolog B; Cdc42, Cell division cycle 42 (GTP-binding protein, 25 kDa); E. coli tolc, Outer membrane transport channel in Escherichia coli; EBV, Epstein Barr virus; EphA4, EphA4 receptor tyrosine kinase; ERα, Estrogen receptor 1 (alpha); GlmU, UDP-N-acetylglucosamine pyrophosphorylase; GTPases, Guanine transfer phosphorylase; 15-hLO-2, 15-human lipoxygenase 2; HADH2, Hydroxyacyl-coenzyme A dehydrogenase, type II; HSD17B4, hydroxysteroid (17-beta) dehydrogenase 4; Hsp90, Heat shock protein 90; LYP, protein tyrosine phosphatase, non-receptor type 22 (lymphoid) isoform 1; M1AAP, Plasmodium falciparum M1—Family alanyl aminopeptidase; Mcl-1, Myeloid cell leukemia sequence 1; MKP-1, MAP kinase phosphatase 1; MKP-3, MAP kinase phosphatase 3; MT1-MMP, Membrane-type I matrix metalloproteinase; NFκB, Nuclear factor of kappa light polypeptide; gene enhancer in B cells 1; Noxa, literally “damage,” a BH3-only Member of the Bcl-2 Family; NPY-Y2, Neuropeptide Y receptor Y2; p53ts, Temperature-sensitive mutant of the tumor suppressor p53; PLK-1-PBD, Polo-like kinase polo box domain; PubChem-SID, PubChem structural identification number; Rac, Ras-related proteins; Ras, Oncogenic family of p21 proteins; RORA, RAR-related orphan receptor alpha; S1P1, Sphingosine-1-phosphate receptor 1; S1P2, Sphingosine-1-phosphate receptor 2; S1P3, Sphingosine-1-phosphate receptor 3; SF-1, Steroidogenic factor 1; SID, PubChem Substance Identity Number; Smad-TF, Smad transcription factor; TNFα, Tumor necrosis factor alpha; VCAM-1, Vascular cell adhesion molecule 1.
Fig. 4. .
(Continued)
Fig. 6. .
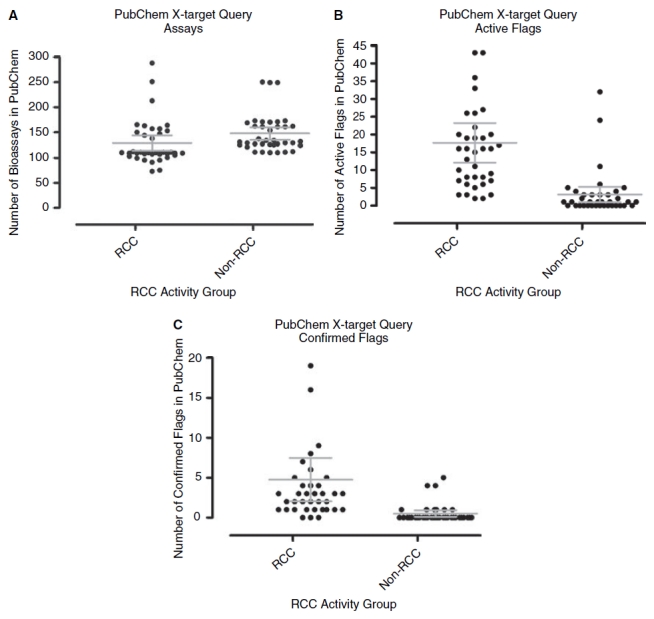
A comparison of the results of cross-target queries of PubChem with the PubChem Substance Identity Numbers (SIDs) from 37 redox cycling compounds (RCCs) and 37 randomly selected non-RCCs. The PubChem database was queried with the SIDs of each of the 37 confirmed RCCs and for comparison, 37 SIDs randomly selected from the compounds that were designated inactive (non-RCCs) in the primary screen. The bioassay activity information is captured in 2 PubChem data fields, the activity outcome and the activity score. A substance may be flagged active in bioassay data uploaded to PubChem if it meets the active criterion for the assay that has been designated appropriate by the depositor. A substance may be flagged a “confirmed” active in bioassay data uploaded to PubChem if it exhibits a concentration response that has been designated appropriate by the depositor. (A) Number of bioassay data entries in PubChem for RCCs and non-RCCs. The total number of bioassay data entries in PubChem for the 37 individual RCC and non-RCC SIDs are presented in 2 groups, together with the average number of entries for each group and the 95% confidence intervals. On average, the RCCs and non-RCCs had been screened in 129 and 148 bioassays, respectively, and a 2 sample t-test comparison produced a P value of 0.055 indicating that the compounds in both groups had been screened in a comparable number of bioassays. (B) Number of active flags in PubChem for RCCs and non-RCCs. The total number of active flag entries in PubChem for the 37 individual RCC and non-RCC SIDs are presented in 2 groups, together with the average number of entries for each group and the 95% confidence intervals. On average, the corresponding number of active flags per substance in the PubChem database for the RCCs and non-RCCs were 18 and 3, respectively, and the RCC compound group exhibited a significantly (P value < 0.01) higher number of active flags in PubChem. (C) Number of confirmed active flags in PubChem for RCCs and non-RCCs. The total number of confirmed active flag entries in PubChem for the 37 individual RCC and non-RCC SIDs are presented in 2 groups, together with the average number of entries for each group and the 95% confidence intervals. On average, the corresponding number of confirmed active flags per substance for the RCCs and non-RCCs were 4.75 and 0.5, respectively. The RCC compound group exhibited a significantly (P value < 0.01) higher number of “confirmed” active flags in PubChem.
DISCUSSION
RCCs placed in aqueous buffers containing oxygen and DTT generate significant concentrations (μM) of H2O2 that may indirectly inhibit the activity of target proteins susceptible to oxidation.1–4,6,7,26,27 For example, the active site cysteines of PTPs have a low pKa of 4.7–5.4 and exist as thiolate anions at neutral pH, which enhances their catalytic activity and also their susceptibility to inactivation by H2O2 generated by RCCs in the presence of DTT.1–4 A reaction scheme for the generation of H2O2 by redox cycling between a RCC and DTT in the presence of oxygen has been proposed1,3,5 (Fig. 7): (1) DTT reacts with the RCC to form dihydroxydithiane (ox-DTT) and a hydro-RCC; (2) when the hydro-RCC and RCC are present together they undergo a synproportionation to form a transient radical anion species (RCC˙−) and 2H+; (3) the RCC˙− radical anion reacts with O2 to form superoxide (O2˙−) and regenerates the RCC; (4) DTT may also react with O2 in the buffer to generate O2˙− and ox-DTT; (5) O2˙− can oxidize a hydro-RCC resulting in the production of a RCC˙− radical anion and H2O2. There are several hallmark characteristics that have been used to distinguish RCCs from hit compounds that modulate target protein activities directly.1–4,7,27 Caspase 8 inhibition by quinone RCCs is time-dependent, abolished by catalase, and occurs in strong reducing agents like DTT or TCEP, but not in GSH or Cys.7 Inhibition of PTPα by ortho-quinone RCCs is also time-dependent, is sensitive to superoxide dismutase (SOD) and catalase, and depends on the concentrations of both the compound and DTT.1 Ortho-quinone RCCs produce H2O2 through redox cycling in the presence of strong reducing agents such as DTT or TCEP, but not in GSH or Cys.1 The in vitro inhibition of Cdc25B by quinolinedione RCCs is irreversible, time-dependent, and sensitive to pH, catalase, and reducing agents.2,26 In the absence of DTT, the quinolinedione RCCs did not inhibit Cdc25B in vitro, and the addition of catalase to the in vitro assay buffer containing DTT abolished Cdc25B inhibition.2,26
Fig. 5. .
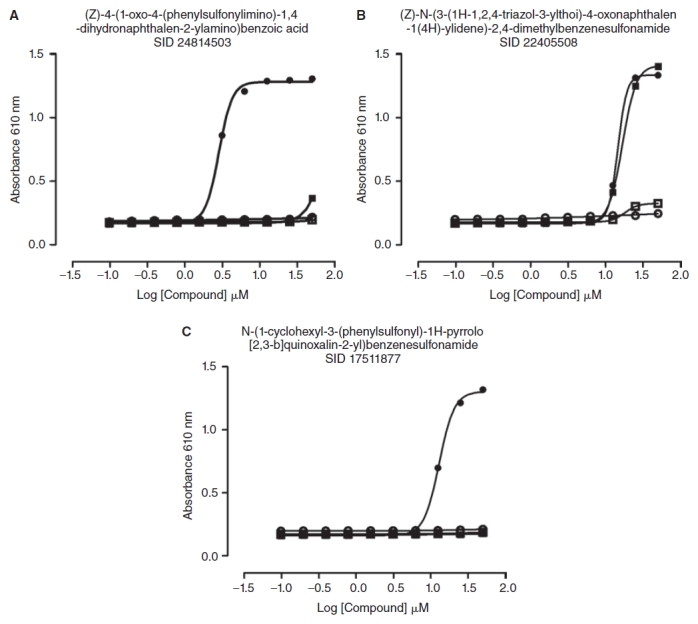
Concentration responses of arylsulfonamide Redox Cycling Compounds (RCCs) in 0.8 mM reducing reagents. In triplicate wells 20 μL of 4 of the arylsulfonamide RCCs at the indicated concentrations, ranging between 0.2 and 50 μM, were mixed together with 20 μL of the indicated reducing reagents at 0.8 mM: DTT (•), TCEP (), GSH (), or HBSS () (no reducing agent). The final concentrations of the components in the 60 μL assay volume are indicated. After 15 min, 20 μL of phenol red-HRP detection reagent was added and the assay was incubated for 5 min at ambient temperature before termination by the addition of 10 μL of 1 N NaOH and measurement of the absorbance at 610 nm in the M5 Spectromax plate reader. The data are presented as the mean absorbance ± SD of the mean of the triplicate wells, and the data were fit to a sigmoidal dose–response variable slope equation Y = bottom + [top-bottom]/[1 + 10ˆ(LogEC50-X)*HillSlope] by the Graphpad Prism software 4.03. (A) SID 24814503, (B) SID 22405508, and (C) SID 17511877.
Fig. 7. .
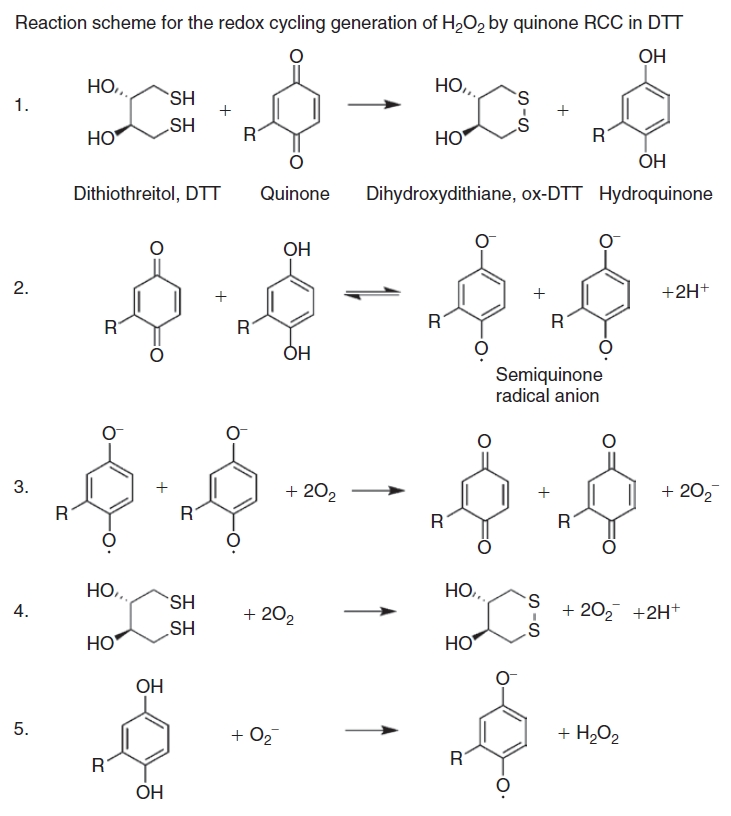
Reaction scheme for the generation of H2O2 by the redox cycling reaction between a redox cycling compound (RCC) and dithiothreitol (DTT) in the presence of oxygen. (1) DTT reacts with the RCC to form dihydroxydithiane (ox-DTT) and a hydro-RCC; (2) when the hydro-RCC and RCC are present together, they undergo a synproportionation reaction to form a transient radical anion species and 2H+; (3) the RCC−˙ radical anion reacts with O2 to form superoxide (O2−) and regenerate the RCC; (4) DTT may also react with O2 in the buffer to generate O2− and ox-DTT; (5) O2− can oxidize a hydro-RCC resulting in the production of a RCC−˙ radical anion and H2O2.
Rather than expend critical resources and time to identify RCCs in a complex follow-up testing paradigm,1,2,6,7 we have developed an assay that accurately measures the H2O2 generating capability of RCCs in DTT containing buffers with respect to time and concentration dependence, catalase sensitivity, and the requirement for strong reducing agents.1–4,7,27 Recently a surrogate assay to detect small molecule redox activity has been used to identify undesirable promiscuous nuisance compounds in the hits from historical HTS campaigns conducted at GlaxoSmithKline (GSK).6 Pyrimidotriazinedione hits identified in a Cathepsin L (CatL) cysteine protease inhibitor screen were subsequently found to be promiscuous hits in many GSK HTS campaigns, predominantly those against cysteine proteases, metalloenzymes, or other drug targets with an active site cysteine.6 In a HTS campaign to identify activators of glucokinase (GK) activity, 97% of the 2,262 primary screening actives were found to be nuisance hits that interfered with the resazurin-coupled assay format.6 The generation of resorufin product was independent of GK activity and required only compound, resazurin and DTT. This inspired the development of a surrogate assay to identify redox active compounds.6 Several structural classes of RCCs were identified in screening hits (caspase 8, PTP-1B, and taurine dioxygenase), and 2.3% of a 10,000 compound HTS validation library were found to be redox active at 10 μM.6
There are, however, inconsistencies between the performance of the resazurin surrogate assay6 and the behavior of RCCs.1–4,7,26,27 The pyrimidotriazinedione control compound (5 μM) generated O2˙− in the presence of DTT (10 μM) that was readily detected in a cytochrome c assay, but was prevented by the inclusion of SOD.6 However, the inclusion of SOD and/or catalase in the resazurin assay reaction did not prevent the generation of resorufin by compounds in DTT, indicating that the reaction is not mediated by either the O2˙− or H2O2 ROS.6 In addition, the amount of resorufin product generated was limited by the amount of resazurin and DTT in the reaction, but not by the compound concentration.6 It was proposed that the compound is not a substrate but behaves as a catalyst facilitating the 2e− reduction of resazurin by DTT.6 Addition of 10 mM GSH or N-acetyl cysteine had no effect on the reaction of the pyrimidotriazinedione control with the resazurin-DTT mixture, but it is unclear whether weak reducing agents such as GSH or Cys can substitute for DTT in the surrogate assay.6 Despite these inconsistencies, the surrogate assay successfully identified previously described RCCs1,7 and several other structural classes.6 The reduction of resazurin to resorufin is a widely utilized assay format to measure cell viability (mammalian cells, bacteria, and parasites), and is frequently employed in coupled enzyme assays to measure the activity of target enzymes that reduce NAD to NADH.28,29 Although the homogeneous format and robust fluorescent assay signal window are attractive features of resazurin assays, the potential for interference by RCCs in DTT containing buffers6 may contribute to high hit rates and large numbers of false positives.
We report here the first systematic use of the HRP-PR H2O2 detection assay to profile the LOPAC and NIH compound libraries for RCCs (Figs. 1 and 3). Two RCCs were identified in the LOPAC library, the ortho-naphthoquinone β-lapachone (SID 207115) and the para-naphthoquinone NSC 95397 (SID 400206) (Figs. 1 and 2). In agreement with previous studies,3 the generation of H2O2 exhibited concentration-dependent behavior for both the RCC and DTT, and the DTT concentration response was biphasic (Fig. 2). No H2O2 was produced by RCCs in buffer alone or in the physiological reducing agent GSH, but β-lapachone also generated H2O2 in TCEP, another strong reducing agent (Fig. 2). From 195,826 compounds in the NIH small molecule library 37 (0.02%) concentration-dependent RCCs were identified (Figs. 3 and 4, Appendix Table 1). None of the 37 RCCs generated H2O2 in HBSS buffer alone or in GSH, but 18 (48%) RCCs also generated H2O2 in TCEP (Appendix Table 1). Seventeen (45.9%) of the 39 RCCs identified in the 2 screens contained quinone functional groups (Figs. 1 and 4) that are structurally similar to previously described pyrimidotriazinedione, ortho-quinone, and para-quinone RCCs.1–4,6,7 Seventy-one structurally related quinone compounds were screened in the primary assay and 60% of the ortho-quinones and 80% of the pyrimidotriazinediones in the library were identified and confirmed as RCCs (Table 2). However, only 3.9% of the para-quinones that were screened behaved as concentration-dependent RCCs (Table 2). Only 16 of the 251 arylsulfonamides in the library generated H2O2 in the primary screen, and 15 (6%) were confirmed as concentration-dependent RCCs (Fig. 4C, Table 2, and Appendix Table 1). Consistent with Figure 2 and our observations with quinone RCCs,3 H2O2 generation by arylsulfonamide RCCs required a strong reducing agent such as DTT or TCEP, and the level of H2O2 generated was proportional to the compound concentration (Fig. 5). Only quinone and arylsulfonamide RCCs generated H2O2 in the presence of TCEP (Figs. 2 and 5, Appendix Table 1), The singleton RCC N-(1-butyl-3-cyano-1H-pyrrolo[2,3-b]quinoxalin-2-yl)-2-chlorobenzamide benzooxadiazol-4-yl ester (Fig. 4G, SID 857446), is structurally related to a previously described RCC (SID 3712327) identified in the hits from a MKP-1 HTS.3,15 We have identified 4 new RCC pharmacophores: 2 nitrothiophene-2-carboxylates (Fig. 4D); 2 tolyl hydrazides; and 2 singleton RCCs, 5-acetamido-4,5-dihydroisoxazolo[4,5-c]pyridine-4,7-diyl diacetate (SID 847359), and 1-(benzo[c][1,2,5]thiadiazol-5-yl)-3-(4-ethoxyphenyl)thiourea (SID 17504835) (Fig. 4G).
Screening quinone RCCs in buffers containing DTT generates H2O2 that inhibits the in vitro activity of target proteins that are susceptible to oxidation; caspase 8, cathepsin L, PTPα, MKP-1, and Cdc25B.1,6,7,15,27 Pyrimidotriazinedione and ortho-quinone RCCs were among the promiscuous hits identified in HTS campaigns against cysteine proteases, metalloenzymes, and other target proteins with active site cysteines.6,7 Seven confirmed pyrimidotriazinedione hits, identical to the RCCs presented here (Fig. 4B) or that have been characterized previously,3,6,7 were identified in an HTS campaign conducted by the NIH Chemical Genomics Center (NCGC) to identify small molecules that disrupt the interaction between the C-terminal peptide of heat shock protein 90 (Hsp90) and the TPR2A domain of the Hsp organizing protein (HOP) (AIDs 595, 632, and 1400).30–32 The TPR2A domain of HOP contains 2 Cys residues and binding to the C-terminal peptide of Hsp90 is better in the presence of DTT.32 Even though both the primary HTS and secondary assays for the Hsp90–TPR2A interaction screen were conducted in the presence of DTT,32 the potential role of H2O2 generated by the pyrimidotriazinedione RCCs in the observed disruption of the Hsp90–TPR2A interaction was neither considered nor excluded.30,31 The ortho-quinone β-lapachone is an effective cytostatic agent in tumor cell lines that can generate damaging ROS following 1- or 2-electron reductions, and may function as a checkpoint activator in the absence of DNA damage.33,34 Several of the ortho-quinone RCCs in the NIH library have also been confirmed in tumor cell growth suppression and cytotoxicity assays (Table 3). The para-quinone NSC 95397 is a potent inhibitor of the Cdc25 A, B, and C isoforms in vitro, and inhibits the growth of a number of human and murine tumor cell lines by blocking the G2 to M transition.4,35,36 NSC 95397 is also an RCC capable of generating H2O2 in buffers containing DTT (Figs. 1 and 2).4 Not surprisingly, both the β-lapachone and NSC 95397 RCCs were inhibitors of in vitro PTP screens conducted in DTT containing buffers; MKP-1, MKP-3, YopH, and SptP (Table 1). β-Lapachone and NSC 95397 also exhibited activity in a significant number of NCI tumor cell growth inhibition assays (Table 1).
Quinones are Michael acceptors that may covalently bind to cellular nucleophiles including GSH, Cys residues on proteins, and amino groups on proteins and DNA.4,37 In cells, quinones undergo an enzymatic one-electron reduction catalyzed by microsomal NADPH cytochrome P450 reductase to the semiquinone radical, and in the presence of molecular oxygen, the semiquinone radical can transfer an electron and generate O2˙−.37,38 This reaction shunts electrons toward oxygen as a futile pathway for reducing equivalents otherwise used for cytochrome P450 reductase-dependent reactions.37,38 O2˙− can dismutate to form other ROS like H2O2 and ˙OH and these highly reactive species may react directly with DNA or other cellular macromolecules causing cell damage.37,38 The 2-electron reduction of a quinone to the hydroquinone can also be catalyzed by cytosolic and mitochondrial DT-diaphorase and quinone oxidoreductase.37,38 Quinones may also undergo nonenzymatic redox cycling with their corresponding semiquinone radicals to generate ROS that can oxidize or damage DNA, mitochondria, lipids, and the cysteine residues of proteins.4,37 Indeed, it has been proposed that the ability of quinone RCCs to undergo redox cycling and to generate H2O2 within cells may be the basis of their widespread cellular activities.1,2,30,37,38 Quinones cause toxicity in vivo through a variety of mechanisms including: GSH and/or ATP depletion, damage to DNA and/or mitochondria, and the oxidation or alkylation of critical cellular proteins.4,37 Despite the challenges of acute toxicity in vivo, a number of quinones have been clinically validated as anticancer drugs including; menadione, daunorubicin, doxorubicin, mitomycin C, mitoxanthrone, ametantrone, carbazilquinone, diaziquone, streptonigrin, and actinomycin D.4,37,39
The 15 arylsulfonamide RCCs identified in the NIH library (Fig. 4C and Appendix Table 1) are structurally similar to 2 of the hits from a taurine dioxygenase inhibitor screen that were active in the resazurin surrogate assay.6 The sulfonamides constitute an important class of pharmacological agents possessing antitumor, antiviral, antibacterial, antifungal, antimalarial, diuretic, hypoglycemic, and antithyroid activity among others.40–42 Sulfonamide-based inhibitors have been designed for many enzyme targets: carbonic anhydrases, aspartic proteases, serine proteases, metalloproteases, matrix metalloproteinases, steroid sulfatases, and PTPs.40–42 The sulfonamide functionality is widely used by medicinal chemists in the design of biologically active small molecules, and is often incorporated into drug candidates to improve physicochemical properties such as water solubility and bioavailability.40–42 In 11 of the 15 arylsulonamide RCCs, the oxonaphthalen-1(4H)-yl-idene-benzenesulfonamides and the hydroxynaphthalen-1-yl-benzenesulfonamides, the amino groups of the arylsulfonamide groups are attached at the para-position of quinone-like structures (Fig. 4C). The other 4 1H-pyrrolo [2,3-b]quinoxalin-2-yl-benzenesulfonamide RCCs contain amine components that have reactive functionalities prone to redox activities (Fig. 4C). Since there were 17,868 compounds with a sulfonamide functional group and 251 structurally related arylsulfonamides in the library (Table 2), we conclude that the redox cycling activity of the 15 arylsulfonamide RCCs is not due to the sulfonamide function itself, but rather to peripheral reactive enone, aromatic, or heterocyclic functions.
The 195,826 substances from the NIH compound library were acquired and distributed by the SMR in multiple shipments during the first 2 years (2005–2007) of the pilot phase of the MLSCN.3,15,20,21,23,27 Many of the MLSCN bioassay data sets uploaded to PubChem were screened against earlier versions of the library with fewer compounds (10K, 65K, or 97K).3,15,20,21,23,27 Consequently not all of the compounds that we profiled for RCC activity would have been screened in the same bioassays, and many of these assays may have been conducted in cell-based and biochemical formats that did not employ exogenous reducing agents. Nonetheless, the 37 RCCs identified in the NIH library and the 37 randomly selected non-RCCs compounds were found to have been screened in a comparable number of bioassays (Fig. 6A). We observed that the RCCs exhibited a significantly (P value < 0.01) higher number of active flags and “confirmed” active flags in PubChem compared to non-RCCs, illustrating the potential of RCCs to populate screening databases with promiscuous bioactivity profiles (Fig. 6, Table 3). It is of interest that the majority (91.9%) of the RCCs had not been screened against any of the well known oxidation-sensitive targets in the database (Appendix Table 2), suggesting that more targets may be susceptible to oxidation than has previously been recognized. H2O2 is a ubiquitous intracellular messenger that modulates the activity of a variety of proteins including protein phosphatases, protein kinases, cysteine proteases, transcription factors, phospholipases, ion channels, and G proteins.43,44
CONCLUSION
We have profiled the LOPAC and NIH compound libraries in our HRP-PR HTS assay and identified 39 RCCs that in the presence of DTT and oxygen generate μM concentrations of H2O2. The generation of H2O2 by RCCs requires strong reducing agents such as DTT or TCEP, and depends upon the concentrations of both the RCC and the reducing agent. The substitution of GSH or Cys for DTT would therefore be highly recommended in HTS assay buffers whenever these reducing agents can effectively maintain the biological activity of the target protein to achieve a signal window compatible with screening. Caution should exercised by assay developers and screeners, however because GSH and Cys have the potential to form protein adducts that may in turn be problematic. When the use of DTT is unavoidable, our data suggest that DTT concentrations ≥10 mM may serve to reduce the number of false positives due to RCCs. Investigators should also consider the potential for RCCs to interfere with HTS assay formats that utilize the reduction of substrates by intracellular reducing enzymes to measure cell viability, or that employ coupled enzyme assay formats to measure the reducing activity of target enzymes; RCC false positives will contribute to significantly higher hit rates in screens employing these assay formats. Cross-target queries of the UPDDI and PubChem databases revealed that RCCs exhibited promiscuous bioactivity profiles and have populated both screening databases with significantly higher numbers of active flags than non-RCCs. Although RCCs were promiscuously active against target proteins susceptible to oxidation, they were also frequently active in cell growth inhibition assays, and against targets not considered sensitive to oxidation. Profiling compound libraries or the hits from HTS campaigns in the HRP-PR H2O2 detection assay significantly reduces the timelines and resources required to identify and eliminate promiscuous nuisance RCCs from the candidates for lead optimization.
ACKNOWLEDGMENTs
This work was supported by a grant from the National Institutes of Health; Molecular Library Screening Center Network (U54MH074411), NIH CA78039; and a grant from the Commonwealth of Pennsylvania (DOH-SAP4100027294).
ABBREVIATIONS:
- AIDs
PubChem Assay Identifiers
- BME
β-mercaptoethanol
- CatL
Cathepsin L
- Cys
Cysteine
- DMSO
Dimethyl Sulfoxide
- DTT
Dithiothreitol
- FDA
Federal Drug Administration
- GSH
Glutathione
- GSK
GlaxoSmithKline
- HBSS
Hank’s Balanced Salt Solution
- HOP
Hsp organizing protein
- H2O2
Hydrogen peroxide
- HRP
Horseradish Peroxidase
- HRP-PR
Horseradish peroxidase–phenol red detection reagent
- Hsp90
Heat Shock Protein 90
- LOPAC
Library of Pharmacologically Active Compounds
- MLSCN and MLPCN
Molecular Library Screening Centers Network
- NCGC
NIH Chemical Genomics Center
- NIH
National Institutes of Health
- PMLSC
Pittsburgh Molecular Library Screening Center
- PR
Phenol Red
- PTPs
Protein Tyrosine Phosphatases
- RCCs
Redox Cycling Compounds
- ROS
Reactive Oxygen Species
- SIDs
PubChem Substance Identity numbers
- SMR
Small Molecule Repository
- TCEP
tris(2-carboxyethyl)phosphine
- UPDDI
University of Pittsburgh Drug Discovery Institute.
Appendix Table 1. .
Comparison of the Concentration-Dependent Generation of H2O2 by Compounds in Different Reducing Agents
|
Compounds |
DTT |
TCEP |
GSH |
HBSS |
||||
|---|---|---|---|---|---|---|---|---|
| PubChem-SID | % Activation at 50 μM | AC50 μM | % Activation at 50 μM | AC50 μM | % Activation at 50 μM | AC50 μM | % Activation at 50 μM | AC50 μM |
| 14727570 | 134.74 | <0.01 | 171.40 | 25.30 | 3.60 | >50 | 0.80 | >50 |
| 14727734 | 115.48 | 0.19 | 3.99 | >50 | −0.60 | >50 | 1.80 | >50 |
| 22404392 | 128.95 | 0.43 | 53.25 | 48.70 | 3.30 | >50 | 1.00 | >50 |
| 16952991 | 109.74 | 0.72 | 1.70 | >50 | 2.50 | >50 | 0.50 | >50 |
| 14723875 | 111.50 | 0.90 | 86.65 | 23.10 | 2.50 | >50 | 6.70 | >50 |
| 845167 | 112.80 | 0.90 | 57.30 | 37.90 | 2.40 | >50 | 1.80 | >50 |
| 11532976 | 121.55 | 1.48 | 157.10 | 4.10 | 2.70 | >50 | 1.40 | >50 |
| 24809205 | 110.69 | 1.51 | 68.60 | 25.50 | 4.30 | >50 | 1.50 | >50 |
| 24814503 | 127.08 | 2.73 | 19.80 | >50 | 1.10 | >50 | 1.10 | >50 |
| 14726526 | 114.91 | 2.76 | 91.89 | 6.80 | 2.90 | >50 | 2.50 | >50 |
| 14730721 | 114.50 | 2.88 | 0.00 | >50 | 1.40 | >50 | 0.70 | >50 |
| 24809506 | 116.49 | 3.11 | 16.60 | >50 | 3.00 | >50 | 1.50 | >50 |
| 14742005 | 78.78 | 6.44 | 0.10 | >50 | 3.10 | >50 | 0.60 | >50 |
| 847359 | 133.23 | 7.85 | 110.00 | >50 | 1.40 | >50 | 0.90 | >50 |
| 17507336 | 123.59 | 9.42 | 5.70 | >50 | 0.40 | >50 | 0.10 | >50 |
| 14719117 | 107.90 | 9.85 | 0.20 | >50 | 3.50 | >50 | 0.80 | >50 |
| 17508465 | 115.53 | 11.77 | 4.00 | 28.00 | 3.40 | >50 | 0.80 | >50 |
| 17511877 | 117.92 | 12.27 | 0.20 | >50 | 3.30 | >50 | 0.70 | >50 |
| 17510947 | 126.66 | 12.50 | 23.00 | >50 | 0.70 | >50 | 0.30 | >50 |
| 22405508 | 131.06 | 12.84 | 120.93 | 13.30 | 2.10 | >50 | 16.20 | >50 |
| 24812833 | 110.79 | 12.87 | 7.90 | >50 | 3.60 | >50 | 1.40 | >50 |
| 17510616 | 121.21 | 12.98 | 29.20 | >50 | 0.80 | >50 | 1.20 | >50 |
| 14727791 | 94.83 | 18.44 | 0.50 | >50 | 3.10 | >50 | 0.30 | >50 |
| 14742458 | 129.86 | 19.15 | 2.20 | >50 | 2.70 | >50 | 0.50 | >50 |
| 17510946 | 114.68 | 23.26 | 55.59 | 45.50 | 1.40 | >50 | 2.20 | >50 |
| 24813200 | 112.06 | 24.03 | 21.00 | >50 | −0.20 | >50 | 0.00 | >50 |
| 14742370 | 122.00 | 26.04 | 1.20 | >50 | 3.10 | >50 | 0.30 | >50 |
| 22400632 | 126.92 | 28.27 | −1.70 | >50 | 3.60 | >50 | 1.10 | >50 |
| 857446 | 127.03 | 28.18 | 1.00 | >50 | 3.40 | >50 | 1.20 | >50 |
| 17433753 | 113.55 | 34.04 | 24.60 | >50 | 4.00 | >50 | 0.80 | >50 |
| 22412622 | 94.24 | 38.24 | 32.90 | >50 | 4.10 | >50 | 2.50 | >50 |
| 17516177 | 71.07 | 39.24 | 0.50 | >50 | 3.60 | >50 | 1.30 | >50 |
| 17513322 | 121.83 | 40.61 | 15.90 | >50 | 6.80 | >50 | 1.70 | >50 |
| 17504835 | 90.21 | 40.90 | 0.10 | >50 | 0.40 | >50 | 0.10 | >50 |
| 17505825 | 98.90 | 41.24 | 0.10 | >50 | 3.80 | >50 | 1.60 | >50 |
| 24825938 | 64.55 | 45.23 | 0.40 | >50 | 3.60 | >50 | 1.30 | >50 |
| 14742003 | 62.96 | 48.41 | 1.40 | >50 | 3.20 | >50 | 0.70 | >50 |
The amount of H2O2 generated by compounds in the presence of reducing agents was expressed as the % activation of the mean maximum (100 μM H2O2, n = 32) and mean minimum (0.5% DMSO in HBSS, n = 24) plate controls calculated with an ActivityBase™ concentration–response template. The % activation at the highest compound concentration tested (50 μM) is presented together with the AC50 (50% effective concentration of activation in μM) calculated using an XLfit 4-parameter logistic (sigmoidal dose–response) model: y = (A+((B-A)/(1+((C/x)ˆD)))), where y is the percent activation and x is the corresponding compound concentration. The fitted C parameter is the AC50 and defined as the concentration giving a response half way between the fitted top (B) and bottom (A) of the curve. The A and B parameters were locked as 0 and 100, respectively. The 10-point AC50 assays were conducted in single wells per concentration, and performed in Hank’s balanced salt solution (HBSS) in the absence or presence of a 0.8 mM concentration of 3 different reducing agents; dithiothreitol (DTT); reduced glutathione (GSH); or TCEP: tris(2-carboxyethyl)phosphine. Compounds were identified by their PubChem substance identifier (SID) numbers.
Abbreviations: DTT, Dithiothreitol; SID, PubChem Substance Identity Number.
Appendix Table 2. .
Cross-Target Query of PubChem With Redox Cycling Compounds (RCCs) Against Oxidation-Sensitive Targets
|
Target |
|
MKP-1 |
MKP-3 |
Cdc25B |
Caspase 1 |
Caspase 7 |
Cathepsin L |
Cathepsin B |
Hsp90 |
||||||||
|---|---|---|---|---|---|---|---|---|---|---|---|---|---|---|---|---|---|
|
AID |
RCC |
374 |
551 |
425 |
553 |
368 |
569 |
900 |
900 |
897 |
897 |
460 |
825 |
453 |
820 |
429 |
712 |
| SID | AC50 μM | HTS Active | Conf. active | HTS Active | Conf. active | HTS Active | Conf. active | HTS Active | Conf. active | HTS Active | Conf active | HTS Active | Conf active | HTS Active | Conf. active | HTS Active | Conf. active |
| 14727570 | <0.01 | NT | NT | NT | NT | NT | NT | NT | NT | ||||||||
| 14727734 | 0.19 | NT | NT | NT | NT | NT | NT | NT | NT | ||||||||
| 22404392 | 0.43 | NT | NT | NT | NT | NT | NT | NT | NT | ||||||||
| 16952991 | 0.72 | NT | NT | NT | NT | NT | NT | NT | NT | ||||||||
| 14723875 | 0.9 | NT | NT | NT | NT | NT | NT | NT | NT | ||||||||
| 845167 | 0.9 | Yes | Yes | Yes | Yes | Yes | Yes | Yes | Yes | Yes | Yes | Yes | Yes | Yes | Yes | Yes | Yes |
| 11532976 | 1.48 | NT | NT | NT | NT | NT | NT | NT | NT | ||||||||
| 24809205 | 1.51 | NT | NT | NT | NT | NT | NT | NT | NT | ||||||||
| 24814503 | 2.73 | NT | NT | NT | NT | NT | NT | NT | NT | ||||||||
| 14726526 | 2.76 | NT | NT | NT | NT | NT | NT | NT | NT | ||||||||
| 14730721 | 2.88 | NT | NT | NT | NT | NT | NT | NT | NT | ||||||||
| 24809506 | 3.11 | NT | NT | NT | NT | NT | NT | NT | NT | ||||||||
| 14742005 | 6.44 | NT | NT | NT | NT | NT | NT | NT | NT | ||||||||
| 847359 | 7.85 | No | No | Yes | Yes | NT | No | No | No | Yes | Yes | ||||||
| 17507336 | 9.42 | NT | NT | NT | NT | NT | NT | NT | NT | ||||||||
| 14719117 | 9.85 | NT | NT | NT | NT | NT | NT | NT | NT | ||||||||
| 17508465 | 11.77 | NT | NT | NT | NT | NT | NT | NT | NT | ||||||||
| 17511877 | 12.27 | NT | NT | NT | NT | NT | NT | NT | NT | ||||||||
| 17510947 | 12.5 | NT | NT | NT | NT | NT | NT | NT | NT | ||||||||
| 22405508 | 12.84 | NT | NT | NT | NT | NT | NT | NT | NT | ||||||||
| 24812833 | 12.87 | NT | NT | NT | NT | NT | NT | NT | NT | ||||||||
| 17510616 | 12.98 | NT | NT | NT | NT | NT | NT | NT | NT | ||||||||
| 14727791 | 18.44 | NT | NT | NT | NT | NT | NT | NT | NT | ||||||||
| 14742458 | 19.15 | NT | NT | NT | NT | NT | NT | NT | NT | ||||||||
| 17510946 | 23.26 | NT | NT | NT | NT | NT | NT | NT | NT | ||||||||
| 24813200 | 24.03 | NT | NT | NT | NT | NT | NT | NT | NT | ||||||||
| 14742370 | 26.04 | NT | NT | NT | NT | NT | NT | NT | NT | ||||||||
| 22400632 | 28.27 | NT | NT | NT | NT | NT | NT | NT | NT | ||||||||
| 857446 | 28.18 | No | No | No | IC | NT | No | No | No | ||||||||
| 17433753 | 34.04 | NT | NT | NT | NT | NT | NT | NT | NT | ||||||||
| 22412622 | 38.24 | NT | NT | NT | NT | NT | NT | NT | NT | ||||||||
| 17516177 | 39.24 | NT | NT | NT | NT | NT | NT | NT | NT | ||||||||
| 17513322 | 40.61 | NT | NT | NT | NT | NT | NT | NT | NT | ||||||||
| 17504835 | 40.9 | NT | NT | NT | NT | NT | NT | NT | NT | ||||||||
| 17505825 | 41.24 | NT | NT | NT | NT | NT | NT | NT | NT | ||||||||
| 24825938 | 45.23 | NT | NT | NT | NT | NT | NT | NT | NT | ||||||||
| 14742003 | 48.41 | NT | NT | NT | NT | NT | NT | NT | NT | ||||||||
We queried the PubChem database for the cross-target bioactivity profiles of the Redox Cycling Compounds (RCCs) against a subset of 8 targets that are known to be sensitive to oxidation: the protein tyrosine phosphatases (PTPs), mitogen-activated protein kinase phosphatase 1 (MKP-1) and 3 (MKP-3), cell division cycle 25 homolog B (Cdc25B); the cysteine proteases Cathepsin L, Cathepsin B, Caspase 1, and Caspase 7; and the heat shock protein 90 (Hsp90). The PubChem substance identifier (SID) number of each compound was used to query the PubChem database to determine if the compound had been tested in the specific target primary HTS assay, data accessed via the assay identifier (AID), if it was active in the primary screen, and if it had been confirmed active in a concentration-dependent assay. A designation of NT in the HTS activity column (HTS-active) indicates that the compound was not tested in the primary HTS. A compound that was tested and considered active in the primary screen was indicated by a Yes in the HTS activity column, and a compound that was tested and considered inactive in the primary screen was indicated by a No in the HTS activity column. A compound that was tested and considered inconclusive in the primary screen was indicated by an IC in the HTS activity column. Compounds that were confirmed active in a concentration-dependent assay were indicated with a Yes in the confirmed active (Conf. active) column. The RCC AC50 (μM) is the 50% effective concentration of activation of H2O2 generation in presence of 0.8 mM DTT for that PubChem-SID.
Abbreviations: AID, PubChem Assay Identifier; SID, PubChem Substance Identity Number.
Contributor Information
Karina M. Soares, Pittsburgh Molecular Library Screening Center, Drug Discovery Institute, School of Medicine, University of Pittsburgh, Pittsburgh, Pennsylvania.
Nicole Blackmon, Pittsburgh Molecular Library Screening Center, Drug Discovery Institute, School of Medicine, University of Pittsburgh, Pittsburgh, Pennsylvania..
Tong Ying Shun, Pittsburgh Molecular Library Screening Center, Drug Discovery Institute, School of Medicine, University of Pittsburgh, Pittsburgh, Pennsylvania..
Sunita N. Shinde, Pittsburgh Molecular Library Screening Center, Drug Discovery Institute, School of Medicine, University of Pittsburgh, Pittsburgh, Pennsylvania.
Harold K. Takyi, Pittsburgh Molecular Library Screening Center, Drug Discovery Institute, School of Medicine, University of Pittsburgh, Pittsburgh, Pennsylvania.
Peter Wipf, Pittsburgh Molecular Library Screening Center, Drug Discovery Institute, School of Medicine, University of Pittsburgh, Pittsburgh, Pennsylvania.; Department of Chemistry, School of Medicine, University of Pittsburgh, Pittsburgh, Pennsylvania.
John S. Lazo, Pittsburgh Molecular Library Screening Center, Drug Discovery Institute, School of Medicine, University of Pittsburgh, Pittsburgh, Pennsylvania. Department of Pharmacology and Chemical Biology, School of Medicine, University of Pittsburgh, Pittsburgh, Pennsylvania.
Paul A. Johnston, Pittsburgh Molecular Library Screening Center, Drug Discovery Institute, School of Medicine, University of Pittsburgh, Pittsburgh, Pennsylvania. Department of Pharmacology and Chemical Biology, School of Medicine, University of Pittsburgh, Pittsburgh, Pennsylvania.
REFERENCES
- 1.Bova MP, Mattson MN, Vasile S, Tam D, Holsinger L, Bremer M, et al. The oxidative mechanism of action of ortho-quinone inhibitors of protein-tyrosine phosphatase alpha is mediated by hydrogen peroxide. Arch Biochem Biophys. 2004;429:30–41. doi: 10.1016/j.abb.2004.05.010. [DOI] [PubMed] [Google Scholar]
- 2.Brisson M, Nguyen T, Wipf P, Joo B, Day BW, Skoko JS, et al. Redox regulation of Cdc25B by cell-active quinolinediones. Mol Pharmacol. 2005;68:1810–1820. doi: 10.1124/mol.105.016360. [DOI] [PubMed] [Google Scholar]
- 3.Johnston PA, Soares KM, Shinde SN, Foster CA, Shun TY, Takyi HK, et al. Development of a 384-well colorimetric assay to quantify hydrogen peroxide generated by the redox cycling of compounds in the presence of reducing agents. Assay Drug Dev Technol. 2008;6:505–518. doi: 10.1089/adt.2008.151. [DOI] [PMC free article] [PubMed] [Google Scholar]
- 4.Keinan S, Paquette WD, Skoko JJ, Beratan DN, Yang W, Shinde S, et al. Computational design, synthesis and biological evaluation of para-quinone-based inhibitors for redox regulation of the dual-specificity phosphatase Cdc25B. Org Biomol Chem. 2008;6:3256–3263. doi: 10.1039/b806712k. [DOI] [PMC free article] [PubMed] [Google Scholar]
- 5.Lal M, Rao R, Fang X, Schuchmann HP, Sonntag CV. Radical-Induced oxidation of dithiothreitol in acidic oxygenated solution: a chain reaction. J Am Chem Soc. 1997;119:5735–5739. [Google Scholar]
- 6.Lor LA, Schneck J, McNulty DE, Diaz E, Brandt M, Thrall SH, et al. A simple assay for detection of small-molecule redox activity. J Biomol Screen. 2007;12:881–890. doi: 10.1177/1087057107304113. [DOI] [PubMed] [Google Scholar]
- 7.Smith GK, Barrett DG, Blackburn K, Cory M, Dallas WS, Davis R, et al. Expression, preparation,,and high-throughput screening of caspase-8: discovery of redox-based and steroid diacid inhibition. Arch Biochem Biophys. 2002;399:195–205. doi: 10.1006/abbi.2002.2757. [DOI] [PubMed] [Google Scholar]
- 8.Lee K, Esselman WJ. Inhibition of PTPs by H2O2 regulates the activation of distinct MAPK pathways. Free Radic Biol Med. 2002;33:1121–1132. doi: 10.1016/s0891-5849(02)01000-6. [DOI] [PubMed] [Google Scholar]
- 9.Poljak A, Grant R, Austin CJ, Jamie JF, Willows RD, Takikawa O, et al. Inhibition of indoleamine 2,3 dioxygenase activity by H2O2. Arch Biochem Biophys. 2006;450:9–19. doi: 10.1016/j.abb.2006.03.003. [DOI] [PubMed] [Google Scholar]
- 10.Rhee S, Bae Y, Lee S, Kwon J. Hydrogen peroxide: a key messenger that modulates protein phosphorylation through cysteine oxidation. Sci STKE. 2000;53:PE1. doi: 10.1126/stke.2000.53.pe1. [DOI] [PubMed] [Google Scholar]
- 11.Rodriguez CE, Fukuto JM, Taguchi K, Froines J, Cho AK. The interactions of 9,10-phenanthrenequinone with glyceraldehyde-3-phosphate dehydrogenase (GAPDH), a potential site for toxic actions. Chem Biol Interact. 2005;155:97–110. doi: 10.1016/j.cbi.2005.05.002. [DOI] [PubMed] [Google Scholar]
- 12.Salmeen A, Andersen JN, Myers MP, Meng TC, Hinks JA, Tonks NK, et al. Redox regulation of protein tyrosine phosphatase 1B involves a sulphenyl-amide intermediate. Nature. 2003;423:769–773. doi: 10.1038/nature01680. [DOI] [PubMed] [Google Scholar]
- 13.Seth D, Rudolph J. Redox regulation of MAP kinase phosphatase 3. Biochemistry. 2006;45:8476–8487. doi: 10.1021/bi060157p. [DOI] [PubMed] [Google Scholar]
- 14.Song H, Bao S, Ramanadham S, Turk J. Effects of biological oxidants on the catalytic activity and structure of group VIA phospholipase A2. Biochemistry. 2006;45:6392–6406. doi: 10.1021/bi060502a. [DOI] [PMC free article] [PubMed] [Google Scholar]
- 15.Johnston PA, Foster CA, Shun TY, Skoko JJ, Shinde S, Wipf P, et al. Development and implementation of a 384-well homogeneous fluorescence intensity high-throughput screening assay to identify mitogen-activated protein kinase phosphatase-1 dual-specificity protein phosphatase inhibitors. Assay Drug Dev Technol. 2007;5:319–332. doi: 10.1089/adt.2007.066. [DOI] [PubMed] [Google Scholar]
- 16.Tierno MB, Johnston PA, Foster C, Skoko JJ, Shinde SN, Shun TY, et al. Development and optimization of high-throughput in vitro protein phosphatase screening assays. Nat Protoc. 2007;2:1134–1144. doi: 10.1038/nprot.2007.155. [DOI] [PubMed] [Google Scholar]
- 17.Austin CP, Brady LS, Insel TR, Collins FS. NIH Molecular Libraries Initiative. Science. 2004;306:1138–1139. doi: 10.1126/science.1105511. [DOI] [PubMed] [Google Scholar]
- 18.Lazo JS. Roadmap or roadkill: a pharmacologist’s analysis of the NIH Molecular Libraries Initiative. Mol Interv. 2006;6:240–243. doi: 10.1124/mi.6.5.1. [DOI] [PubMed] [Google Scholar]
- 19.Lazo JS, Brady LS, Dingledine R. Building a pharmacological lexicon: small molecule discovery in academia. Mol Pharmacol. 2007;72:1–7. doi: 10.1124/mol.107.035113. [DOI] [PubMed] [Google Scholar]
- 20.Johnston PA, Phillips J, Shun TY, Shinde S, Lazo JS, Huryn DM, et al. HTS identifies novel and specific uncompetitive inhibitors of the two-component NS2B-NS3 proteinase of West Nile virus. Assay Drug Dev Technol. 2007;5:737–750. doi: 10.1089/adt.2007.101. [DOI] [PubMed] [Google Scholar]
- 21.Sharlow ER, Leimgruber S, Shun TY, Lazo JS. Development and implementation of a miniaturized high-throughput time-resolved fluorescence energy transfer assay to identify small molecule inhibitors of polo-like kinase 1. Assay Drug Dev Technol. 2007;5:723–735. doi: 10.1089/adt.2007.102. [DOI] [PMC free article] [PubMed] [Google Scholar]
- 22.Inglese J, Johnson RL, Simeonov A, Xia M, Zheng W, Austin CP, et al. High-throughput screening assays for the identification of chemical probes. Nat Chem Biol. 2007;3:466–479. doi: 10.1038/nchembio.2007.17. [DOI] [PubMed] [Google Scholar]
- 23.Sharlow ER, Giridhar KV, LaValle CR, Chen J, Leimgruber S, Barrett R, et al. Potent and selective disruption of protein kinase D functionality by a benzoxoloazepinolone. J Biol Chem. 2008;283:33516–33526. doi: 10.1074/jbc.M805358200. [DOI] [PMC free article] [PubMed] [Google Scholar]
- 24.Arnold DM, Foster C, Huryn DM, Lazo JS, Johnston PA, Wipf P. Synthesis and biological activity of a focused library of mitogen-activated protein kinase phosphatase inhibitors. Chem Biol Drug Des. 2007;69:23–30. doi: 10.1111/j.1747-0285.2007.00474.x. [DOI] [PubMed] [Google Scholar]
- 25.Pick E, Keisari Y. A simple colorimetric method for the measurement of hydrogen peroxide produced by cells in culture. J Immunol Methods. 1980;38:161–170. doi: 10.1016/0022-1759(80)90340-3. [DOI] [PubMed] [Google Scholar]
- 26.Guo J, Parise RA, Joseph E, Lan J, Pan SS, Joo B, et al. Pharmacology and antitumor activity of a quinolinedione Cdc25 phosphatase inhibitor DA3003-1 (NSC 663284) Anticancer Res. 2007;27:3067–3073. [PubMed] [Google Scholar]
- 27.Johnston PA, Foster CA, Tierno MB, Shun TY, Shinde SN, Paquette WD, et al. Cdc25B dual-specificity phosphatase inhibitors identified in a high-throughput screen of the NIH compound library. Assay Drug Dev Technol. 2009;7:250–265. doi: 10.1089/adt.2008.186. [DOI] [PMC free article] [PubMed] [Google Scholar]
- 28.Bembenek ME, Kuhn E, Mallender WD, Pullen L, Li P, Parsons T. A fluorescence-based coupling reaction for monitoring the activity of recombinant human NAD synthetase. Assay Drug Dev Technol. 2005;3:533–541. doi: 10.1089/adt.2005.3.533. [DOI] [PubMed] [Google Scholar]
- 29.Riss TL, Moravec RA. Use of multiple assay endpoints to investigate the effects of incubation time, dose of toxin, and plating density in cell-based cytotoxicity assays. Assay Drug Dev Technol. 2004;2:51–62. doi: 10.1089/154065804322966315. [DOI] [PubMed] [Google Scholar]
- 30.Auld D, Simeonov A, Thomas C. Literature search and review. Assay Drug Dev Technol. 2008;6:621–622. doi: 10.1089/adt.2011.0903.lr. [DOI] [PubMed] [Google Scholar]
- 31.Yi F, Regan L. A novel class of small molecule inhibitors of Hsp90. ACS Chem Biol. 2008;3:645–654. doi: 10.1021/cb800162x. [DOI] [PMC free article] [PubMed] [Google Scholar]
- 32.Yi F, Zhu P, Southall N, Inglese J, Austin CP, Zheng W, et al. An AlphaScreen-based high-throughput screen to identify inhibitors of Hsp90-cochaperone interaction. J Biomol Screen. 2009;14:273–281. doi: 10.1177/1087057108330114. [DOI] [PMC free article] [PubMed] [Google Scholar]
- 33.Fernández Villamil S, Stoppani AO, Dubin M. Redox cycling of beta-lapachone and structural analogues in microsomal and cytosol liver preparations. Meth Enzymol. 2004;378:67–87. doi: 10.1016/S0076-6879(04)78004-0. [DOI] [PubMed] [Google Scholar]
- 34.Li Y, Sun X, LaMont JT, Pardee AB, Li CJ. Selective killing of cancer cells by beta -lapachone: direct checkpoint activation as a strategy against cancer. Proc Natl Acad Sci USA. 2003;100:2674–2678. doi: 10.1073/pnas.0538044100. [DOI] [PMC free article] [PubMed] [Google Scholar]
- 35.Lazo JS, Nemoto K, Pestell KE, Cooley K, Southwick EC, Mitchell DA, et al. Identification of a potent and selective pharmacophore for Cdc25 dual specificity phosphatase inhibitors. Mol Pharmacol. 2002;61:720–728. doi: 10.1124/mol.61.4.720. [DOI] [PubMed] [Google Scholar]
- 36.Peyregne VP, Kar S, Ham SW, Wang M, Wang Z, Carr BI. Novel hydroxyl naphthoquinones with potent Cdc25 antagonizing and growth inhibitory properties. Mol Cancer Ther. 2005;4:595–602. doi: 10.1158/1535-7163.MCT-04-0274. [DOI] [PubMed] [Google Scholar]
- 37.Bolton JL, Trush MA, Penning TM, Dryhurst G, Monks TJ. Role of quinones in toxicology. Chem Res Toxicol. 2000;13:135–160. doi: 10.1021/tx9902082. [DOI] [PubMed] [Google Scholar]
- 38.Fernández Villamil S, Stoppani AO, Dubin M. Redox cycling of beta-lapachone and structural analogues in microsomal and cytosol liver preparations. Meth Enzymol. 2004;378:67–87. doi: 10.1016/S0076-6879(04)78004-0. [DOI] [PubMed] [Google Scholar]
- 39.Begleiter A. Clinical applications of quinone-containing alkylating agents. Front Biosci. 2000;5:E153–E171. doi: 10.2741/begleit. [DOI] [PubMed] [Google Scholar]
- 40.Scozzafava A, Owa T, Mastrolorenzo A, Supuran CT. Anticancer and antiviral sulfonamides. Curr Med Chem. 2003;10:925–953. doi: 10.2174/0929867033457647. [DOI] [PubMed] [Google Scholar]
- 41.Supuran CT, Scozzafava A. Carbonic anhydrases as targets for medicinal chemistry. Bioorg Med Chem. 2007;15:4336–4350. doi: 10.1016/j.bmc.2007.04.020. [DOI] [PubMed] [Google Scholar]
- 42.Winum JY, Scozzafava A, Montero JL, Supuran CT. Therapeutic potential of sulfamides as enzyme inhibitors. Med Res Rev. 2006;26:767–792. doi: 10.1002/med.20068. [DOI] [PubMed] [Google Scholar]
- 43.Rhee SG. Cell signaling. H2O2, a necessary evil for cell signaling. Science. 2006;312:1882–1883. doi: 10.1126/science.1130481. [DOI] [PubMed] [Google Scholar]
- 44.Rhee SG, Chang TS, Bae YS, Lee SR, Kang SW. Cellular regulation by hydrogen peroxide. J Am Soc Nephrol. 2003;14:S211–S215. doi: 10.1097/01.asn.0000077404.45564.7e. [DOI] [PubMed] [Google Scholar]