

Abstract
Rex1 (zfp42) is a zinc finger protein expressed primarily in undifferentiated stem cells, both in the embryo and the adult. Upon all-trans retinoic acid induced differentiation of murine embryonic stem (ES) cells, Rex1 mRNA levels decrease several fold. To characterize the function(s) of Rex1 more extensively, we generated Rex1 double knockout ES cell lines. The disruption of the Rex1 gene enhanced the expression of ectoderm, mesoderm and endoderm markers as compared to wild type (Wt) cells. We propose that Rex1 acts to reduce retinoic acid induced differentiation in ES cells. We performed microarray analyses on Wt and Rex1−/− cells cultured in the presence or absence of LIF to identify potential Rex1 targets. We also evaluated gene expression in a Wt line that overexpresses Rex1 and in a Rex1−/− line in which Rex1 expression was restored. These data, taken together, suggest that Rex1 influences differentiation, cell cycle regulation and cancer progression.
Keywords: cell cycle regulation, cancer, differentiation, embryoid body, embryonic stem cell, knockout, leukemia inhibitory factor, microarray, retinoic acid, Rex1
INTRODUCTION
Murine embryonic stem (ES)cells are undifferentiated cells derived from the inner cell mass of the mouse blastocyst (Evans and Kaufman, 1981; Martin, 1981). They are able to maintain this undifferentiated state through their ability to self-renew upon division. ES cells are also pluripotent; they are able to differentiate into cell types derived from the three primary germ layers: endoderm, ectoderm and mesoderm (Doetschman et al., 1985). ES cell differentiation in cell culture mimics that of the intact blastocyst (Martin, 1981). Thus, ES cells are a useful model to investigate the processes of embryogenesis and differentiation.
Mouse ES cells remain undifferentiated when cultured in media containing serum and leukemia inhibitory factor (LIF), a cytokine (Williams et al., 1988; Zandstra et al., 2000,Kashyap et al., submitted). LIF also allows the propagation of ES cells without feeder cells (Zandstra et al., 2000). In the absence of LIF, ES cells can be induced to differentiate into germ line derivatives (Williams et al., 1988; Robertson, 1991). ES cells also differentiate in the presence of all-trans retinoic acid (RA), a metabolite of vitamin A (retinol) (Gudas, 1994; Rohwedel et al., 1999). RA is a ligand for the retinoic acid receptors (RARs), encoded by the genes RARα, RARβ and RARγ (Crettaz et al., 1990; Kastner et al., 1990). The actions of RA are generally mediated by these receptors (Kastner et al., 1990; Mangelsdorf and Evans, 1995; Mongan and Gudas, 2007). We have also shown that RA mediates ES cell differentiation, in part, by indirectly attenuating LIF-induced Stat3 activation (Tighe and Gudas, 2004).
Rex1 (zfp42) is a zinc finger transcription factor discovered in this laboratory (Hosler et al., 1989). The gene was initially identified as a result of the reduction in its expression upon RA treatment (Hosler et al., 1989). Rex1 encodes an acidic zinc-finger protein containing four Cys-His motifs (Hosler et al., 1989). It is a protein with significant similarity to the YY1 transcription factor family in the zinc finger domains (Mongan et al., 2006). In addition to its expression in ES cells (Chen and Gudas, 1996), Rex1 mRNA is expressed in F9 teratocarcinoma stem cells (Hosler et al., 1989) and in the germ cells of the testis (Rogers et al., 1991). We have recently detected Rex1 mRNA and protein expression in several types of adult human cells (Mongan et al., 2006; Raman et al., 2006). Research in this laboratory and others has shown that the Rex1 promoter contains a binding site for Oct4 (Rosfjord and Rizzino, 1994; Ben-Shushan et al., 1998). Interestingly, Oct4 can activate or repress Rex1 transcription; this action is dependent on the levels of Oct4 (Hosler et al., 1993; Ben-Shushan et al., 1998). Recent research has elucidated roles for Nanog and Sox2 in Rex1 transactivation (Shi et al., 2006). We have also demonstrated that Rex1 mRNA levels decrease in response to the initiation of differentiation, independent of the presence of RA (Rogers et al., 1991).
Rex1 is now widely used as a stem cell marker (Jiang et al., 2002; Brivanlou et al., 2003; Goolsby et al., 2003; D’Ippolito et al., 2004). We previously disrupted both alleles of the Rex1 gene in F9 teratocarcinoma stem cells, resulting in impaired differentiation into visceral endoderm (Thompson and Gudas, 2002). This and other research (Shi et al., 2006; Wang et al., 2006; Zhang et al., 2006b) support the hypothesis that the Rex1 protein plays a crucial role in ES cell differentiation. In an effort to characterize the function(s) of Rex1 more extensively, we have now disrupted both alleles of Rex1 in J1 murine ES cells by two rounds of homologous recombination. We have also generated Rex1 overexpressing ES cells. Further, we have performed gene expression microarray analyses to identify potential Rex1 target genes.
RESULTS
Establishment of Rex1−/− murine ES cell lines
In order to elucidate the functions of Rex1 in ES cells, homologous recombination techniques were used to generate ES cell lines in which both alleles of the Rex1 gene were disrupted. The previously described pDISREX Rex1 disruption vector (Thompson and Gudas, 2002) was utilized to disrupt both allelic copies of the Rex1 gene via insertion of a hygromycin resistance cassette (Fig 1A). ES cells were transfected with this construct and cells in which both alleles of Rex1 were disrupted were generated as described in “Experimental Procedures”. Digestion of these cells with BclI produced a 9.8 kilobase (kb) fragment, as seen in the previously generated F9 Rex1−/− cells (Thompson and Gudas, 2002), here used as a positive control (Fig. 1B). Digestion of the Wt alleles resulted in a single band at 8 kb (Fig. 1B). In order to demonstrate that the disruption of the Rex1 gene resulted in a lack of Rex1 transcripts in these cells, northern blot analysis was performed using a Rex1 cDNA probe (Fig. 1C). Rex1 mRNA was absent in lines 11 and 16 (Fig. 1C). Cell line 11 was cultured as single cell colonies to establish RS Rex1−/− - 11.1, 11.2, 11.3 and 11.4. RT-PCR, using primers specific for Rex1, was utilized to demonstrate the lack of Rex1 mRNA in RS Rex1−/− 11.4 and RS Rex1−/−16 (Fig. 1D). These two independently derived Rex1 knockout lines, Rex1−/− 11.4 and Rex1−/− 16 as well as RS Rex1−/− 11.2, were chosen for study in subsequent experiments.
Figure 1. Generation of Rex1−/− and Rex1 overexpressingES cells.

A. Schematic adapted from Thompson and Gudas, 2002. The top diagram depicts endogenous Rex1. The Rex1 coding sequence is located within exon 4. The double arrowed lines indicate the expected size of hybridizing fragments when cut with Bcl I. The bottom diagram shows the Rex1 deletion vector in which the hygromycin resistance gene has been inserted, creating a 100 base pair deletion in Rex1. The middle diagram shows the disrupted Rex1 locus. B. Southern analysis of Rex1−/− ES cell lines. Ten μg of DNA from each G418-resistant clone was cut with Bcl I. Products of the digest were separated on a 1% agarose gel, transferred to nylon and probed with a 1.4 kb radiolabeled Rex1. Lanes labeled with an asterisk indicate Rex1 knockout clones. C. Northern analysis of Rex1−/− ES cell lines. Cells were harvested and RNA isolation was performed. Ten μg of RNA from each sample was loaded on agarose gels, transferred to nylon and probed for Rex1 mRNA. D. RT-PCR was performed on 5μg of total RNA. Wt RNA produces a 453 bp Rex1 fragment. 36B4 is used as a loading control. For sequences used see Supplemental Table 1. E. RT-PCR analysis of Rex1 overexpressing cell lines. RT-PCR was performed on 5μg of total RNA. Wt RNA produces a 453 bp Rex1 fragment. 36B4 is used as a loading control. F. RT-PCR analysis of Rex1 overexpressing and Rex1 restoration cell lines. RT-PCR was performed on 5μg of total RNA. Wt RNA produces a 453 bp Rex1 fragment and exogenous Rex1 primers produce a 403 bp fragment. See Experimental Procedures for primer information. 36B4 is used as a loading control. G. Western blot analysis of Rex1−/− and Rex1 overexpressing and Rex1 restoration ES cell lines. Whole cell extracts (100 μg) were loaded onto SDS-PAGE gels. Actin (43 kDa) was used as a loading control.
Two independent Rex1 overexpressing cell lines, D4 and D6, were also generated (Fig. 1E). Unlike Wt cells, these gain of function cell lines maintained Rex1 expression even in culture in the absence of LIF (Fig. 1E). Quantitative RT-PCR experiments revealed that Rex1 mRNA levels were 2.0 fold higher in D4 and 2.3 fold higher in D6 than in Wt cells cultured in the presence of LIF (data not shown). Rex1−/− 11.4 cells were transfected with a plasmid containing full-length Rex1 cDNA to generate a Rex1 restoration cell line. This cell line, Rex1−/− Rex1R 10, displayed Rex1 transcript levels that were comparable to Wt. Primers designed to identify exogenous Rex1 confirmed the presence of the transgene in these cells and its absence in Wt cells (Fig. 1F). The Rex1 overexpressing cell line D6 and Rex1 restoration line 10 were used in subsequent experiments.
As further validation of the Rex1 null and Rex1 gain-of-function cell lines, western blot analysis was performed to investigate Rex1 protein expression (Fig.1G). The apparent molecular weight as determined by gel electrophoresis is similar to the calculated molecular weight of 37 kDa. RS Rex1−/− 11.4 cells displayed no Rex1 protein, D6 Rex1 overexpressing cells displayed higher Rex1 protein levels than Wt, and Rex1−/− Rex1 restoration line 10 had levels comparable to Wt (Fig.1G).
Characterization of the Rex1−/− ES cells
As an initial characterization, the RS Rex1−/− ES cell line 16 and the 11.2 and 11.4 sub-lines were cultured in monolayer and examined to investigate gross morphological changes in these cells as compared to the Wt parental ES cell line; none was observed. RS Rex1−/− 11.4 and 16 cells were subsequently subjected to the Fast Red assay (Paling et al., 2004), in which the presence of alkaline phosphatase identifies undifferentiated cells (Fig. 2). The Rex1−/− cell lines remained undifferentiated when cultured in ES cell-conditioned media supplemented with leukemia inhibitory factor (LIF). The intensity of alkaline phosphatase staining was quantified by measuring optical density using a NIKON TE2000 microscope (see Experimental Procedures). Wt, Rex1−/− 11.4 and 16 cell lines and the D6 Rex1 overexpressing cell line showed similar levels of alkaline phosphatase staining (Fig. 2). Differentiated human prostate epithelial cells (Lonza) were used as a negative control. They show no alkaline phosphatase staining (Fig. 2).
Figure 2. Determining the differentiation state of Rex1−/− ES cells.
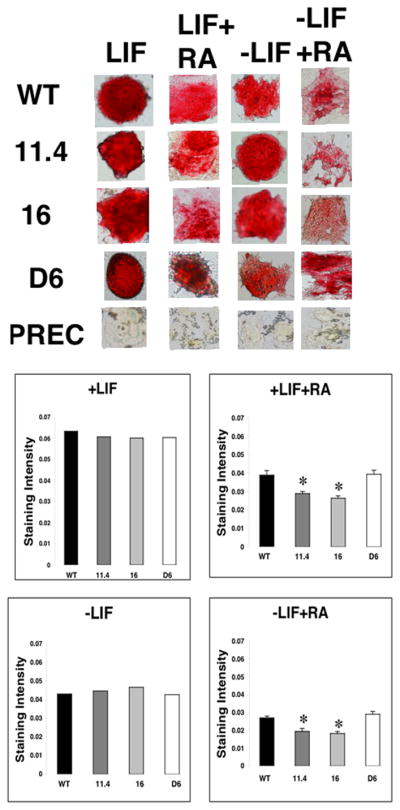
Cells were cultured in tissue culture dishes for 72 hrs, fixed with 3.7% formaldehyde and stained for alkaline phosphatase expression. A. Wt, Rex1−/− and Rex1 overexpressing cells cultured plus LIF. B. Cells cultured plus LIF and RA. C. Cells cultured minus LIF. D. Cells cultured minus LIF plus RA. Asterisks indicate significance where p < 0.05.
To examine differentiation at the molecular level, the mRNA levels of the stem cell markers Oct4, Nanog and Sox2 (Boyer et al., 2005) were measured using quantitative RT-PCR (Fig. 3A). For all three genes transcript levels were similar in the RS Rex1−/− 11.4 and 16 ES cell lines as compared to Wt. Similar results were obtained for the D6 Rex1 overexpression cell line (Fig. 3A).
Figure 3. Stem cell marker levels.

A. Cells were cultured in media supplemented with LIF. B. Cells were cultured in media supplemented with LIF and 0.05μM RA for 72 hours. Real time RT-PCR was performed on 5 μg of total RNA to investigate expression of the stem cell markers Oct4, Nanog and Sox2. RNA expression levels of Wt, RS Rex1−/− and Rex1 overexpressing cells were normalized to 36B4 RNA levels. The data are shown as fold increases in mRNA levels relative to 36B4 mRNA levels at each condition. Asterisks indicate significance where one asterisk = p < 0.05, two asterisks = p < 0.02. C. Cells were cultured in media supplemented with LIF and 0.05μM RA for 48 hours. Western blot analysis was performed on whole cell extracts to investigate Oct4 and Sox2 expression. ES cell lysates were used as a positive control and NIH3T3 as a negative control. 1/10 of the amount of ES cell lysates were loaded to confirm linearity. Experiments were performed at least three times using independent RNA or protein preparations with similar results.
To investigate the ability of these Rex1−/− ES cells to maintain their undifferentiated state, cells were cultured in the absence of LIF (Fig. 2) or in the presence of RA with or without LIF (Fig. 2) to induce differentiation. ES cells undergo differentiation when cultured in the presence of LIF and 1 μM RA (Chen and Gudas, 1996). After 72 hours, RS Rex1−/− 11.4 and 16 cells were more differentiated than Wt cells, as determined by alkaline phosphatase production (Fig. 2). RS Rex1−/− 11.4 and 16 ES cell lines demonstrated a 1.4 fold decrease in staining intensity as compared to Wt cells (Fig. 2). However, when cultured in the absence of LIF, the level of cell differentiation was comparable in all three cell lines (Fig. 2). There was a 1.5 fold reduction in alkaline phosphatase production by RS Rex1−/− 11.4 and 16 cells as compared to Wt cells when these cells were cultured in the absence of LIF and the presence of 1 μM RA (Fig. 2). In contrast, alkaline phosphatase staining was increased by 1.0 fold in the D6 Rex1 overexpression line cultured in the presence of LIF and RA and 1.1 fold in the D6 line cultured in the absence of LIF plus RA, as compared to Wt cells.
These results were confirmed by an investigation of the transcript levels of Oct4, Nanog and Sox2 upon culturing cells in RA (Fig. 3B). Oct4 mRNA levels in the RS Rex1−/− 11.4 cells were 1.7 fold lower than in Wt cells after culture in RA. Nanog mRNA levels were 1.3 fold lower and Sox2 mRNA levels were 1.2 fold lower in RS Rex1−/− 11.4 cells as compared to Wt cells. Western blot analysis confirmed that Oct4 and Sox2 protein levels decreased in Rex1−/− 11.4 cells cultured in RA as compared to Wt, while protein levels in the D6 Rex1 overexpressing line remained unchanged (Fig. 3C).
To investigate further the effects of RA on these cells, their ability to differentiate into cells of each of the three germ layers was examined (Fig. 4). Monolayer cultures of cells in media supplemented with LIF were treated with 0.05μM, 0.5μM and 5μM RA for seventy-two hours. Cells were then harvested, RNA was isolated, and RT-PCR was performed. Upon RA treatment, ES cells differentiate along the ectodermal, mesodermal and endodermal lineages (Keller, 2005) The mRNA levels of the ectodermal marker Fgf5, the mesodermal marker Brachyury, and the endodermal marker Gata6 were increased in RS Rex1−/− 11.2 and 11.4 cells as compared to Wt cultured in the presence of RA (Fig. 4A). The capacity of the Rex1−/− 11.4 and the D6 Rex1 overexpressing ES cell lines to differentiate along these lineages was ascertained further by performing quantitative RT-PCR to measure the expression of Nestin, a marker of ectoderm (Kawasaki et al., 2000), PDGFRα, a marker of mesoderm (Ataliotis et al., 1995) and LamB1, a marker of endoderm (Keller, 1995; Chen and Gudas, 1996; Darr et al., 2006). In the absence of RA, transcripts of these genes were similar in the RS Rex1−/− 11.4 cells as compared to Wt. Wt cells showed an increase in Nestin (Fig. 4B), PDGFRα (Fig. 4C) and LamB1 (Fig. 4D) mRNA levels with increasing concentrations of RA. However, the transcript levels of these genes were even higher in RS Rex1−/− 11.4 cells. Following culture with 0.05μM RA, and again upon culture with 0.5μM and 5μM RA, Nestin, PDGFRα and LamB1 mRNA levels were increased in RS Rex1−/− 11.4 cells as compared to Wt (Fig. 4). Transcript levels of these genes in the D6 Rex1 overexpressing cell line were lower than those in Wt at all concentrations of RA (Fig. 4). These results were confirmed at the protein level (Fig. 4E). The expression of the ectodermal marker Pax6, the mesodermal marker Brachyury, and the endodermal marker Gata4 was increased in Rex1−/− 11.4 cells and decreased in D6 Rex1 overexpressing cells as compared to Wt.
Figure 4. Induction of cell differentiation upon RA treatment.

Cells were cultured in media supplemented with LIF and various concentrations of RA for 72 hours. (A) RNA was isolated and RT-PCR was performed on 5μg of total RNA to investigate expression of Fgf5, Brachyury and Gata6. (B–D) Real Time (Quantitative) RT-PCR was performed on 5μg of total RNA. mRNA levels of markers of cell differentiation (B) Nestin, (C) PDGFRα and (D) LamB1 were analyzed. RNA expression levels of Wt, RS Rex1−/− and Rex1 overexpressing cells were normalized to 36B4 RNA levels. Asterisks indicate significance where p < 0.05. E. Western blot analysis of Rex1−/− and Rex1 overexpressing ES cell lines. Whole cell extracts (100 μg) were loaded onto SDS-PAGE gels and probed for Pax6, Brachyury and Gata4 expression. Actin was used as a loading control. Experiments were performed at least three times using independent RNA or protein preparations with similar results.
In order to investigate further the differentiation of these cell lines, the RS Rex1−/− 11.4 and 16 cell lines and the D6 Rex1 overexpressing line were also cultured as embryoid bodies. There were no detectable morphological differences in these cells as compared to Wt (data not shown). However, Pax6, Brachyury and Gata4 protein levels were increased in Rex1−/− 11.4 cells, and decreased in D6 cells as compared to Wt at both 4 days and 8 days of culture in the presence of RA by Western analysis (Fig. 5).
Figure 5. Embryoid body differentiation.

Western blot analysis of Rex1−/− and Rex1 overexpressing ES cell lines. Embryoid body extracts (100 μg) were loaded onto SDS-PAGE gels and probed for Pax6, Brachyury and Gata4 expression. Actin was used as a loading control. ES cells cultured in the presence of RA were used as a positive control with 1/10 of the amount loaded to confirm linearity. Undifferentiated ES cells were used as negative control. This experiment was performed at least three times starting with cultured cells with similar results from all experiments.
An analysis of the ability of RA to inhibit growth in Rex1−/− ES cells was also performed. The RS Rex1−/− 11.4 and 16 cell lines exhibited similar growth rates as compared to Wt cells cultured in the absence of RA (Fig. 6A, B). On addition of RA (Fig 6C, D), all cell lines showed growth arrest. However, by day four cells cultured in the presence of LIF and RA showed 78% ± 2% (RS Rex1−/− 11.4 cells, p-value 0.03) and 73% ± 4% (RS Rex1−/− 16 cells, p-value 0.03) of the level of Wt cells (Fig. 6C). In contrast, the D6 Rex1 overexpressing cell line had 115 ± 3% as many cells as the Wt cells. The RS Rex1−/− 11.4 and 16cell lines cultured in the absence of LIF and presence of RA (Fig. 6D), had 70% ± 5% (RS Rex1−/− 11.4 cells, p-value 0.04) and 68% ± 5% (RS Rex1−/− 16 cells, p-value 0.04) as many cells as Wt by day three. In contrast, by day 4 of culture, the number of D6 Rex1 overexpressing cells was 133 ± 5% (p-value 0.02) of Wt, set at 100%.
Figure 6. Cell proliferation in the presence or absence of LIF and RA.

1.2 × 10⁶ cells per well were cultured in the presence or absence of LIF and RA for four days. Cells were counted each day. A. Wt, Rex1−/− 11.4 and 16 and Rex1 overexpressing cells were cultured supplemented with LIF. B. Wt, Rex1−/− 11.4 and 16and Rex1 overexpressing cells were cultured supplemented with LIF and RA. C. Wt, Rex1−/− 11.4 and 16and Rex1 overexpressing cells were cultured in the absence of LIF. D. Wt, Rex1−/− 11.4 and 16 and Rex1 overexpressing cells were cultured in the absence of LIF and supplemented with RA. Asterisks indicate significance where p < 0.05.
Elucidating Rex1 functions using gene microarray analysis
Since the functions of the Rex1 protein are not well understood, microarray analysis was utilized to identify putative Rex1 target genes and to determine potential roles for Rex1 in cellular activities. In these experiments transcript levels in the RS Rex1−/− 11.4 cell line were compared to those in Wt cells cultured in monolayer in the presence or absence of LIF. Total RNA was obtained from each sample and treated as described under “ Experimental Procedures”. The resulting data were imported into the GeneSpring GX version 7.3.1 software program (Redwood, CA) for analysis.
In order to identify genes that were differentially expressed in Wt cells versus the RS Rex1−/−11.4 ES cell line, the data were subjected to several filtering steps as described in “ Experimental Procedures”. The Student’s t-test and one-way ANOVA analysis were performed to identify only those genes whose expression differences were statistically significant (p< 0.05). These genes were also filtered by fold change such that genes whose expression differed by at least two-fold in Wt vs. the RS Rex1−/− 11.4 cell line were chosen for further analysis.
A total of 234 genes were increased or decreased in Wt vs. the RS Rex1−/− 11.4 cell line cultured in the presence of LIF, while 136 genes were differentially expressed in the absence of LIF. Selected genes in Wt that are increased or decreased relative to the RS Rex1−/− 11.4 cell line for each condition are shown (Tables 1,2).
Table 1.
Rex-1 associated genes in the mES cells identified using Affymetrix mouse 430 2.0 gene chips. Wt cells and 11.4 Rex-1 −/− cells were cultured in the presence of LIF. Only those genes with at least a 2.0 fold change in Wt cells relative to 11.4 Rex-1 −/− cells with p values ≤ 0.05 are shown. Fold change= Wt/11.4 Rex-1 −/−.
| I: Genes most increased in Wt ES cells/RS 11.4 Rex1−/− cells in the presence of LIF. | ||||
|---|---|---|---|---|
| Affymetrix ID | Fold Change | Common Name | GenBank ID | Affymetrix Gene Title |
| 1427640_a_at | 11.7 | Cbfa2t1h | X79989 | CBFA2T1 gene homolog (human) |
| 1422168_a_at | 11.5 | Bdnf | AY057913 | brain derived neurotrophic factor |
| 1417917_at | 8.9 | Cnn1 | NM_009922 | calponin 1 |
| 1423669_at | 6.3 | Col1a1 a | U08020 | procollagen, type I, alpha 1 |
| 1416124_at | 6.228 | Ccnd2 | NM_009829 | cyclin D2 |
| 1453957_a_at | 6.1 | Igf2bp3 | AK011797 | insulin-like growth factor 2, binding protein 3 |
| 1441852_x_at | 5.9 | Apg16l | BB038346 | APG16 autophagy 16-like (S. cerevisiae) |
| 1435989_x_at | 5.7 | Krt2-8 | AW322280 | keratin complex 2, basic, gene 8 |
| 1449152_at | 5.7 | Cdkn2b | AF059567 | cyclin-dependent kinase inhibitor 2B |
| 1437540_at | 5.3 | Mcoln3 | AV313762 | mucolipin 3 |
| 1448487_at | 5.0 | Lrrfip1 | NM_008515 | leucine rich repeat (in FLII) interacting protein 1 |
| 1423760_at | 5.0 | Cd44 | M27130 | CD44 antigen |
| 1435906_x_at | 4.9 | Gbp2 | BE197524 | guanylate nucleotide binding protein 2 |
| II: Genes most decreased in Wt ES cells/RS 11.4 Rex1−/− cells in the presence of LIF | ||||
|---|---|---|---|---|
| Affymetrix ID | Fold Change | Common Name | GenBank ID | Affymetrix Gene Title |
| 1427862_at | 0.169 | Arl6ip3 | AF133910 | ARL 6 interacting protein 3 |
| 1451043_at | 0.198 | Nek6 | BB528391 | NIMA -related expressed kinase 6 |
| 1439204_at | 0.199 | Scn3a | BB096886 | RIKEN clone:C130058B11 |
| 1457183_at | 0.21 | Slc6a1 | BB546734 | solute carrier family 6, member 1 |
| 1448397_at | 0.214 | Gjb6 | BC016507 | Gap junction membrane channel protein beta 6 |
| 1452900_at | 0.24 | Dgcr6 | AK019346 | DiGeorge syndrome critical region gene 6 |
| 1423020_at | 0.243 | Hspe1 | NM_053120 | hypothetical gene |
| 1460609_at | 0.243 | Ccne2 | BB224305 | cyclin E2 |
| 1421990_at | 0.244 | Syt1 | NM_009306 | synaptotagmin 1 |
Genes in bold are differentially expressed in both the presence and absence of LIF.
Table 2.
Rex-1 associated genes in the mES cells identified using Affymetrix mouse 430.2 gene chips. Wt cells and 11.4 Rex-1 −/− cells were cultured in the absence of LIF. Only those genes with at least a 2.0 fold change in Wt cells relative to 11.4 Rex-1 −/− cells with p values ≤ 0.05 are shown. Fold change= Wt / 11.4 Rex-1 −/−.
| I: Genes most increased in Wt ES cells /RS 11.4 Rex1−/− cells in the absence of LIF. | ||||
|---|---|---|---|---|
| Affymetrix ID | Fold Change | Common Name | GenBank ID | Affymetrix Gene Title |
| 1452483_a_at | 17.6 | Cd44 a | X66083 | CD44 antigen |
| 1448594_at | 7.9 | Wisp1 | NM_018865 | WNT1 inducible signaling pathway protein 1 |
| 1427602_at | 7.0 | Dep1 | BB626684 | RIKEN clone:9430014N24 |
| 1420683_at | 6.6 | Bnipl | NM_134253 | BCL2/adenovirus E1B interacting protein like |
| 1423505_at | 6.5 | Tagln | BB114067 | transgelin |
| 1455627_at | 6.4 | Col8a1 | AV292255 | RIKEN clone:5430419M07 |
| 1423669_at | 5.3 | Col1a1 | U08020 | procollagen, type I, alpha 1 |
| 1437247_at | 4.8 | Fosl2 | BM245170 | fos-like antigen 2 |
| 1434298_at | 4.4 | Zfhx1b | BQ174116 | zinc finger homeobox 1b |
| 1418240_at | 4.1 | Gbp2 | NM_010260 | guanylate nucleotide binding protein 2 |
| 1423110_at | 4.0 | Col1a2 | BF227507 | procollagen, type I, alpha 2 |
| 1415871_at | 3.9 | Tgfbi | NM_009369 | transforming growth factor, beta induced |
| II: Genes most decreased in Wt ES cells/RS 11.4 Rex1−/− cells in the absence of LIF | ||||
|---|---|---|---|---|
| Affymetrix ID | Fold Change | Common Name | GenBank ID | Affymetrix Gene Title |
| 1420262_at | 0.102 | Acly | AV291437 | |
| 1459089_at | 0.138 | Ccne2 | BG070130 | Mus musculus transcribed sequences |
| 1443961_at | 0.228 | Tcstv3 | BG071029 | Mus musculus similar to ALY |
| 1438841_s_at | 0.236 | Nav3 | AV002218 | arginase type II |
| 1419992_x_at | 0.244 | Arg2 | C76746 | expressed sequence C76746 |
| 1457033_at | 0.261 | Urml | BM198753 | Mus musculus transcribed sequence |
| 1457582_at | 0.273 | Ptgs1 | BB528233 | ubiquitously transcribed tetratricopeptide repeat gene |
| 1430648_at | 0.273 | Uty | AK013326 | RIKEN clone:2810451E09 |
| 1441417_at | 0.276 | 2810451E09Rik | BB363313 | intergral membrane protein 1 |
| 1447188_at | 0.285 | Itm1 | AU016662 | |
Genes in bold are differentially expressed in both the presence and absence of LIF.
Cells were cultured in the presence of LIF, and twelve genes of interest (see Supplemental Table 2) were selected for confirmation of expression pattern by quantitative RT-PCR (Fig. 7A). These genes were selected for validation because they were found to have interesting biological functions such as differentiation and cell cycle regulation. Ten of twelve genes were validated (see Supplemental Tables 2 and 3 for GenBank numbers). Similarly, a number of genes that were differentially expressed in the RS Rex1−/− 11.4 cell line as compared to Wt cells cultured in the absence of LIF were also validated by quantitative RT-PCR (Fig. 7B). Four out of four genes were validated (see Supplemental Table 2). Additionally, the transcript levels of three of these genes were validated in the D6 Rex1 overexpressing and Rex1 restoration cell line 10 (Fig. 7C). Further confirmation of the microarray results was undertaken at the protein level (Fig. 7D). Cyclin D2 expression was decreased in Rex1−/− 11.4 cells as compared to Wt cells cultured in the presence of LIF (Fig. 7D). Cyclin D2 levels in the D6 Rex1 overexpressing line and the Rex1−/−Rex1 restoration line 10 were comparable to Wt.
Figure 7. Real Time (Quantitative) RT-PCR validation of putative Rex1 target genes.

Cells were cultured in media (A) supplemented with LIF or (B,C) without LIF. Real time RT-PCR was performed on 5 μg of total RNA in 50μl total volume to investigate expression of several putative Rex1 target genes. RNA levels of genes in Wt, RS Rex1−/− 11.4 and D6 Rex1 overexpressing cells were calculated relative to 36B4 mRNA levels. Asterisks indicate significance where one asterisk = p < 0.05, two asterisks = p < 0.02. D. Western blot analysis of Rex1−/− and Rex1 overexpressing ES cell lines. Whole cell extracts (100 μg) were loaded onto SDS-PAGE gels and probed for Cyclin D2 expression. Actin was used as a loading control. Experiments were performed at least three times starting with cultured cells with similar results from all experiments.
Functional annotation of gene microarray data
To obtain a better understanding of the functional roles of Rex1 in ES cells, gene ontology analysis was performed (Ashburner et al., 2000). The gene lists obtained from GeneSpring analyses of cells cultured in the presence of LIF were investigated using the Database for Annotation, Visualization and Integrated Discovery (DAVID). DAVID is a set of web-based tools that assigns genes to functional categories based on their roles in certain defined biological processes (Dennis et al., 2003). These categories organize the gene list information to allow for the identification of biological processes and molecular functions most associated with the disruption of Rex1 expression. Based on the Kappa statistics calculations (see “ Experimental Procedures”), the most significant biological processes are presented in Table 3. Clusters consist of similar biological processes. For each cluster, some of the associated genes are shown (Table 3).
Table 3.
DAVID functional annotation clustering was performed to identify biological processes that are enriched in WT ES cells as compared to RS11.4 Rex-1−/− ES cells in the presence of LIF.
DAVID Functional Annotation Clustering
| Annotation Clusters a | Associated Genes |
|---|---|
| Cluster 1: Enrichment Score 11.11 | |
| Cell migration Localization of cell Cell motility Locomotion |
Activated leukocyte cell adhesion molecule Integrin alpha 1 Twist 1 homolog Centaurin, delta 3 Chemokine (c-c motif) ligand 25 |
| Cluster 2: Enrichment Score 10.4 | |
| Regulation of progression through cell cycle Regulation of cell cycle Cell cycle |
E2F transcription factor 5 Wilms tumor homolog Cyclin T2 Vav1 oncogene Cyclin D2 Ran Cyclin-dependent kinase inhibitor 2B |
| Cluster 3: Enrichment Score 6.75 | |
| Blood vessel morphogenesis Blood vessel development Vasculature development |
Endothelin 1 TGFβ2 Thrombospondin 1 |
| Cluster 4: Enrichment Score 6.48 | |
| Axonogenesis Neurite morphogenesis Neuron morphogenesis during differentiation Neuron development Neuron differentiation |
Brain derived neurotrophic factor Paired box gene 6 Eph receptor a4 |
Clustering was performed to identify biological processes that are enriched in WT ES cells as compared to RS11.4 Rex1−/− ES cells in the presence of LIF.
In order to gain further insights into the potential functional significance of the loss of Rex1 in mES cells, Ingenuity Pathways Analysis was utilized (IPA, Ingenuity Systems, www.ingenuity.com). Ingenuity utilizes an extensively curated knowledge database of biological networks to assign genes to specific pathways based on their known functions and gene interactions. Ingenuity also organizes genes of interest into networks as a means of visualizing potential interactions in the cell types under investigation. To explore the specific networks and pathways associated with Rex1 disruption, the gene lists were analyzed using the Ingenuity program. Networks are rated based on the probability of finding one’s genes of interest, described as “focus genes” in a given network as compared to a set of randomly selected genes (see “ Experimental Procedures”). Hence, the highest scoring networks have incorporated the greatest numbers of focus genes. A representative high- scoring network is displayed (Fig. 8A). This network shows direct interactions of several genes that are increased in Wt cells as compared to RS Rex1−/− 11.4 cells. For several of the highest-scoring networks, many of the associated pathways were the same (Fig. 8C). Major associated pathways include cell cycle regulation, as well as integrin signaling and EGF signaling. Several biological functions were also statistically over-represented in the gene lists above (Fig. 8D, Table 4), suggesting that these functions are most closely related to Rex1 disruption. Some of the top associated network functions are tissue and cellular development, cancer, tumor morphology, and cellular growth and proliferation.
Figure 8. Ingenuity Pathways Analysis.

Gene refseq accessory numbers were imported into the IPA software and functional annotation was performed. A, B. Network analysis shows gene interactions generated from Wt vs. RS11.4 Rex1 −/− cells gene lists. The network is graphically represented as nodes (genes) and edges (the biological relationship between genes). In this network, all the colored nodes are focus genes identified by microarray analysis. Uncolored nodes are genes associated with the regulated genes, based on pathway analysis. Green nodes represent genes that are reduced in Wt cells as compared to RS11.4 Rex1 −/− cells and red nodes represent genes that are increased in Wt cells as compared to RS11.4 Rex1 −/− cells C, E. The highest scoring Ingenuity pathways associated with the uploaded focus genes were identified using the Ingenuity knowledge database and graphed. Threshold indicates the threshold for significance. Ratio indicates the ratio of the number of focus genes participating in a pathway to the total number of genes assigned to that pathway. D, F. The most statistically significant biological functions associated with the networks were identified using the Ingenuity knowledge database. Results from cells cultured in the presence of LIF are shown in A, C and D. Results from cells cultured in the absence of LIF are shown in B, E and F.
Table 4.
Ingenuity Pathways analysis was utilized to determine biological functions associated with genes that are increased in WT ES cells as compared to RS11.4 Rex-1−/− ES cells cultured in the presence of LIF.
Ingenuity Pathways Analysis
| Gene |
|---|
|
Cell Growth and Proliferation Cav 1 CD44 Col1a1 Ets1 Gbp2 Ptgs2 RUNX1T1/Cbfa2T1h Il-7* CD84* Tyrp1* Tac4 * |
|
Cell cycle CcnD2 Cdkn2b Vav1 E2F5* Mdm2* Ran* |
|
Tissue Development ADAMTS1 BDNF EGFR Epha4 NFkB2 Pax6 PTX3 Fkbp1a* |
|
Cancer MMP14 TGFβ2 Twist1 Wt1 Serpine 1 CNN1 Mbd2 Ptgs1* |
Indicates lower mRNA levels in WT ES cells vs. RS11.4 Rex1−/− ES cells
Gene lists obtained from cells cultured in the absence of LIF were also analyzed using DAVID, as well as Ingenuity Pathways Analysis. The most significant DAVID- generated cluster consisted of genes involved in development and morphogenesis. The highest scoring Ingenuity Pathways Analysis network is presented in Figure 8B. This network shows direct interactions of several genes that are increased (red) or decreased (green) in Wt cells as compared to RS Rex1−/− 11.4 cells. Many of the most significantly associated biological pathways and functions for Rex1−/− 11.4 cells cultured in the absence of LIF (Fig. 8E,F) differed from those associated with Rex1−/− 11.4 cells cultured in the presence of LIF.
DISCUSSION
In this report we describe the disruption of the Rex1 gene in murine embryonic stem cells and the subsequent characterization of these cells. We hypothesized that the Rex1 protein plays a role in ES cell self-renewal and/or differentiation.
Disruption of Rex1 does not cause morphological changes in undifferentiated ES cells
We did not observe a function for Rex1 in the self-renewal properties of ES cells. There was no apparent difference in gross morphology or alkaline phosphatase (Fig. 2) staining in RS Rex1−/− 11.4 and RS Rex1−/− 16 cells as compared to Wt cultured with LIF. There was also no discernible difference in the mRNA levels of the stem cell markers Oct4, Nanog, and Sox2 upon culturing cells in ES media supplemented with LIF (Fig. 3). We and others have shown that Rex1 is transcriptionally regulated by these stem cell proteins (Ben-Shushan et al., 1998; Shi et al., 2006). Initially, we had postulated that Rex1 might, in turn, also regulate one or all of these genes. However, the fact that the mRNA and protein levels of Oct4, Nanog, and Sox2 were similar in Wt, Rex1−/− ES cells and Rex1 overexpressing cells cultured plus LIF does not support this hypothesis. These results are consistent with recently published work (Masui et al., 2008) that also finds no detectable difference in the morphology or state of differentiation of Rex1−/− ES cells as compared to Wt cells cultured in the presence or absence of LIF.
Rex1−/− ES cells display a greater susceptibility to RA mediated effects than Wt ES cells
The alkaline phosphatase protein is used to identify undifferentiated ES cells (Talbot et al., 1993). We demonstrated that upon RA treatment Rex1−/− cells showed decreased alkaline phosphatase staining as compared to Wt (Fig. 2). Additionally, the mRNA and protein levels of Oct4 and Sox2 were lower in Rex1−/− EScells as compared to Wt cells cultured in the presence of RA. Hence, our data here show that the loss of Rex1 expression increases the responsiveness of ES cells to RA induced differentiation. We propose that Rex1 acts to inhibit this differentiation and that in the absence of Rex1, ES cells display a greater degree of differentiation, as assessed by the levels of molecular markers of differentiation.
Similarly, the cell proliferation studies demonstrated that while both LIF removal and RA treatment resulted in the growth inhibition of ES cells, it is only upon RA treatment that Rex1−/−cells show increased growth inhibition as compared to Wt cells (Fig.6). Thus, the disruption of both alleles of the Rex1 gene leads to increased susceptibility of these cells to the effects of RA. Conversely, Rex1 overexpressing cells display decreased susceptibility to RA induced differentiation and growth inhibition as compared to Wt cells. While the mechanisms underlying the growth- inhibiting and differentiation-inducing effects of RA are not completely understood, our group has shown that the receptor RARβ2 is involved (Faria et al., 1999). However, we observed no statistically significant differences in mRNA levels of RA receptors α,β, or γ (data not shown). Hence, the RA induced effects in this study are not likely to be simply a consequence of changes in RAR transcript levels.
Rex1 inhibits ES cell differentiation
Upon culture in increasing concentrations of RA, the Rex1−/− ES cells exhibited higher mRNA levels of the ectoderm markers Nestin and Fgf5, the mesoderm markers PDGFRα and Brachyury, and the endoderm markers LamB1and Gata6 (Fig. 4A -D). This was also seen at the protein level with increased expression of Pax6, Brachyury and Gata4, which are markers of the ectoderm, mesoderm and endoderm respectively (Fig. 4E). Furthermore, upon culture as embryoid bodies, the expression of Pax6, Brachyury and Gata4 increased in Rex1−/− ES cells and markedly decreased in D6 Rex1 overexpressing cells vs. Wt by day 4 and day 8 in the presence of RA (Fig. 5). These experiments show that even at low concentrations of RA, the RS Rex1−/−11.4 ES cell line is more susceptible than wild type cells to differentiation into cells with characteristics of the ectoderm, mesoderm and endoderm. These data are not entirely in accord with a recent report (Zhang et al., 2006a) which claims that the knockdown of Rex1 led to differentiation of the ES cells to endoderm and mesoderm but not to ectoderm. One possible explanation for this discrepancy is that different methods were chosen for disruption of Rex1 expression. In our case, homologous recombination was chosen, since this process ensures that no expression of Rex1 protein would occur. RNA interference, used by Zhang and colleagues, still resulted in substantial expression of the Rex1 gene (Zhang et al., 2006a) and may have induced non-specific off target effects (Marques and Williams, 2005; Sledz and Williams, 2005). Additionally, work by another group (Masui et al., 2008) confirms our findings that Rex1−/−mouse ES cells behave similarly to wild type in the absence of RA treatment. We previously examined the differentiation of F9 Rex1−/− cells along the endoderm pathway (Thompson and Gudas, 2002). In both F9 and ES cells, the mRNA levels of the parietal endoderm marker, LamB1, were increased in Rex1−/− cells vs. Wt cells upon differentiation. Collectively these data show an increased susceptibility of Rex1−/− ES cells to RA induced differentiation.
Microarray data indicate a role for Rex1 in cell cycle regulation, differentiation and cancer
Our microarray analyses suggest a role for Rex1 in several biological processes. DAVID analyses clustered differentially expressed genes and Ingenuity analyses organized related genes into networks. Results from these analyses suggest a role for Rex1 in cell cycle regulation. Research on the regulation of cell cycle progression in ES cells has suggested that this regulation plays an important role in the regulation of stem cell character (White and Dalton, 2005). Additionally, analysis of cell cycle markers in human ES cells identified high mRNA levels for Cyclin D2 as compared to those in somatic cells (Becker et al., 2006). We have demonstrated herein that the mRNA levels of Cyclin D2 and Cyclin T2, and the protein levels of Cyclin D2 are decreased in Rex1−/− ES cells as compared to Wt ES cells (Fig. 7). The differential expression of these and other cell cycle genes such as Cyclin E2 and CDKN2B suggests that Rex1 activity may influence cell cycle progression. Ingenuity analyses further suggested a role for Rex1 in cell growth and proliferation. This result is supported by our cell proliferation assays (Fig. 6). Also, consistent with the fact that Rex1 is a transcription factor, Ingenuity analyses implicated Rex1 in gene expression.
In addition to the results of our retinoic acid treatment experiments, the data from both Ingenuity Pathways Analysis (Table 4) and DAVID (Table 3) implicate Rex1 in the development of specific terminal cell types. Our microarray analyses indicate differential expression of genes involved in vasculature and cardiovasculature development, such as endothelin and thrombospondin (Sheibani and Frazier, 1999). Our pathway analysis also suggests a role for Rex1 in development, as seen by the differential expression of neuronal genes such as BDNF (Wozniak, 1993), Pax6 (Osumi, 2001) and Epha4 (Liu et al., 2006) as well as WT1, the homolog of the Wilms tumor gene, which plays a pivotal role in the endoderm and mesoderm-derived urogenital system (Scholz and Kirschner, 2005). This involvement of Rex1 in tissue development supports our contention that Rex1 functions in the differentiation of ES cells.
Particularly interesting was the potential association of Rex1 with cancer and tumor morphology. Our microarray analyses identified a number of genes which play a role in cell proliferation and whose disruption is associated with the cancerous state (Table 4). Cancer-related genes such as TGFβ2 (Wick et al., 2001), Wt1 (Yang et al., 2007), Cnn1/cyr61 (Babic et al., 1998), Mmp14 (Wick et al., 2001), Cav1 (Sedding and Braun-Dullaeus, 2006), Cbfa2T1h (Niwa-Kawakita et al., 1995) and CD44 (Entwistle et al., 1996) were also differentially expressed in J1 Wt vs. RS Rex1−/− 11.4 cells. This differential expression of several cancer-associated genes in the absence of Rex1 is consistent with previous data (Raman et al., 2006) from our laboratory which showed that human Rex1 mRNA and protein expression is decreased or absent in tissue from several renal cancer subtypes, but present in normal renal tissue samples (Raman et al., 2006). Taken together, these data suggest that the loss of Rex1 is associated with cancer formation.
In summary, we have shown that the disruption of Rex1 in mouse ES cells leads to an increased susceptibility of these cells to the effects of retinoic acid treatment. We have shown that Rex1 plays a role in the regulation of cell proliferation after RA treatment. Further, we have identified a role for Rex1 in several processes associated with cellular differentiation, such as neuronal and blood vessel development. We have also suggested a role for Rex1 in cancer.
EXPERIMENTAL PROCEDURES
Generation of Rex1 −/− ES Cell lines
The Rex1−/− targeting vector was generated as described previously (Thompson and Gudas, 2002). Both alleles of Rex1 were disrupted in Wild type ES cells using the procedure described previously (Thompson and Gudas, 2002). Single colonies were selected from one positive clone.
Generation of Rex1 Stably Transfected ES Cell lines
The Rex1 expression vector was constructed by inserting the full-length Rex1 cDNA, excised from the pRexSG5 vector (Hosler et al., 1989), into the EcoRI site of the pIRESneo3 vector (Clontech, Mountain View, CA). The sequence of the entire Rex-1 coding region in pIRESneo3 was confirmed by direct automated sequencing and compared to the wild-type sequence. No mutations were found to have been introduced during sub-cloning.
The Rex1 expression vector was transfected into J1 Wt ES cells using 3–6 μl FuGENE Reagent (Roche, Indianapolis, IN) per ml of medium. Selection was carried out in medium containing 300–500 μg/ml of active G418 sulfate for 14 days. Drug-resistant colonies were picked and cultured for screening for stable expression of the transfected gene. Screening G418-resistant clones for the elevated expression of Rex1 was carried out by semi-quantitative RT-PCR analysis. Primers were devised to identify the T7 RNA polymerase promoter region of the vector and exon 4 of Rex1. The primers used to identify exogenous Rex1 are F: 5′TCCAAGGAGCTGAACTCCT 3′ and R: 5′ CGTCTTGCTTTAGGGTCAGTT 3′.
Generation of Stably Transfected Rex1 Restoration ES Cell Lines
The Rex1-pIRESneo3 expression vector detailed above contains a CMV promoter which drives Rex1 expression (Clontech, Mountain View, CA). The vector was transfected into Rex1−/− 11.4 cells using 3 μl FuGENE Reagent (Roche, Indianapolis, IN) per ml of medium. Selection was carried out in medium containing 500 μg/ml of active G418 sulfate for 14 days. Drug- resistant colonies were picked and cultured for screening for stable expression of the transfected gene. Screening of G418- resistant clones for the exogenous expression of Rex1 was carried out by semi-quantitative RT-PCR using the primers detailed above.
Cell Culture
Murine ES cells were cultured as described previously (Martinez-Ceballos et al., 2005). Human prostate epithelial cells (Lonza, Allendale NJ) were cultured in monolayer on tissue culture dishes containing prostate epithelial growth medium (PREGM, Lonza, Allendale NJ) according to manufacturer’s instructions.
Dose-response Experiments
Cells were cultured in the presence of LIF and supplemented with 0.05, 0.5 and 5 μM all-trans RA (Sigma, St. Louis, MO) for 72 hours.
Embryoid body Experiments
Cells (3×10⁶) were plated in low-attachment tissue culture dishes (Corning, Corning, NY) in 15 ml of ES medium without LIF. From day 4 of culture, embryoid bodies were cultured in the presence of 5 μM RA.
Cell proliferation Experiments
ES cells were plated on 12-well plates at a density of 1.2 × 10⁴ cells/well in the presence or absence of LIF and 1μM RA. Cells were counted over four days using an electronic particle counter (model: CoulterZ1; Beckman Coulter, Inc., Fullerton, CA). For all cell culture experiments, medium was replaced every 48 hours.
Alkaline Phosphatase Assay
Cells (5×10⁴ per slide) were plated on gelatin coated one-chamber slides (BIO-RAD) in ES media supplemented with LIF. They were cultured for 72 hours and subjected to a procedure for alkaline phosphatase detection (Paling et al., 2004). Pictures were taken with a DS-Fi1 color camera (NIKON, Melville, NY) on a TE2000 inverted microscope (Nikon, Melville, NY). Quantitation of alkaline phosphatase staining was undertaken as follows using the NIKON Elements Advanced Research program (NIKON, Melville, NY): color intensity is measured using the optical density calibration in which the area within the optical field is selected and brightness of this region is calculated by the program. For each cell line, five separate regions were quantified per treatment. Three independent experiments were performed.
RNA Isolation and Northern Blot Analysis
Total RNA was isolated from cells and subjected to northern blot analysis as previously detailed (Martinez-Ceballos et al., 2005).
Semi-quantitative RT-PCR
First strand cDNA was synthesized from 5 μg of total RNA as described previously (Raman et al., 2006). Oligonucleotide primers were designed to amplify the cDNA products (Supplemental Table 1). PCR amplification of 36B4 (Gillespie and Gudas, 2007) was performed to normalize for the amount of starting cDNA per sample. Conditions for the PCRs consisted of 95° C for 5 min, followed by cycles of 94 °C for 30 s, primer annealing at 55–65° C for 30 s and template extension at 72 °C for 45 s for 22–40 cycles. The identity of the DNA product was confirmed by comparison of the PCR-amplified DNA to the predicted fragment size. PCR experiments were repeated at least three times using independent cDNA preparations.
Real Time (Quantitative) RT-PCR
Real-time PCR analysis was performed as described previously (Su and Gudas, 2008). Oligonucleotide primers were designed to amplify the cDNA products (Supplemental Table 1). Reaction conditions consisted of 95° C for 3 min to activate the polymerase (IQ SYBR Green Supermix cat# 170-8882, Bio-Rad) followed by 45 cycles of 94° C for 20 s, primer annealing at 55–62 °C for 45 s and extension at 72 °C for 45 s; fluorescence was read after each cycle at 80°C. PCR experiments were repeated at least three times using independent cDNA preparations.
Protein extraction and western blot analysis
Cells were cultured for 48 hours and harvested into 2x sample buffer (100 mM Tris–HCl pH 6.8, 4% SDS and 20% glycerol). Aliquots (100 μg) of whole cell lysate were separated on 12% and 15% SDS–acrylamide gels and proteins transferred to nitrocellulose membranes (Bio-Rad, Hercules, CA). The membranes were incubated with anti- Rex1 antibody (#ab28141, Abcam, Cambridge, MA), Oct4 antibody (#sc-8629, Santa Cruz Biotechnology, Santa Cruz, CA), Sox2 antibody (#01438, Stem Cell Technologies, Vancouver, BC), Pax6 antibody (#PRB-278P, Covance ), Brachyury antibody (#af2085, R&D Systemc Inc., Minneapolis, MN ), Gata4 antibody (#sc-1237, Santa Cruz Biotechnology, Santa Cruz, CA ), and Cyclin D2 antibody (#sc-593, Santa Cruz Biotechnology, Santa Cruz, CA ), followed by the appropriate secondary. Anti-rabbit IgG-horseradish peroxidase (HRP) conjugated antibody (#sc-2030, Santa Cruz Biotechnology, Santa Cruz, CA), anti-goat IgG-horseradish peroxidase (HRP) conjugated antibody (#sc-2020, Santa Cruz Biotechnology, Santa Cruz, CA) and anti-rat IgG-horseradish peroxidase (HRP) conjugated antibody (#sc-2006, Santa Cruz Biotechnology, Santa Cruz, CA)were used. All dilutions were in phosphate-buffered saline containing 5% Blotto (Santa Cruz Biotechnology, Santa Cruz, CA) and 0.1% Tween-20 (Sigma, St. Louis, MO). Signals were visualized by an enhanced chemiluminescence reaction using the ECL SuperSignal (Pierce, Rockford, IL) and exposure to autoradiography. Goat anti-mouse actin antibody (#sc-1616, Santa Cruz Biotechnology, Santa Cruz, CA) at a dilution of 1:5000 was used to control for the loading of protein extracts.
Microarray Analysis
Wild-type and Rex1−/− ES cells werecultured for 12 hours in the presence or absence ofLIF, and subjected to the microchip array protocol described previously(Langton and Gudas, 2007). All microarray data from this study have been submitted to the GEO database (http://www.ncbi.nlm.nih.gov/geo). The Series accession number is GSE9978.
Microarray data analysis was performed using the computer programs GeneSpring (Redwood, CA), DAVID (http://david.abcc.ncifcrf.gov) and Ingenuity Pathways Analysis (Ingenuity Systems, Mountain View, CA).
GeneSpring
Microarray chip data were imported into the GeneSpring program (Agilent, Santa Clara, CA). The data were preprocessed using the GC-RMA method (Wu and Irizarry, 2004). The resulting data were normalized and filtered as described previously (Langton and Gudas, 2007).
DAVID Analyses
DAVID, the Database for Annotation, Visualization and Integrated Discovery (http://david.abcc.ncifcrf.gov) is an online program that uses categorizations from the Gene Ontology Consortium (Dennis et al., 2003) to annotate gene lists functionally. DAVID was used to analyze data sets as described previously (Langton and Gudas, 2007). DAVID calculates the chances of over-representation of gene clusters using EASE, a variation of the Fisher Exact test (Hosack et al., 2003) The resulting Enrichment Score is the mean of p- values of members in a given cluster and is the measure by which their biological significance was ranked.
Ingenuity Pathways Analysis
Ingenuity Pathways Analysis is a set of online tools used to annotate genes functionally in gene lists (www.ingenuity.com). Ingenuity utilizes a database of manually curated direct and indirect relationships among genes and gene products. This information is then used to create molecular networks of interactions associated with the uploaded gene lists. Genes of interest (here, differentially expressed genes from the gene lists) are designated focus genes. Networks are rated based on the probability of finding the focus genes in a given network as compared to a set of randomly selected genes. The network’s score, or p-score, is the exponent of the p-value determined using Fisher’s exact test. Gene lists were analyzed and networks, pathways and lists of associated molecular functions were produced.
Statistical Analyses
Each experiment was performed at least three times. The means ± SEM of independent cell proliferation experiments were calculated using the Graphpad Prism Program (version 4.0a). All other quantitative data were plotted using Excel (Microsoft, Redmond, WA), which was used to calculate the means ± SEM of fold change data.
Supplementary Material
Supplemental Table 1. Primers used for Semi-Quantitative and Quantitative RT-PCR. F= Forward primer; R= Reverse primer.
Supplemental Table 2. Putative Rex-1 associated genes in ES cells identified using Affymetrix MG 430 2.0 arrays. Only those genes with at least a 2 fold change in Wt ES cells relative to RS11.4 Rex-1 −/− ES cells cultured in the presence of LIF are shown.
Supplemental Table 3. Putative Rex-1 associated genes in ES cells identified using Affymetrix MG 430 2.0 arrays. Only those genes with at least a 2- fold change in Wt ES cells relative to RS11.4 Rex-1 −/− ES cells cultured in the absence of LIF are shown.
Acknowledgments
The authors would like to thank Piali Mukherjee of the Weill Cornell Bioinformatics Core for her invaluable assistance in the interpretation of the microarray data. We are also grateful to Karl Ecklund for his assistance in the preparation of the manuscript and to members of the Gudas laboratory for helpful scientific discussions.
This research was supported by NIH/NCBI National Research Service Award F31 CA123703-02 and NIH MSTP Grant GM07739 (KS) and NIH R01 CA097543 and NIH R01 CA043796 (LG).
References
- Ashburner M, Ball CA, Blake JA, Botstein D, Butler H, Cherry JM, Davis AP, Dolinski K, Dwight SS, Eppig JT, Harris MA, Hill DP, Issel-Tarver L, Kasarskis A, Lewis S, Matese JC, Richardson JE, Ringwald M, Rubin GM, Sherlock G. Gene ontology: tool for the unification of biology. The Gene Ontology Consortium. Nat Genet. 2000;25:25–29. doi: 10.1038/75556. [DOI] [PMC free article] [PubMed] [Google Scholar]
- Ataliotis P, Symes K, Chou MM, Ho L, Mercola M. PDGF signalling is required for gastrulation of Xenopus laevis. Development. 1995;121:3099–3110. doi: 10.1242/dev.121.9.3099. [DOI] [PubMed] [Google Scholar]
- Babic AM, Kireeva ML, Kolesnikova TV, Lau LF. CYR61, a product of a growth factor-inducible immediate early gene, promotes angiogenesis and tumor growth. Proc Natl Acad Sci U S A. 1998;95:6355–60. doi: 10.1073/pnas.95.11.6355. [DOI] [PMC free article] [PubMed] [Google Scholar]
- Becker KA, Ghule PN, Therrien JA, Lian JB, Stein JL, van Wijnen AJ, Stein GS. Self-renewal of human embryonic stem cells is supported by a shortened G1 cell cycle phase. J Cell Physiol. 2006;209:883–893. doi: 10.1002/jcp.20776. [DOI] [PubMed] [Google Scholar]
- Ben-Shushan E, Thompson JR, Gudas LJ, Bergman Y. Rex-1, a gene encoding a transcription factor expressed in the early embryo, is regulated via Oct-3/4 and Oct-6 binding to an octamer site and a novel protein, Rox-1, binding to an adjacent site. Mol Cell Biol. 1998;18:1866–1878. doi: 10.1128/mcb.18.4.1866. [DOI] [PMC free article] [PubMed] [Google Scholar]
- Boyer LA, Lee TI, Cole MF, Johnstone SE, Levine SS, Zucker JP, Guenther MG, Kumar RM, Murray HL, Jenner RG, Gifford DK, Melton DA, Jaenisch R, Young RA. Core transcriptional regulatory circuitry in human embryonic stem cells. Cell. 2005;122:947–956. doi: 10.1016/j.cell.2005.08.020. [DOI] [PMC free article] [PubMed] [Google Scholar]
- Brivanlou AH, Gage FH, Jaenisch R, Jessell T, Melton D, Rossant J. Stem cells. Setting standards for human embryonic stem cells. Science. 2003;300:913–916. doi: 10.1126/science.1082940. [DOI] [PubMed] [Google Scholar]
- Chen AC, Gudas LJ. An analysis of retinoic acid-induced gene expression and metabolism in AB1 embryonic stem cells. J Biol Chem. 1996;271:14971–14980. doi: 10.1074/jbc.271.25.14971. [DOI] [PubMed] [Google Scholar]
- Crettaz M, Baron A, Siegenthaler G, Hunziker W. Ligand specificities of recombinant retinoic acid receptors RAR alpha and RAR beta. Biochem J. 1990;272:391–397. doi: 10.1042/bj2720391. [DOI] [PMC free article] [PubMed] [Google Scholar]
- D’Ippolito G, Diabira S, Howard GA, Menei P, Roos BA, Schiller PC. Marrow-isolated adult multilineage inducible (MIAMI) cells, a unique population of postnatal young and old human cells with extensive expansion and differentiation potential. J Cell Sci. 2004;117:2971–2981. doi: 10.1242/jcs.01103. [DOI] [PubMed] [Google Scholar]
- Darr H, Mayshar Y, Benvenisty N. Overexpression of NANOG in human ES cells enables feeder-free growth while inducing primitive ectoderm features. Development. 2006;133:1193–1201. doi: 10.1242/dev.02286. [DOI] [PubMed] [Google Scholar]
- Dennis G, Jr, Sherman BT, Hosack DA, Yang J, Gao W, Lane HC, Lempicki RA. DAVID: Database for Annotation, Visualization, and Integrated Discovery. Genome Biol. 2003;4:P3. [PubMed] [Google Scholar]
- Doetschman TC, Eistetter H, Katz M, Schmidt W, Kemler R. The in vitro development of blastocyst-derived embryonic stem cell lines: formation of visceral yolk sac, blood islands and myocardium. J Embryol Exp Morphol. 1985;87:27–45. [PubMed] [Google Scholar]
- Entwistle J, Hall CL, Turley EA. HA receptors: regulators of signalling to the cytoskeleton. J Cell Biochem. 1996;61:569–77. doi: 10.1002/(sici)1097-4644(19960616)61:4<569::aid-jcb10>3.0.co;2-b. [DOI] [PubMed] [Google Scholar]
- Evans MJ, Kaufman MH. Establishment in culture of pluripotential cells from mouse embryos. Nature. 1981;292:154–156. doi: 10.1038/292154a0. [DOI] [PubMed] [Google Scholar]
- Faria TN, Mendelsohn C, Chambon P, Gudas LJ. The targeted disruption of both alleles of RARbeta(2) in F9 cells results in the loss of retinoic acid-associated growth arrest. J Biol Chem. 1999;274:26783–26788. doi: 10.1074/jbc.274.38.26783. [DOI] [PubMed] [Google Scholar]
- Gillespie RF, Gudas LJ. Retinoid regulated association of transcriptional co-regulators and the polycomb group protein SUZ12 with the retinoic acid response elements of Hoxa1, RARbeta(2), and Cyp26A1 in F9 embryonal carcinoma cells. J Mol Biol. 2007;372:298–316. doi: 10.1016/j.jmb.2007.06.079. [DOI] [PMC free article] [PubMed] [Google Scholar]
- Goolsby J, Marty MC, Heletz D, Chiappelli J, Tashko G, Yarnell D, Fishman PS, Dhib-Jalbut S, Bever CT, Jr, Pessac B, Trisler D. Hematopoietic progenitors express neural genes. Proc Natl Acad Sci U S A. 2003;100:14926–14931. doi: 10.1073/pnas.2434383100. [DOI] [PMC free article] [PubMed] [Google Scholar]
- Gudas LJ. Retinoids and vertebrate development. J Biol Chem. 1994;269:15399–15402. [PubMed] [Google Scholar]
- Hosack DA, Dennis G, Jr, Sherman BT, Lane HC, Lempicki RA. Identifying biological themes within lists of genes with EASE. Genome Biol. 2003;4:R70. doi: 10.1186/gb-2003-4-10-r70. [DOI] [PMC free article] [PubMed] [Google Scholar]
- Hosler BA, LaRosa GJ, Grippo JF, Gudas LJ. Expression of REX-1, a gene containing zinc finger motifs, is rapidly reduced by retinoic acid in F9 teratocarcinoma cells. Mol Cell Biol. 1989;9:5623–5629. doi: 10.1128/mcb.9.12.5623. [DOI] [PMC free article] [PubMed] [Google Scholar]
- Hosler BA, Rogers MB, Kozak CA, Gudas LJ. An octamer motif contributes to the expression of the retinoic acid-regulated zinc finger gene Rex-1 (Zfp-42) in F9 teratocarcinoma cells. Mol Cell Biol. 1993;13:2919–2928. doi: 10.1128/mcb.13.5.2919. [DOI] [PMC free article] [PubMed] [Google Scholar]
- Jiang Y, Jahagirdar BN, Reinhardt RL, Schwartz RE, Keene CD, Ortiz-Gonzalez XR, Reyes M, Lenvik T, Lund T, Blackstad M, Du J, Aldrich S, Lisberg A, Low WC, Largaespada DA, Verfaillie CM. Pluripotency of mesenchymal stem cells derived from adult marrow. Nature. 2002;418:41–49. doi: 10.1038/nature00870. [DOI] [PubMed] [Google Scholar]
- Kashyap V, Rezende N, Scotland K, Shaffer S, Persson JL, Gudas LJ, Mongan NP. Regulation of stem cell pluripotency and differentiation involves a mutual regulatory circuit of the Nanog, OCT4 and SOX2 pluripotency transcription factors with Polycomb Repressive Complexes and Stem Cell micro-RNAs. Stem Cells Dev. 2009 doi: 10.1089/scd.2009.0113. submitted. [DOI] [PMC free article] [PubMed] [Google Scholar]
- Kastner P, Krust A, Mendelsohn C, Garnier JM, Zelent A, Leroy P, Staub A, Chambon P. Murine isoforms of retinoic acid receptor gamma with specific patterns of expression. Proc Natl Acad Sci U S A. 1990;87:2700–2704. doi: 10.1073/pnas.87.7.2700. [DOI] [PMC free article] [PubMed] [Google Scholar]
- Kawasaki H, Mizuseki K, Nishikawa S, Kaneko S, Kuwana Y, Nakanishi S, Nishikawa SI, Sasai Y. Induction of midbrain dopaminergic neurons from ES cells by stromal cell-derived inducing activity. Neuron. 2000;28:31–40. doi: 10.1016/s0896-6273(00)00083-0. [DOI] [PubMed] [Google Scholar]
- Keller G. Embryonic stem cell differentiation: emergence of a new era in biology and medicine. Genes Dev. 2005;19:1129–1155. doi: 10.1101/gad.1303605. [DOI] [PubMed] [Google Scholar]
- Keller GM. In vitro differentiation of embryonic stem cells. Curr Opin Cell Biol. 1995;7:862–869. doi: 10.1016/0955-0674(95)80071-9. [DOI] [PubMed] [Google Scholar]
- Langton S, Gudas LJ. Cyp26A1 knockout embryonic stem cells exhibit reduced differentiation and growth arrest in response to retinoic acid. Developmental Biology. 2007 doi: 10.1016/j.ydbio.2007.12.021. in press. [DOI] [PubMed] [Google Scholar]
- Liu BP, Cafferty WB, Budel SO, Strittmatter SM. Extracellular regulators of axonal growth in the adult central nervous system. Philos Trans R Soc Lond B Biol Sci. 2006;361:1593–610. doi: 10.1098/rstb.2006.1891. [DOI] [PMC free article] [PubMed] [Google Scholar]
- Mangelsdorf DJ, Evans RM. The RXR heterodimers and orphan receptors. Cell. 1995;83:841–850. doi: 10.1016/0092-8674(95)90200-7. [DOI] [PubMed] [Google Scholar]
- Marques JT, Williams BR. Activation of the mammalian immune system by siRNAs. Nat Biotechnol. 2005;23:1399–1405. doi: 10.1038/nbt1161. [DOI] [PubMed] [Google Scholar]
- Martin GR. Isolation of a pluripotent cell line from early mouse embryos cultured in medium conditioned by teratocarcinoma stem cells. Proc Natl Acad Sci U S A. 1981;78:7634–7638. doi: 10.1073/pnas.78.12.7634. [DOI] [PMC free article] [PubMed] [Google Scholar]
- Martinez-Ceballos E, Chambon P, Gudas LJ. Differences in gene expression between wild type and Hoxa1 knockout embryonic stem cells after retinoic acid treatment or leukemia inhibitory factor (LIF) removal. J Biol Chem. 2005;280:16484–16498. doi: 10.1074/jbc.M414397200. [DOI] [PubMed] [Google Scholar]
- Masui S, Ohtsuka S, Yagi R, Takahashi K, Ko MS, Niwa H. Rex1/Zfp42 is dispensable for pluripotency in mouse ES cells. BMC Dev Biol. 2008;8:45. doi: 10.1186/1471-213X-8-45. [DOI] [PMC free article] [PubMed] [Google Scholar]
- Mongan NP, Gudas LJ. Diverse actions of retinoid receptors in cancer prevention and treatment. Differentiation. 2007 doi: 10.1111/j.1432-0436.2007.00206.x. [DOI] [PubMed] [Google Scholar]
- Mongan NP, Martin KM, Gudas LJ. The putative human stem cell marker, Rex-1 (Zfp42): structural classification and expression in normal human epithelial and carcinoma cell cultures. Mol Carcinog. 2006;45:887–900. doi: 10.1002/mc.20186. [DOI] [PubMed] [Google Scholar]
- Niwa-Kawakita M, Miyoshi H, Gotoh O, Matsushima Y, Nishimura M, Shisa H, Ohki M. Cloning and gene mapping of the mouse homologue of the CBFA2T1 gene associated with human acute myeloid leukemia. Genomics. 1995;29:755–759. doi: 10.1006/geno.1995.9941. [DOI] [PubMed] [Google Scholar]
- Osumi N. The role of Pax6 in brain patterning. Tohoku J Exp Med. 2001;193:163–74. doi: 10.1620/tjem.193.163. [DOI] [PubMed] [Google Scholar]
- Paling NR, Wheadon H, Bone HK, Welham MJ. Regulation of embryonic stem cell self-renewal by phosphoinositide 3-kinase-dependent signaling. J Biol Chem. 2004;279:48063–48070. doi: 10.1074/jbc.M406467200. [DOI] [PubMed] [Google Scholar]
- Raman JD, Mongan NP, Liu L, Tickoo SK, Nanus DM, Scherr DS, Gudas LJ. Decreased expression of the human stem cell marker, Rex-1 (zfp-42), in renal cell carcinoma. Carcinogenesis. 2006;27:499–507. doi: 10.1093/carcin/bgi299. [DOI] [PubMed] [Google Scholar]
- Robertson EJ. Using embryonic stem cells to introduce mutations into the mouse germ line. Biol Reprod. 1991;44:238–245. doi: 10.1095/biolreprod44.2.238. [DOI] [PubMed] [Google Scholar]
- Rogers MB, Hosler BA, Gudas LJ. Specific expression of a retinoic acid-regulated, zinc-finger gene, Rex-1, in preimplantation embryos, trophoblast and spermatocytes. Development. 1991;113:815–824. doi: 10.1242/dev.113.3.815. [DOI] [PubMed] [Google Scholar]
- Rohwedel J, Guan K, Wobus AM. Induction of cellular differentiation by retinoic acid in vitro. Cells Tissues Organs. 1999;165:190–202. doi: 10.1159/000016699. [DOI] [PubMed] [Google Scholar]
- Rosfjord E, Rizzino A. The octamer motif present in the Rex-1 promoter binds Oct-1 and Oct-3 expressed by EC cells and ES cells. Biochem Biophys Res Commun. 1994;203:1795–1802. doi: 10.1006/bbrc.1994.2395. [DOI] [PubMed] [Google Scholar]
- Scholz H, Kirschner KM. A role for the Wilms’ tumor protein WT1 in organ development. Physiology (Bethesda) 2005;20:54–59. doi: 10.1152/physiol.00048.2004. [DOI] [PubMed] [Google Scholar]
- Sedding DG, Braun-Dullaeus RC. Caveolin-1: dual role for proliferation of vascular smooth muscle cells. Trends Cardiovasc Med. 2006;16:50–5. doi: 10.1016/j.tcm.2005.11.007. [DOI] [PubMed] [Google Scholar]
- Sheibani N, Frazier WA. Thrombospondin-1, PECAM-1, and regulation of angiogenesis. Histol Histopathol. 1999;14:285–94. doi: 10.14670/HH-14.285. [DOI] [PubMed] [Google Scholar]
- Shi W, Wang H, Pan G, Geng Y, Guo Y, Pei D. Regulation of the pluripotency marker Rex-1 by Nanog and Sox2. J Biol Chem. 2006;281:23319–23325. doi: 10.1074/jbc.M601811200. [DOI] [PubMed] [Google Scholar]
- Sledz CA, Williams BR. RNA interference in biology and disease. Blood. 2005;106:787–794. doi: 10.1182/blood-2004-12-4643. [DOI] [PMC free article] [PubMed] [Google Scholar]
- Smith AG, Heath JK, Donaldson DD, Wong GG, Moreau J, Stahl M, Rogers D. Inhibition of pluripotential embryonic stem cell differentiation by purified polypeptides. Nature. 1988;336:688–690. doi: 10.1038/336688a0. [DOI] [PubMed] [Google Scholar]
- Su D, Gudas LJ. Gene expression profiling elucidates a specific role for RARgamma in the retinoic acid-induced differentiation of F9 teratocarcinoma stem cells. Biochem Pharmacol. 2008;75:1129–1160. doi: 10.1016/j.bcp.2007.11.006. [DOI] [PMC free article] [PubMed] [Google Scholar]
- Talbot NC, Rexroad CE, Jr, Pursel VG, Powell AM. Alkaline phosphatase staining of pig and sheep epiblast cells in culture. Mol Reprod Dev. 1993;36:139–147. doi: 10.1002/mrd.1080360204. [DOI] [PubMed] [Google Scholar]
- Thompson JR, Gudas LJ. Retinoic acid induces parietal endoderm but not primitive endoderm and visceral endoderm differentiation in F9 teratocarcinoma stem cells with a targeted deletion of the Rex-1 (Zfp-42) gene. Mol Cell Endocrinol. 2002;195:119–133. doi: 10.1016/s0303-7207(02)00180-6. [DOI] [PubMed] [Google Scholar]
- Tighe AP, Gudas LJ. Retinoic acid inhibits leukemia inhibitory factor signaling pathways in mouse embryonic stem cells. J Cell Physiol. 2004;198:223–229. doi: 10.1002/jcp.10424. [DOI] [PubMed] [Google Scholar]
- Wang J, Rao S, Chu J, Shen X, Levasseur DN, Theunissen TW, Orkin SH. A protein interaction network for pluripotency of embryonic stem cells. Nature. 2006;444:364–368. doi: 10.1038/nature05284. [DOI] [PubMed] [Google Scholar]
- White J, Dalton S. Cell cycle control of embryonic stem cells. Stem Cell Rev. 2005;1:131–138. doi: 10.1385/SCR:1:2:131. [DOI] [PubMed] [Google Scholar]
- Wick W, Platten M, Weller M. Glioma cell invasion: regulation of metalloproteinase activity by TGF-beta. J Neurooncol. 2001;53:177–85. doi: 10.1023/a:1012209518843. [DOI] [PubMed] [Google Scholar]
- Williams RL, Hilton DJ, Pease S, Willson TA, Stewart CL, Gearing DP, Wagner EF, Metcalf D, Nicola NA, Gough NM. Myeloid leukaemia inhibitory factor maintains the developmental potential of embryonic stem cells. Nature. 1988;336:684–687. doi: 10.1038/336684a0. [DOI] [PubMed] [Google Scholar]
- Wozniak W. Brain-derived neurotrophic factor (BDNF): role in neuronal development and survival. Folia Morphol (Warsz) 1993;52:173–81. [PubMed] [Google Scholar]
- Wu Z, Irizarry RA. Preprocessing of oligonucleotide array data. Nat Biotechnol. 2004;22:656–658. doi: 10.1038/nbt0604-656b. [DOI] [PubMed] [Google Scholar]
- Yang L, Han Y, Suarez Saiz F, Minden MD. A tumor suppressor and oncogene: the WT1 story. Leukemia. 2007;21:868–76. doi: 10.1038/sj.leu.2404624. [DOI] [PubMed] [Google Scholar]
- Zandstra PW, Le HV, Daley GQ, Griffith LG, Lauffenburger DA. Leukemia inhibitory factor (LIF) concentration modulates embryonic stem cell self-renewal and differentiation independently of proliferation. Biotechnol Bioeng. 2000;69:607–617. [PubMed] [Google Scholar]
- Zhang JZ, Gao W, Yang HB, Zhang B, Zhu ZY, Xue YF. Screening for genes essential for mouse embryonic stem cell self-renewal using a subtractive RNA interference library. Stem Cells. 2006a;24:2661–2668. doi: 10.1634/stemcells.2006-0017. [DOI] [PubMed] [Google Scholar]
- Zhang X, Stojkovic P, Przyborski S, Cooke M, Armstrong L, Lako M, Stojkovic M. Derivation of human embryonic stem cells from developing and arrested embryos. Stem Cells. 2006b;24:2669–2676. doi: 10.1634/stemcells.2006-0377. [DOI] [PubMed] [Google Scholar]
Associated Data
This section collects any data citations, data availability statements, or supplementary materials included in this article.
Supplementary Materials
Supplemental Table 1. Primers used for Semi-Quantitative and Quantitative RT-PCR. F= Forward primer; R= Reverse primer.
Supplemental Table 2. Putative Rex-1 associated genes in ES cells identified using Affymetrix MG 430 2.0 arrays. Only those genes with at least a 2 fold change in Wt ES cells relative to RS11.4 Rex-1 −/− ES cells cultured in the presence of LIF are shown.
Supplemental Table 3. Putative Rex-1 associated genes in ES cells identified using Affymetrix MG 430 2.0 arrays. Only those genes with at least a 2- fold change in Wt ES cells relative to RS11.4 Rex-1 −/− ES cells cultured in the absence of LIF are shown.