

Abstract
The molecular mechanisms underlying the vast differences between individuals in their susceptibility to noise-induced hearing loss (NIHL) are unknown. The present study demonstrated that the effects of noise over-exposure on the expression of molecules likely to be important in the development of NIHL differ among inbred mouse strains having distinct susceptibilities to NIHL including B6 (B6.CAST) and 129 (129X1/SvJ and 129S1/SvImJ) mice. The noise-exposure protocol produced a loss of 40 dB in hearing sensitivity in susceptible B6 mice, but no loss for the two resistant 129 substrains. Analysis of gene expression in the membranous labyrinth 6 h following noise exposure revealed up-regulation of transcription factors in both the susceptible and resistant strains. However, a significant induction of genes involved in cell-survival pathways such as the heat shock proteins HSP70 and HSP40, growth arrest and DNA damage inducible protein 45β (GADD45β), and CDK-interacting protein 1 (p21cip1) was detected only in the resistant mice. Moreover, in 129 mice significant upregulation of HSP70, GADD45β, and p21cip1 was confirmed at the protein level. Since the functions of these proteins include roles in potent antiapoptotic cellular pathways, their upregulation may contribute to protection from NIHL in the resistant 129 mice.
Keywords: gene expression, noise-induced hearing loss, membranous labyrinth, B6.CAST and 129X1/SvJ and 129S1/SvImJ inbred mouse strains
Introduction
Exposure to intense noise may produce either a temporary or permanent hearing loss depending upon multiple factors. Such factors involve the physical parameters of the noise stimulus including its intensity, duration, and frequency range as well as an inherent, genetically determined susceptibility to noise-induced hearing loss (NIHL). For example, a great variability in susceptibility to NIHL reflecting differences in the underlying genetic background has been reported for both humans (Davis et al., 2003; Fortunato et al., 2004) and mice (Ohlemiller et al., 2007; Sliwiniska-Kowalska et al., 2006; Sliwinska-Kowalska et al., 2006; Van Laer et al., 2006). Moreover, certain inbred mouse strains such as the 129Sv/Ev (Yoshida et al. 2000), 129X1/SvJ, and MOLF/EiJ (Candreia et al. 2004) exhibit a very high resistance to noise damage.
It has long been known that acoustic overstimulation induces adverse changes to the morphology and function of the inner ear (Engstrom et al., 1970). At the cellular level, excessive noise exposure produces permanent damage to the organ of Corti including destruction of the outer hair cells (OHCs), hair cell stereocilia, and occasionally inner hair cells (IHCs) (Hu et al., 2002; Ou et al., 2000; Wang et al., 2002; Yang et al., 2004). In addition, the pattern of damage depends upon the genetic background of the individual (Hu et al., 2002; Ohlemiller et al., 2007; Yang et al., 2004; Zhu et al., 2002). Over the past decade or so, the most intensely investigated mechanisms assumed to underlie the noise-induced degeneration of hair cells have included the production of reactive nitrogen and oxygen species as well as an overload of Ca2+ that leads to the triggering of apoptosis, the latter being one of the pathways to noise-induced hair cell death (Bohne et al., 2007; Henderson et al., 2006; Kopke et al., 1999; Ohinata et al., 2000; Ohlemiller et al., 1999b; Yamane et al., 1995). In addition, several studies of the ultrastructural changes associated with acoustic over-exposure have described an inflammatory response that involves the appearance of a phagocytic cell population in the cochlea (Fredelius, 1988; Fredelius et al., 1990; Hirose et al., 2005).
An increase in reactive oxygen species, which has been detected after sound overstimulation, is thought to play a major role in the development of NIHL (Henderson et al., 2006; Ohlemiller et al., 1999a; Ohlemiller et al., 1999b). However, an increase in the activity of enzymes of the antioxidant defense system after noise exposure has also been reported, specifically enhanced glutathione reductase, γ-glutamyl cysteine synthetase, and catalase activities (Jacono et al., 1998). Other efforts exploring noise susceptibility have also focused on defining the molecular changes induced by intense sounds. For example, Cho et al. (2004) demonstrated that several immediate early genes including transcription factors and cytokines were induced 3 h after a noise exposure that resulted in permanent hearing loss. In contrast, upregulation of these genes did not occur in response to a milder noise exposure that caused a temporary, but not a permanent shift in hearing thresholds. Other studies have demonstrated induction of heat shock proteins (HSPs) after intense noise exposure (Lim et al., 1993). In addition, Kirkegaard et al. (2006) found significant early upregulation of inflammatory-response genes and genes involved in cellular antioxidant defense following over-exposure to noise. Thus, it appears that a large number of genes from various interlocked pathways are likely to make significant contributions to the development of NIHL. Particularly, the stress-associated c-Jun N-terminal kinase (JNK) signaling pathway, known to contribute to neuronal cell death induced by a variety of stressful stimuli (Derijard et al., 1994; Kyriakis et al., 1994), was demonstrated to be important in the development of NIHL. Blockade of this particular pathway provided in vivo protection from NIHL (Ahn et al., 2005; Pirvola et al., 2000; Wang et al., 2003; Wang et al., 2007; Zine et al., 2004). Additionally, antisense oligonucleotides that prevent the upregulation of the JNK target gene c-Jun protected cultured spiral ganglia neurons from oxidative-stress damage, a known mediator of NIHL (Scarpidis et al., 2003).
Nevertheless, given that the pathophysiological processes of NIHL are complex, it is difficult to discern a coherent profile of alterations in gene expression with molecular methods such as the Northern blot analysis or the reverse transcriptase polymerase chain reaction. Most significantly, these techniques preclude the simultaneous analysis of large numbers of genes. The advent of cDNA-microarray technology has afforded an efficient and reliable tool for quantifying the expression of many genes simultaneously. Indeed, several studies, some of which were noted above, have described the noise-induced changes in gene expression in the cochleae of various animal species using this strategy (Cho et al., 2004; Kirkegaard et al., 2006; Lomax et al., 2001; Taggart et al., 2001).
The knowledge that some inbred mice exhibit a very high resistance to the adverse effects of noise overstimulation is intriguing. The aim of the present study was to further our understanding of the endogenous molecular mechanisms that confer such protection. Here, the results of a microarray analysis of gene expression in microdissected membranous labyrinths from different mouse strains representing unique susceptibilities to noise damage are described for a time period of 6 h after the noise exposure. Thus, changes in gene expression were studied at a period of time for which no loss of hair or supporting cells is expected which could otherwise invalidate the gene expression experiments (Wang et al., 2002). The major finding was that exposure to excessive noise differentially affected the expression of molecules likely to be important in the development of NIHL in inbred mouse strains that are distinct in their susceptibility to NIHL. Thus, this study may provide valuable insights with respect to the future design of targeted protective interventions regarding NIHL.
2. Materials and Methods
2.1. Mice
The B6.CAST-Cdh23CAST/J (B6) strain used in this study is a congenic strain derived from the C57BL/6J but corrected for the age-related hearing loss of the parental strain by replacing its defective ahl allele with the wildtype Ahl of the Cast/Ei (Johnson et al., 1997). The ahl allele of the 129X1/SvJ (129X1) is the ahl allele common to most laboratory mouse strains including other 129 strains. This ahl allele is different from the Cast/Ei’s and also different from the defective C57BL/6J’s (Noben-Trauth et al., 2003). No information is available about the ahl allele of the 129S1/SvImJ (129S1). The B6 and the 129S1 mice were purchased from The Jackson Laboratory (Bar Harbor ME), while the 129X1 mice were bred within the vivarium facilities of the University of Pennsylvania. Hereafter, the two substrains will be referred to as the 129 mice. Female B6 and 129 10-wk-old mice were divided into sham-exposed (control) and noise-exposed (experimental) groups. Within each of the control and experimental groups, eight mice of each strain were used for the functional evaluation of noise-exposure effects using measures of the auditory brainstem response (ABR), 16–24 mice were used for gene profiling (eight mice/array as listed in Table 1; sham-exposed mice served as controls to account for expression changes in stress-related genes not directly related to the noise over-exposure), and three mice were used for immunohistochemistry. All animal procedures were approved by the Institutional Animal Care and Use Committees of the University of California, Davis, and the University of Pennsylvania.
Table 1.
Gene Arrays Performed.
| Array Group | Array | Mean Signal Intensity | % of Sequences Detected | Cochlear Markers* | |||
|---|---|---|---|---|---|---|---|
| MYO IC | MYO VIIA | MYO VI | α Tectorin | ||||
| Susceptible Sham-Exposed Control | B6CAST C1 (n=8) | 677 | 61 | D | D (344) | D | D |
| B6CAST C2 (n=8) | 682 | 60 | D | D (331) | D | D | |
| Susceptible Noise-Exposed | B6CAST N1 (n=8) | 683 | 58 | D | D (346) | D | D |
| B6CAST N2 (n=8) | 678 | 60 | D | D (308) | D | D | |
| Resistant Sham-Exposed Control | 129X1 C1 (n=8) | 668 | 59 | D | D (255) | D | D |
| 129X1 C2 (n=8) | 654 | 58 | D | D (303) | D | D | |
| 129X1 C3 (n=8) | 688 | 59 | D | D (337) | D | D | |
| Resistant Noise-Exposed | 129X1 N1 (n=8) | 681 | 57 | D | nd (372) | D | D |
| 129X1 N2 (n=8) | 693 | 61 | D | D (300) | D | D | |
| 129X1 N3 (n=8) | 655 | 58 | D | nd (311) | D | D | |
n=number of mice pooled per group
C=control; N=noise-exposed; D=detected; nd=not detected; MYO IC=Myosin IC; MYO VIIA=Myosin VIIA; MYO VI=Myosin VI
MYO VIIA was not detected in two of the 10 arrays; however, the signal intensity was similar in all arrays (signal intensity is given in parenthesis).
2.2. ABR Measurements
Mice were anesthetized by intraperitoneal injection of a mixture of ketamine hydrochloride (100 mg/kg) and xylazine (4 mg/kg). In a few cases, when required, an additional maintenance dose (ketamine 50 mg/kg and xylazine 2 mg/kg) was given. ABRs were measured using a commercial system (Intelligent Hearing Systems, 2061, Miami FL). Specifically, ABR-detection thresholds were determined for tonepip stimuli (rise/fall=1 ms, duration=3 ms, repetition rate=21 Hz) at three frequencies (i.e., 8, 16, 32 kHz). Utilizing subdermal electrodes (vertex=active, reference=mastoid, ground=back), the responses to 1024 tonepip presentations were amplified (100K), filtered (100 Hz-3 kHz), and synchronously averaged. Each stimulus was presented initially at 100 dB SPL, and then stimulus intensity was decreased systematically in 5-dB steps, until a visually discernible ABR waveform could no longer be detected. ‘Threshold’ was defined as the lowest level of the stimulus that produced a visually detectable response. ABRs were measured initially at 10 wk of age for all mice to establish baseline measures. In mice used for functional evaluations, ABRs were again measured immediately after the noise exposure and then again after 5 d.
2.3. Noise Exposure
The noise overstimulation episode consisted of a 1-h exposure to a 105-dB SPL, 10-kHz centered octave band of noise (OBN). The OBN exposure was generated using white noise synthesized by a Universal Serial Bus controlled digital signal processor system (Intelligent Hearing Systems, Miami FL) connected to a personal computer and a custom-designed noise filter (Intelligent Hearing Systems, Miami FL) consisting of a four-pole, band-pass filter with a center frequency of 10 kHz and a bandwidth extending from about 7–14 kHz. The noise signal was then amplified (Crown D75A, Elkhart IN) and transduced by four speakers (RadioShack Corp, Ft Worth TX) attached to the walls of the sound-isolation chamber. The noise spectrum ranging from 8–16 kHz was analyzed in 1/3-octave frequency bands, with the maximum energy occurring at the center frequency of 10 kHz and having a 60-dB/octave roll-off.
During the noise-exposure sessions, one mouse was placed into each of four compartments (12 cm wide) of a custom-made, wire-mesh cage. The cage was placed in the center of the sound-isolation chamber that was fitted with hard-reflecting surfaces ensuring uniform noise-exposure levels. The homogeneity of the sound field was confirmed using a sound-level meter (Quest Technologies, model 2100, Oconomowoc WI) with the microphone placed at various locations within the cage that approximated typical mouse positions.
2.4. Gene Chip Experiments Sample Preparation and Hybridizations
For the gene-expression studies, the lateral wall; including the spiral ligament and stria vascularis, and the organ of Corti tissues were microdissected from each cochlea under RNAse-free conditions. These tissues were placed into 100 μl of RNAlater (QIAGEN Inc, Valencia CA). All dissections were performed by the same skilled cochlear anatomist. Tissues were stored overnight at 4°C and at −20°C the next morning unti l processed. Total RNA was extracted using RNeasy Protect Mini Kit (QIAGEN Inc, Valencia CA). The RNA was utilized to synthesize biotinylated RNA using MessageAmpTM II ARNA kit, (Ambion, Austin TX). The biotinylated RNA was then fragmented and its quality was assessed using test arrays (Affymetrix Test 3, Affymetrix, Santa Clara CA). The breakdown of the two experimental (noise-exposed B6 and 129) and two control (sham-exposed B6 and 129) groups is indicated in Table 1. Although the experiments were designed to obtain three biological replicates for each group of arrays, two of the RNA extractions for the B6 groups; one for the noise-exposed and one for the sham-exposed did not yield adequate RNA. Thus, only two replicate arrays, instead of three, were obtained for these two groups (see Table 1). All arrays hybridizations were performed at the UC Davis School of Medicine Microarray Core Facility following Affymetrix’ standard procedures.
2.5. Gene Chip Data Analysis
The MGU74v2A gene chip (Affymetrix, Santa Clara CA) used for gene expression profiling contained 12,489 sequences and expressed sequence tags. The sequences in this oligonucleotide chip were from Build 74 of the UniGene database. Each 25-mer oligonucleotide probe in these gene chips is uniquely complementary to a particular gene, with approximately 16 pairs of oligonucleotide probes used to measure the transcript level of the genes represented (additional details may be obtained at http://www.affymetrix.com/index.affx). The images of all arrays were inspected visually to ensure that there were no problems due to contamination, artifacts or bad hybridization. Data analysis was performed using DNA-Chip Analyzer (dChip v.4/14/06, freely available http://biosun1.harvard.edu/complab/dchip/). First each array was normalized to an array with median overall intensity, chosen by dChip, as the baseline array for each group. The group means and standard errors (SEs) was calculated using dChip by pooling arrays from each group of biological replicates from the complete set of arrays (see Table 1). In addition, all the data was uploaded blindly to the “class predicting tool” of the Biometric Research Branch Array Tools (BRB-ArrayTools, freely available: http://linus.nci.nih.gov/BRB-ArrayTools.html) and this program was used to define “classes” within the set of arrays.
2.6. Statistics
The amount of frequency-specific hearing loss due to the noise exposure was defined as the difference between ABR thresholds at 5 d post-noise exposure compared to their pre-exposure counterparts. Specifically, ABR threshold shifts were calculated for each mouse by subtracting the baseline ABR threshold from the ABR threshold 5 d post-exposure. The mean hearing loss [±1 standard deviation (SD)] was determined at each test frequency for each strain (B6 and 129) of mice and plotted as a function of frequency. The hearing loss between the different mouse strains was subjected to a two-factor ANOVA (test frequency × strain) (StatView, v.5, Macromedia, Mountainview CA). Post-hoc comparisons used the Student-Newman-Kuehls test, and statistical significance was set at a probability level of ≤0.05.
For comparisons between groups of microarrays (i.e, n=10 microarrays as indicated in Table 1), the criterion selected required the fold change between group means to exceed a threshold value that was set as two-fold. Statistical significance was set at a probability level of ≤0.05 by testing with unpaired t-tests. The p-value threshold of 0.05 identified genes that differed between the group means with a two-tailed stringent p-value threshold (e.g., 0.05 divided by the total number of genes on the array). Bonferroni corrections were computed assuming that all genes were independent (dChip v.4/14/06: http://biosun1.harvard.edu/complab/dchip/).
2.7. Functional Categorization by Gene Ontology
The transcripts found to be differentially expressed (i.e., transcript levels exhibiting a ≥2-fold difference that reached, at least, a p<0.05 level of significance) in pre-exposure comparisons between 129 and B6 mouse groups with different genetic backgrounds (see Table 2), and in pre and after noise exposure comparisons (see Table 3) were clustered according to their roles in a cellular process. If no cellular process had been assigned to them, genes were alternatively clustered by specific molecular function, e.g., transcription factors known to function as regulators of immune response, are listed only under “immune response”. The functional clustering was performed using the Database for Annotation, Visualization and Integrated Discovery (DAVID) tools of the National Institute of Allergy and Infectious Diseases (http://david.abcc.ncifcrf.gov/gene2gene.jsp).
Table 2.
Differentially expressed probe setsa when comparing B6 and 129 sham-exposed control mice.
| Probe seta | Gene Symbol: Name | Fold difference between sham-exposed groupsb | REF SEQ_ID | |||
|---|---|---|---|---|---|---|
| B6/129 | p-value | 129/B6 | p-value | |||
| REGULATION OF PROGRAMMED CELL DEATH | ||||||
| 94710_g_at | Gcm2: glial cells missing homolog (drosophila), related sequence 2 | 3.9 | 0.034 | NM_008104 | ||
| 94988_at | Pten: phosphatase and tensin homolog | 2.5 | 0.003 | NM_008960 | ||
| 103520_at | Vegfa: Vascular endothelial growth factor | 2.3 | 0.022 | NM_00950 | ||
| 104099_at | Pglyrp1: peptidoglycan recognition protein 1 | 2.4 | 0.044 | NM_009402 | ||
| *4.6 | 0.043 | - | ||||
| 101054_at | Cd74: Ia-associated invariant chain | 2.3 | 0.040 | NM_010545 | ||
| *2.8 | 0.040 | - | ||||
| 102800_at | Foxc2: mesenchyme fork head-1 protein | 2.1 | 0.046 | NM_013519 | ||
| CYTOSKELETON/PROTEIN LOCALIZATION | ||||||
| 93646_at | Ptk9: protein tyrosine kinase 9 | 4.2 | 0.014 | NM_008971 | ||
| 92382_at | Myo6:Myosin VI | 3.9 | 0.002 | NM_001039546 | ||
| 95543_at | Tpm4: tropomyosin 4 | 3.9 | 0.020 | NM_001001491 | ||
| 98490_at | Arl8b: adp-ribosylation factor-like 8b | 3.6 | 0.004 | NM_026011 | ||
| 103967_at | Mid2: midline 2 | 3.0 | 0.012 | NM_011845 | ||
| 99501_at | Tloc1: translocation protein 1 | 2.9 | 0.034 | NM_027016 | ||
| 104297_at | Ipo11: riken cDNA 1700081h05 | 2.0 | 0.016 | NM_029665 | ||
| *2.42 | 0.016 | - | ||||
| 99444_at | Ramp2: mRNA for receptor activity modifying protein 2 | 2.0 | 0.046 | NM_019444 | ||
| 93099_f_at | Plk1: Polo-like kinase homolog | 2.1 | 0.043 | NM_011121 | ||
| 101350_g_at | Plk1: Polo-like kinase homolog | 2.3 | 0.032 | NM_011121 | ||
| IMMUNE RESPONSE | ||||||
| 161141_r_at | CD276: CD276 Antigen | 17.6 | 0.006 | NM_133983.3 | ||
| 102906_at | Tgtp: T-cell specific protein | 3.8 | 0.001 | NM_011579 | ||
| *3.61 | 0.004 | |||||
| 94224_s_at | Ifi204: interferon activated gene 204 | 2.5 | 0.049 | NM_008329 | ||
| 104597_at | Gbp2: guanylate nucleotide binding protein 2 | 2.3 | 0.004 | NM_010260 | ||
| 96183_at | Foxp1: forkhead box p1 | 2.2 | 0.038 | NM_053202 | ||
| 98822_at | G1p2: interferon alpha-inducible protein | 2.2 | 0.041 | NM_015783 | ||
| *2.0 | 0.040 | - | ||||
| 103202_at | Gbp4: guanylate nucleotide binding protein 4 | 2.0 | 0.008 | NM_018734 | ||
| *2.0 | 0.007 | - | ||||
| TRANSCRIPTION REGULATION/DNA BINDING | ||||||
| 101155_at | Hsf2: heat shock factor 2 | 4.4 | 0.024 | NM_008297 | ||
| 101564_at | Cnot7: ccr4-not transcription complex, subunit 7 | 3.2 | 0.005 | NM_011135 | ||
| 93831_at | Nono: non-pou-domain-containing, octamer binding protein | 2.5 | 0.008 | NM_023144 | ||
| 99076_at | Nr1d2: Thyroid hormone receptor alpha | 2.3 | 0.017 | NM_011584 | ||
| 94296_s_at | Gtf2i: TFII-I protein short form | 2.3 | 0.032 | NM_010365 | ||
| 96183_at | Foxp1: forkhead box p1 | 2.2 | 0.038 | NM_053202 | ||
| 104303_i_at | Polr3k: polymerase (rna) iii polypeptide k | 2.2 | 0.018 | NM_025901 | ||
| 101980_at | Sub1: single stranded DNA binding protein p9 | 2.1 | 0.036 | NM_011294 | ||
| 160603_at | Pparbp: peroxisome proliferator activated receptor binding protein | 5.4 | 0.043 | NM_013634 | ||
| *4.3 | 0.043 | |||||
| 101622_at | Alx4: aristaless 4 | 2.5 | 0.036 | NM_007442 | ||
| 161440_r_at | Suv420h2: suppressor of variegation 4–20 homolog 2 (drosophila) | 2.0 | 0.044 | NM_146177 | ||
| PEPTIDASE ACTIVITY | ||||||
| 101020_at | Ctsc: cathepsin c | 3.5 | 0.050 | NM_009982 | ||
| 161224_f_at | Ace: angiotensin i converting enzyme 1 | 3.1 | 0.025 | NM_009598 | ||
| 93920_at | Adam11: a disintegrin and metallopeptidase domain 11 | 3.0 | 0.040 | NM_009613, | ||
| 101816_at | Serpinb3a: peptidase inhibitor (ovalbumin), member 3a | 2.7 | 0.046 | NM_009126 | ||
| 93861_f_at | Ctse: cathepsin e | 2.0 | 0.025 | NM_007799 | ||
| *2.05 | 0.025 | - | ||||
| 94716_f_at | 1700127D06Rik: riken cDNA 1700127d06 | 3.6 | 0.010 | NM_029831 | ||
| *3.7 | 0.010 | - | ||||
| KINASE ACTIVITY AND MODULATION OF KINASE ACTIVITY | ||||||
| 92492_at | Ak3: mRNA for adenylate kinase isozyme 3 | 4.2 | 0.023 | NM_021299 | ||
| 103223_at | Prkce: protein kinase c, epsilon | 3.0 | 0.011 | NM_011104 | ||
| 93902_at | Gab1: growth factor receptor bound protein 2-associated protein 1 | 3.0 | 0.016 | NM_021356 | ||
| 92549_at | Pkig: protein kinase inhibitor gamma | 2.4 | 0.003 | NM_009613 | ||
| *2.55 | 0.007 | - | ||||
| 98766_at | Sh3bp5: sh3-domain binding protein 5 (btk-associated) | 2.1 | 0.046 | NM_011894 | ||
| 101937_s_at | Clk4: CDC2/CDC28-like kinase 4 | 2.0 | 0.041 | NM_007714 | ||
| ION CHANNELS/TRANSPORTERS | ||||||
| 103972_at | KCNJ1: inwardly rectifying potassium channel ROMK-2 | 2.6 | 0.038 | NM_019659 | ||
| 102947_at | Slc22a2: mRNA for organic cation transporter 2 | 4.2 | 0.005 | NM_013667 | ||
| 103782_at | ClCNKa: chloride channel Ka | 2.3 | 0.032 | NM_024412 | ||
| *2.14 | 0.019 | - | ||||
| 94827_at | Fxyd2: gamma subunit of sodium potassium ATPase | 6.8 | 0.026 | NM_052824 | ||
| *5.04 | 0.017 | - | ||||
| POST-TRANSLATIONAL PROTEIN MODIFICATION | ||||||
| 101966_s_at | Rnf13: RING zinc finger protein (Rzf) | 3.2 | 0.008 | NM_011883 | ||
| 103427_at | Fbxl3: f-box and leucine-rich repeat protein 3 | 2.2 | 0.022 | NM_015822 | ||
| 93958_at | Rnf14: ring finger protein 14 | 2.2 | 0.035 | NM_020012 | ||
| RNA PROCESSING | ||||||
| 99162_at | Smndc1: survival motor neuron domain containing 1 | 3.8 | 0.035 | NM_172429 | ||
| *2.47 | 0.035 | - | ||||
| 100037_at | Ddx18: dead (asp-glu-ala-asp) box polypeptide 18 | 3.2 | 0.019 | NM_025860 | ||
| 161929_at | Snrpa1: u2 small nuclear ribonucleoprotein a′ | 3.3 | 0.032 | NM_021336 | ||
| 103978_at | Zc3h11a: zinc finger ccch type containing 11a | 3.4 | 0.008 | NM_144530 | ||
| 102275_at | Zfp185:Zinc finger protein 185 | 3.4 | 0.007 | NM_009549 | ||
| 94061_at | Crip1: cysteine-rich protein 1 (intestinal) | 2.3 | 0.018 | NM_007763 | ||
| *3.11 | 0.001 | - | ||||
| GENES NOT CLUSTERED FUNCTIONALLY | ||||||
| 101139_r_at | Muc10: mucin 10, submandibular gland salivary mucin | 8.4 | 0.035 | NM_008644 | ||
| 101741_at | 2810433D01Rik: riken cDNA 2810433d01 | 7.7 | 0.019 | XM_484087 | ||
| *6.72 | 0.001 | - | ||||
| 101027_s_at | Pttg1: pituitary tumor transforming | 7.5 | 0.037 | NM_013917 | ||
| *6.73 | 0.029 | - | ||||
| 104343_f_at | Pla2g12a: phospholipase a2, group xiia | 5.7 | 0.004 | NM_023196 | ||
| *7.04 | 0.004 | - | ||||
| 96606_at | 1500003O03Rik: riken cDNA 1500003o03 | 5.3 | 0.037 | NM_019769 | ||
| 96074_at | Apof: apolipoprotein f | 5.0 | 0.012 | NM_133997 | ||
| 93872_at | Gfra1: glial cell line derived neurotrophic factor receptor alpha 1 | 4.2 | 0.010 | NM_010279 | ||
| 160872_f_at | 2310008H09Rik: riken cDNA 2310008h09 | 4.1 | 0.005 | NM_023197 | ||
| 96156_at | 1110008H02Rik: riken cDNA 1110008h02 | 3.8 | 0.002 | NA | ||
| *3.67 | 0.002 | |||||
| 101628_g_at | Pld1: phospholipase d1 | 3.6 | 0.011 | NM_008875 | ||
| 94209_g_at | Pdia6: protein disulfide isomerase associated 6 | 3.4 | 0.004 | NM_027959 | ||
| 103978_at | Zc3h11a: zinc finger ccch type containing 11a | 3.4 | 0.008 | NM_144530 | ||
| 100778_at | Cd38: cd38 antigen | 3.4 | 0.007 | NM_007646 | ||
| 102275_at | Zfp185:Zinc finger protein 185 | 3.4 | 0.007 | NM_009549 | ||
| 92251_f_at | AI607873: expressed sequence ai607873 | 3.3 | 0.018 | XM_129595 | ||
| 92673_at | Sh3gl2: endophilin I mRNA | 3.2 | 0.028 | NM_019535 | ||
| 101424_at | Nmi: n-mcy (and stat) interactor | 3.2 | 0.017 | NM_019401 | ||
| 161722_f_at | Gstm5: glutathione s-transferase, mu 5 | 3.2 | 0.047 | NM_010360 | ||
| 93146_at | Cldn8: claudin 8 | 3.1 | 0.030 | NM_018778 | ||
| 93908_f_at | LOC546093: similar to ige-binding protein | 3.0 | 0.045 | XM_620701 | ||
| 93974_at | Errfi1: erbb receptor feedback inhibitor 1 | 2.9 | 0.012 | NM_133753 | ||
| 101026_at | Pttg1: pituitary tumor transforming | 2.8 | 0.046 | NM_013917 | ||
| 162415_f_at | Cant1: calcium activated nucleotidase 1 | 2.8 | 0.031 | NM_001025617 | ||
| *2.77 | 0.001 | - | ||||
| 104206_at | 5730557B15Rik: riken cDNA 5730557b15 | 2.8 | 0.002 | NM_026153 | ||
| 160618_at | Lgals8: lectin, galactose binding, soluble 8 | 2.7 | 0.047 | NM_018886 | ||
| 104620_at | Tmem68: transmembrane protein 68 | 2.5 | 0.005 | NM_028097 | ||
| 103294_at | Rgs5: G protein signaling regulator RGS5 | 2.5 | 0.010 | NM_009063 | ||
| 100888_at | Sorl1: sortilin-related receptor, ldlr class a repeats-containing | 2.4 | 0.023 | NM_011436 | ||
| 97694_at | Tulp3: tubby-like protein 3 | 2.4 | 0.005 | NM_011657 | ||
| 93235_at | BB128963: expressed sequence bb128963 | 2.4 | 0.008 | NM_172742 | ||
| 101998_at | 4833420G17Rik: riken cDNA 4833420g17 | 2.3 | 0.005 | NM_026127 | ||
| 103871_at | Sec23ip: sec23 interacting protein | 2.3 | 0.034 | NM_001029982 | ||
| 100477_at | Tmem45a: transmembrane protein 45a | 2.3 | 0.022 | NM_019631 | ||
| *2.58 | 0.013 | - | ||||
| 93045_at | ABCD3: 70 kDa peroxisomal membrane protein | 2.2 | 0.008 | NM_008991 | ||
| *2.25 | 0.007 | - | ||||
| 101453_at | Mia1: mRNA for melanoma-inhibitory-activity protein | 2.2 | 0.006 | NM_019394 | ||
| *2.11 | 0.008 | - | ||||
| 97154_f_at | IMAGE clone 833843 | 2.2 | 0.020 | NA | ||
| 100332_s_at | Prdx6-rs1: peroxiredoxin 6, related sequence 1 | 2.2 | 0.029 | NM_177256 | ||
| 101735_f_at | Ang2: angiogenin, ribonuclease a family, member 2 | 2.2 | 0.018 | NM_007449 | ||
| 98960_s_at | B3galt3: UDP-Gal-betaGlcNAc beta 1,3-galactosyltranferase-III | 2.2 | 0.020 | NM_020026 | ||
| 97773_at | Cd34: cd34 antigen | 2.1 | 0.015 | NM_133654 | ||
| 95735_at | Nolc1: nucleolar and coiled-body phosphoprotein 1 | 2.1 | 0.033 | NM_053086 | ||
| 97867_at | Hsd11b1: mRNA for 11beta-hydroxysteroid dehydrogenase/carbonyl reductase | 2.1 | 0.048 | NM_008288 | ||
| *2.36 | 0.005 | - | ||||
| 162308_f_at | Cryab: crystallin, alpha b | 2.1 | 0.047 | NM_009964 | ||
| 92995_at | Vsnl1: visinin-like 1 | 2.0 | 0.034 | NM_012038, | ||
| 93609_at | Spg20: spastic paraplegia 20, spartin homolog | 2.0 | 0.029 | NM_144895 | ||
| 98922_at | Stt3a: Intergral membrane protein 1 | 2.0 | 0.014 | NM_008408 | ||
| 98547_at | Mrps12: mitochondrial ribosomal protein S12 | 2.1 | 0.012 | NM_011885 | ||
| *2.0 | 0.012 | - | ||||
| 160589_at | Ppig: peptidyl-prolyl isomerase g (cyclophilin g) | 2.0 | 0.042 | XM_130275 | ||
| 92955_at | Il3ra: Interleukin 3 receptor, alpha chain | 9.6 | 0.005 | NM_008369 | ||
| *6.31 | 0.007 | - | ||||
| 96918_at | Fbp1: fructose bisphosphatase 1 | 9.0 | 0.021 | NM_019395 | ||
| *4.64 | 0.003 | - | ||||
| 97997_at | Sfrp1: secreted frizzled related protein sFRP-1 | 7.8 | 0.047 | NM_013834 | ||
| *6.92 | 0.047 | - | ||||
| 98033_at | 1100001H23Rik: riken cDNA 1100001h23 | 7.4 | 0.012 | NM_025806 | ||
| *10.48 | 0.035 | - | ||||
| 93568_i_at | 2610042L04Rik: riken cDNA 2610042l04 | 5.6 | 0.007 | NM_025940 | ||
| *6.03 | 0.006 | - | ||||
| 93569_f_at | 2610042L04Rik: riken cDNA 2610042l04 | 4.3 | 0.011 | NM_025940 | ||
| *4.43 | 0.003 | |||||
| 104217_at | Gdpd3: glycerophosphodiester phosphodiesterase domain containing | 5.3 | 0.013 | NM_024228 | ||
| *5.27 | 0.006 | - | ||||
| 161043_r_at | Txnrd3: thioredoxin reductase 3 | 5.1 | 0.018 | NM_153162 | ||
| 95958_at | C76977: expressed sequence c76977 | 4.0 | 0.023 | NA | ||
| 102234_at | 1810037I17Rik: riken cDNA 1810037i17 | 4.0 | 0.001 | NM_024461 | ||
| *3.88 | 0.023 | - | ||||
| 92779_f_at | membrane glycoprotein | 3.8 | 0.030 | NA | ||
| 160306_at | Thrsp: thyroid hormone responsive spot14 homolog | 3.8 | 0.003 | NM_009381 | ||
| *2.71 | 0.027 | - | ||||
| 96586_at | Crygc: crystallin, gamma c | 3.7 | 0.027 | NM_007775 | ||
| 104444_at | 9430098E02Rik: riken cDNA 9430098e02 | 3.7 | 0.015 | NM_029865 | ||
| *3.53 | 0.033 | - | ||||
| 93370_at | Syt17: synaptotagmin xvii | 3.2 | 0.034 | NM_138649 | ||
| 98240_at | Il12rb1: interleukin 12 receptor, beta 1 | 2.5 | 0.049 | NM_008353 | ||
| 93137_at | Ntsr2: neurotensin receptor 2 | 2.5 | 0.030 | NM_008747 | ||
| 94061_at | Crip1: cysteine-rich protein 1 (intestinal) | 2.3 | 0.018 | NM_007763 | ||
| *3.11 | 0.001 | - | ||||
| 104538_at | Ptgis: prostacyclin synthase | 2.2 | 0.043 | NM_008968 | ||
| *2.48 | 0.043 | - | ||||
| 98865_at | Has2: hyaluronan synthase 2 | 2.2 | 0.022 | NM_008216 | ||
| 161564_r_at | X99384: cDNA sequence x99384 | 2.1 | 0.049 | NM_013753 | ||
| 101431_at | Rdh5: Retinol dehydrogenase type 5 | 2.1 | 0.012 | NM_134006 | ||
| 93469_at | Ephb3: eph receptor b3 | 2.0 | 0.004 | NM_010143 | ||
| 104755_at | Tnip1: TNFAIP3 (tumor necrosis factor, alpha-induced protein 3) interacting protein 1 | 2.0 | 0.021 | NM_021327 | ||
| 102938_at | Lect2: Leukocyte cell-derived chemotaxin 2 | 2.0 | 0.020 | NM_010702 | ||
| 92532_at | Avpr1a: V1a agrinine vasopression receptor | 2.0 | 0.031 | NM_016847 | ||
Probe sets with a two-fold or higher difference in expression level (p<0.05, student t-test with Bonferroni adjustment).
Fold differences in expression levels and p-value are listed under B6/129 or 129/B6 to reflect the strain with higher level of expression of that gene.
Fold difference and p-value for the comparison between the noise-exposed groups; listed only if a significant difference in expression level was also found in the comparison of the noise-exposed groups.
Genes were clustered using DAVID tools (http://david.abcc.ncifcrf.gov/gene2gene.jsp) according to their roles in a cellular process. If no cellular process was assigned to them, genes were alternatively clustered by specific molecular function, e.g., transcription factors known to function as regulators of the immune response are listed only under “immune response”.
Table 3.
Noise-Induced Gene Expression Changes in 129 and B6 Mice.
| Probe set a | Gene Symbol: Name | 129b | B6b | REFSEQ_ID | ||
|---|---|---|---|---|---|---|
| fold change | p-value | fold change | p-value | |||
| INDUCIBLE REGULATORS OF SIGNAL TRANSDUCTION PATHWAYS | ||||||
| 104646_at | Gdf15: growth differentiation factor 15 | 21.7 | 0.025 | NM_011819 | ||
| 92534_at | Gem: GTP binding protein (overexpressed in skeletal muscle) | 21.2 | 0.027 | NM_010276 | ||
| 94378_at | c16: regulator of G-protein signaling 16 | 2.6 | 0.027 | NM_011267 | ||
| 94384_at | Ier3: immediate early response 3 | 2.2 | 0.001 | NM_133662 | ||
| 160463_at | Myd116: myeloid differentiation primary response gene 116 | 2.1 | 0.039 | NM_008654 | ||
| 160651_at | Tacstd2: tumor-associated Ca2+ signal transducer 2 | 2.0 | 0.004 | NM_020047 | ||
| IMMUNE RESPONSE | ||||||
| 162206_f_at | Socs3: suppressor of cytokine signaling 3 | 8.6 | 0.007 | NM_007707 | ||
| 93858_at | Cxcl10: chemokine (C-X-C motif) ligand 10 | 4.3 | 0.004 | NM_021274 | ||
| 160092_at | Ifrd1: interferon-related developmental regulator 1 | 2.6 | 0.012 | NM_013562 | ||
| 161173_f_at | Ifi202b: interferon activated gene 202B | 2.6 | 0.032 | NM_011940 | ||
| 94774_at | Ifi202b: interferon activated gene 202B | 2.1 | 0.021 | NM_011940 | ||
| 99420_at | Igh-6: Immunoglobulin heavy chain 6 (IgM) | 2.4 | 0.033 | XM_111356 | ||
| 96694_at | Tcl1b1: T-cell leukemia/lymphoma 1B, 1 | −3.9 | 0.048 | NM_013773 | ||
| 161180_r_at | interferon activated gene 204 | −4.9 | 0.030 | NM_008329 | ||
| TRANSCRIPTION REGULATION/DNA BINDING | ||||||
| 103990_at | Fos: FBJ osteosarcoma oncogene | 4.9 | 0.000 | 6.8 | 0.000 | NM_010234 |
| 160894_at | Cebpd: CCAAT/enhancer binding protein (C/EBP), d | 3.4 | 0.000 | 2.4 | 0.040 | NM_007679 |
| 92925_at | Cebpb: CCAAT/enhancer binding protein (C/EBP), b | 3.1 | 0.040 | NM_009883 | ||
| 102362_i_at | Junb: Jun-B oncogene | 3.0 | 0.024 | NM_008416 | ||
| 102363_r_at | Junb: Jun-B oncogene | 2.8 | 0.047 | NM_008416 | ||
| 102900_at | Six3: sine oculis-related homeobox 3 homolog | 2.7 | 0.020 | NM_011381 | ||
| 160829_at | Phlda1: pleckstrin homology-like domain, family A, member 1 | 2.7 | 0.015 | NM_009344 | ||
| 94710_g_at | Gcm2: glial cells missing homolog 2 (Drosophila) | 2.6 | 0.040 | NM_008104 | ||
| 161903_f_at | Nfkbiz: nuclear factor of k light polypeptide gene enhancer in B-cells inhibitor, z | 2.6 | 0.010 | NM_030612 | ||
| 93528_s_at | Klf9: Kruppel-like factor 9 | 2.3 | 0.035 | NM_010638 | ||
| 93834_at | Hist1h2bp: histone cluster 1, H2bp | −4.1 | 0.010 | NM_178202 | ||
| 160841_at | Dbp: D site albumin promoter binding protein | −2.3 | 0.010 | NM_016974 | ||
| 101334_at | Nkx2-3: NK2 transcription factor related, locus 3 | −2.0 | 0.040 | NM_008699 | ||
| 95388_at | Hist1h1d: histone cluster 1, H1d | 4.4 | 0.040 | NM_145713 | ||
| 102579_f_at | Hoxa6: homeo box A6 | −2.5 | 0.040 | NM_010454 | ||
| 102963_at | E2f1: E2F transcription factor 1 | −2.6 | 0.040 | NM_007891 | ||
| KINASE ACTIVITY AND MODULATION OF KINASE ACTIVITY | ||||||
| 161666_f_at | Gadd45β: growth arrest & DNA-damage-inducible 45β | 6.2 | 0.000 | NM_008655 | ||
| 102779_at | Gadd45β: growth arrest & DNA-damage-inducible 45β | 6.1 | 0.004 | NM_008655 | ||
| 101979_at | Gadd45γ: growth arrest & DNA-damage-inducible 45γ | 2.4 | 0.041 | NM_011817 | ||
| 161295_r_at | Map4k4: mitogen-activated protein kinase kinase kinase kinase 4 | 2.4 | 0.007 | NM_008696 | ||
| 98067_at | Cdkn1a: cyclin-dependent kinase inhibitor 1A (P21) | 2.1 | 0.005 | NM_007669 | ||
| 98618_at | Dtymk: deoxythymidylate kinase | −2.2 | 0.026 | NM_023136 | ||
| PROTEIN STABILIZATION/FOLDING | ||||||
| 96679_at | Dnajb9: DnaJ (HSP40) homolog, subfamily B, member 9 | 2.9 | 0.043 | NM_013760 | ||
| 93875_at | HSPa1a: heat shock protein 1A | 2.7 | 0.006 | NM_010478 | ||
| GENES NOT CLUSTERED FUNCTIONALLY | ||||||
| 104647_at | Ptgs2: prostaglandin-endoperoxide synthase 2 | 5.4 | 0.013 | NM_011198 | ||
| 160606_r_at | Adamts1: a disintegrin-like and metallopeptidase (reprolysin type) with thrombospondin type 1 motif, 1 | 5.0 | 0.035 | NM_009621 | ||
| 96752_at | Icam1: intercellular adhesion molecule | 3.8 | 0.002 | NM_010493 | ||
| 101967_at | Sdf2: stromal cell derived factor 2 | 3.7 | 0.003 | NM_009143 | ||
| 95968_at | C77691: expressed sequence C77691 | 3.3 | 0.034 | NA | ||
| 161739_r_at | Pola2: polymerase (DNA directed), alpha 2 | 3.2 | 0.025 | NM_008893 | ||
| 160190_at | Syt4: synaptotagmin IV | 2.9 | 0.035 | NM_009308 | ||
| 162491_f_at | Prr6: proline-rich polypeptide 6 | 2.8 | 0.032 | XM_924431 | ||
| 103438_at | Dio2: deiodinase, iodothyronine, type II | 2.7 | 0.041 | NM_010050 | ||
| 95706_at | Lgals3: lectin, galactose binding, soluble 3 | 2.7 | 0.018 | NM_010705 | ||
| 92731_at | Ptx3: pentraxin related gene | 2.5 | 0.012 | NM_008987 | ||
| 104333_at | D17H6S56E-5: DNA segment, Chr 17, human D6S56E 5 | 2.4 | 0.037 | NA | ||
| 104598_at | Dusp1: dual specificity phosphatase 1 | 2.1 | 0.007 | NM_013642 | ||
| 98786_at | Gpr3: G-protein coupled receptor 3 | 2.1 | 0.036 | NM_008154 | ||
| 161585_at | Gp5: glycoprotein 5 (platelet) | 2.1 | 0.033 | NM_008148 | ||
| 99849_at | AI553587: expressed sequence AI553587 | 2.0 | 0.036 | NA | ||
| 162374_r_at | Myh8: myosin, heavy polypeptide 8, skeletal muscle | −5.5 | 0.015 | NM_177369 | ||
| 101809_at | C1ql1: complement component 1, q subcomponent-like 1 | −2.9 | 0.040 | NM_011795 | ||
| 93926_at | Prlr: prolactin receptor | −2.8 | 0.029 | NM_011169 | ||
| 98919_at | Tm2d2: TM2 domain containing 2 | −2.3 | 0.014 | NM_027194 | ||
| 161649_f_at | Art5: ADP-ribosyltransferase 5 | −2.1 | 0.002 | NM_007491 | ||
| 94357_at | Slc5a1: solute carrier family 5 (sodium/glucose cotransporter), member 1 | −2.0 | 0.041 | NM_019810 | ||
| 161929_at | Snrpa1: u2 small nuclear ribonucleoprotein polypeptide a′ | 3.0 | 0.048 | NM_021336 | ||
Probe sets with a two-fold or higher change in expression level (p<0.05, student t-test with Bonferroni adjustment), 6 h postexposure to a 1-h, 105-dB SPL, 10-kHz OBN.
Expression level mean fold changes and p values are listed for the inbred strains of mice in which there was a significant change (by criteria stated above; a). Negative sign indicates that the fold change given is the sham-exposed control/noise-exposed ratio; the expression level was lower after the noise exposure for those genes.
Genes were clustered by the same criteria as in Table 2.
2.8. Hierarchical Clustering Analysis
Hierarchical clustering analysis was performed according to the expression profiles of each gene using the dChip software noted above; such clustering of genes identifies potential coordinated regulation of expression by highlighting similar alterations in expression levels. Additionally, in the differentially expressed groups of genes, functional clusters were identified utilizing DAVID and medium stringency criteria; DAVID’s default criteria.
2.9. Immunocytochemistry and Immunofluorescence
Anesthetized mice were transcardially perfused with 4% paraformaldehyde in 0.1 M phosphate buffered saline (PBS). The temporal bones were isolated and the stapes removed. Cochleae were then perfused perilymphatically via the round window and immersed in fixative for 1 h. After rinsing in PBS, cochleae were decalcified in 120 mM EDTA (PBS, pH 7.4) at 23°C, dehydrated in a graded ethanol series, paraffin-embedded in pairs (two cochleae: a cochlea from the sham and a cochlea from the noise-exposed groups, were embedded together in one block for each strain), and sectioned at 6 μm in the midmodiolar plane. Slides were prepared in this manner containing tissues from each of three mice of the sham and three mice of the noise-exposed groups of each strain. Slides containing 129 cochlear sections and slides containing B6 cochlear sections were subsequently stained simultaneously in two sets of experiments, allowing the comparative interpretation of the results. In the first set, three B6 and three 129 slides were stained simultaneously in independent experiments for immunodetection of HSP70, GADD45β, and the p21cip1 proteins. For the second set of experiments, tissue sections in three B6 and one 129 slide, all containing tissues of the corresponding sham and noise-exposed groups, were stained simultaneously.
Immunoperoxidase was used for HSP70 detection. Rehydrated cochlear midmodiolar sections were incubated with rabbit anti-HSP70 (1:200) primary antibody (Santa Cruz Biotechnologies, Santa Cruz CA) overnight at 4°C. The sections were then washed and incubated for 2 h at 23°C with a biotinylated goat anti-rabbit secondary antibody followed by incubation with ABC complex (Vector Labs, Burlingame CA), and then DAB substrate (Sigma, fast-DAB tablets, St. Louis MO) for color development. Light microscopy (Olympus BH-2, Tokyo Japan) was used to capture the images with a digital camera (Spot RT) and associated image-analysis software (Diagnostic Instruments Inc, Sterling Heights MI).
For GADD45β and p21cip1-protein detection, immunofluorescence was employed. By this protocol, dehydrated midmodiolar sections were incubated with either a goat anti-GADD45β antibody (1:600) or a mouse monoclonal anti-p21cip1 antibody (1:100) overnight at 4°C (Santa Cruz Biotechnologies, Santa Cruz CA and Upstate Biotechnology, Dillerica MA, respectively). The next day, sections were washed and incubated for 2 h at room temperature with the corresponding secondary antibody consisting of either Alexa Fluor 647-labeled rabbit anti-goat (Molecular Probes, Carlsbad CA) or Cy5-labeled goat anti-mouse (Jackson Immuno Research Laboratories, West Grove PA) antibodies. Sections were then washed in PBS, a drop of mounting media containing DAPI (Vector Labs, Burlingame CA) was placed on the tissue, and the slides were cover-slipped. In each independent experiment, 1-μm images were collected using a confocal microscope (Zeiss LSM 510, Thornwood NY). In independent experiments, a 650- to 710-nm bandpass filter was used for imaging either the Alexa 647 or the Cy5 fluorescence associated with the GADD45β or p21cip1 immunoreactivity, respectively. The same settings were used on the confocal microscope to image the control and noise-exposed cochlear sections. Imaging software (LSM 5 Image Examiner, Zeiss, Thornwood NY) was used for data processing. Final illustrations were assembled using commercially available software (Adobe Photoshop v.7, San Jose CA).
3. Results
3.1. Inbred Strains of Mice Differ in Susceptibility to Noise Damage
The hearing sensitivity of each mouse used was evaluated within one week prior to the noise exposure. The average pre-exposure ABR thresholds at 8, 16, and at 32 kHz, were 32 ±3, 21 ±2, and 24 ±2 dB SPL (± SD) for the B6, 29 ±7, 16 ±3, and 44 ±5 for the 129X1 and 47 ±10, 37 ±10, and 38 ±8 for the 129S1 mice. Figure 1 illustrates the effects of the 1-h, 105-dB SPL, 10-kHz OBN exposure on the auditory function of the B6 (black bars), 129X1 (light gray bars), and 129S1 (dark gray bars) mice. Specifically, threshold shifts (TSs) measured immediately after exposure (Fig 1A) were significantly greater (ANOVA, df=2, f=70.483, p<0.001) for the B6 mice, which exhibited more than a 60-dB TS for all test stimuli. In contrast, the average TS detected immediately post-noise exposure for the 129S1 mice was less than 25 dB for all stimulus frequencies, while the TS of the 129X1 mice ranged from a maximum of 40 dB at 16 kHz to only 10 dB at 32 kHz. At 5 d post-exposure (Fig 1B), mice of both 129 substrains (129X1=light and 129S1=dark gray bars) exhibited essentially complete recovery from the TSs observed immediately post-exposure. For example, the TSs remaining at 5 d post-exposure in the 129 mice were 5 dB or less. The B6 mice (black bars in Fig 1B), however, demonstrated significantly less recovery (ANOVA, df=2, f=93.9 p<0.01) in that at 5 d post-exposure, TSs of approximately 40 dB remained for all test frequencies indicating that only 20 dB of recovery had occurred. The sham-exposed control counterparts for all three strains of mice were handled in the same manner as the noise-exposed mice and were also tested 5 d after their sham noise exposures. As expected, no TSs was detected for any of the sham-exposed control mice (data not shown).
Fig. 1.

Changes in hearing sensitivity immediately and 5 d post-noise exposure. A: Immediately after exposure to 1 h of a 10-kHz OBN presented at 105 dB SPL, 129S1/Svlmj (dark gray bars) and 129X1/SvJ (light gray bars) mice exhibited significantly less threshold shifts (TSs) at each test frequency (*=ANOVA, df=2, f=70.483, p<0.001) than did mice of B6.CAST strain (black bars). B: By 5 d post-noise exposure, the 129S1/SvImJ and 129X1/SvJ demonstrated complete recovery of hearing as tested by ABRs. In contrast, the B6.CAST showed only minimal recovery and continued to exhibit a loss of hearing sensitivity at all test frequencies. TSs were statistically different between noise-exposed B6.CAST and 129 mice for all frequencies tested (*=ANOVA, df=2, f=93.9 p< 0.01).
3.2. Gene Expression Profiling
Gene expression profiling was performed to identify molecular mechanisms likely to underlie the differences in susceptibility to noise damage exhibited by these mouse strains. On average, 60% of the sequences in each of the 10 arrays were found to be expressed, i.e., expression ranged from 57 to 61% of the 12,489 sequences. These gene-expression results can be accessed in the Gene Expression Omnibus (GEO Accession “GSE8342”; http://www.ncbi.nlm.nih.gov/projects/geo/query/acc.cgi?acc=GSE8342). Additionally, input of all array data blindly to the “Class Prediction” tool of BRB arrays (see Methods) yielded four classes of arrays matching the four groups listed in Table 1.
The gene-expression data were specifically inspected for the expression of several cochlear markers. Myosin IC (MYO IC), myosin VI (MYO VI), and α-tectorin, were detected over the background signal in all arrays. A fourth cochlear marker, myosin VIIA (MYO VIIA) was not detected in two of the ten arrays. This is reasonable since in gene expression experiments probe sets of low intensity, such as MYO VIIA, may be designated as “absent” in some arrays. The levels of MYO VIIA however were similar in all arrays (i.e., compare MYO VIIA intensity for each array in Table 1).
3.3. Gene Expression in the Cochleae of Mice Differing in Their Susceptibility to Noise Damage
The significantly differentially expressed genes when comparing gene expression in the control mice of the two strains are listed in Table 2. Table 2 is organized as nine clusters of functionally related genes in decreasing order of the strength of the functional association between the genes, and followed by the genes that were not clustered functionally (see Methods). Of 128 genes differentially expressed between the sham-exposed control mice of these different genetic backgrounds 6 genes were strongly associated with programmed cell death processes and thus are listed in the first cluster of Table 2. Three of these genes were higher in the B6 mice while the remaining three were higher in the 129 mice. 7 genes were functionally associated with immune response, and 6 genes were associated as modulators of kinase activity. All the genes associated with immune response as well as the genes clustered modulators of kinase activity were expressed at higher levels in the B6 than in the 129 control mice (shaded gray in Table 2). None of the other 7 functional clusters exhibit such a bias. The immune response cluster included the most robust difference between the strains; a 17.6 fold higher level of CD276 antigen mRNA in the B6 mice (see Table 2).
3.4. Noise-Induced Gene Expression Changes in the Cochleae of Mice Differing in Their Susceptibility to Noise Damage
Table 3 lists the Affymetrix probe sets significantly changed 6 h after the 1-h exposure. In comparison between the arrays from the noise- and sham-exposed 129 mice, the levels of expression of 54 genes were significantly changed, while only seven genes were significantly changed when the gene arrays from the noise-exposed B6 mice were compared to the ones from the B6 sham-exposed mice. Table 3 lists 56 probe sets including two probe sets for Junb and two probe sets GADD45β and thus corresponding to 54 genes. It was reassuring that for genes represented by two probe sets, the changes in expression measured by each probe set were in close agreement. For example, for the 129 mice, the two jun B oncogene (Junb) probe sets changed by 3.0 and 2.8 fold (p=0.024 and p=0.047, respectively), thus, providing further evidence for the validity of this approach.
Considering genes significantly changed when comparing the noise- and sham-exposed arrays for each strain, only Fos and C/EBP-d were in common in that they were significantly changed in both strains of mice after the noise exposure (highlighted in Table 3). Under the significance change criterion chosen (see Methods), the remaining significantly changed genes were unique between the two strains. Table 3 lists the 61 probe sets significantly changed after noise exposure, corresponding to 59 genes. Five clusters of functionally related genes were identified in this group (listed in Table 3 in order of the strength of the functional association). The functional clusters were: inducible regulators of signal transduction pathways (6 genes), immune response (7 genes), transcription regulation/DNA binding (15 genes), kinase activity and modulation of kinase activity (5 genes), and protein stabilization/folding (2 genes). The remaining genes were not functionally clustered. The most robust alteration in mRNA levels was detected for growth differentiation factor 15 (Gdf15), an immediate early gene. Specifically, the mRNA level for this gene in 129 mice increased 22 fold (p=0.027) after noise exposure. Also apparent in Table 3, Gem, another immediate early gene related to the RAS family of small GTP binding proteins, increased in 129 mice by 21 fold (p=0.025) following the noise exposure.
Hierarchical clustering of the 61 significantly changed probe sets was also performed according to the alteration in expression after noise exposure. A branch of the tree of clusters contained a cluster populated with genes that have functional roles in apoptotic signal pathways (e.g., genes identified by dChip as related to apoptosis have the gene symbol in blue in Fig 2). This branch is shown in Fig 2 and the expression level of each gene is indicated by color, i.e., the darkest blue to the darkest red represents the lowest to highest expression levels, respectively, with the lighter in-between shades symbolizing the intermediate levels of mRNA (see color key at bottom of figure). Of the 59 significantly changed genes, transcription factor E2F1 (included in Fig 2) was the only gene having ontogeny annotations in dChip relevant to apoptosis that did not cluster with the remainder of the apoptosis-related genes.
Fig. 2.

A branch of an expression profile analysis tree clustered apoptosis modulators differentially expressed after noise exposure in 129 mice. The gene expression levels are shown for each array, as indicated at the top of the figure (see Table 1). The mice were sacrificed 6 h after the exposure to a 1-h, 105-dB SPL, 10-kHz OBN or sham exposure. Gene clustering of all the differentially expressed probe sets was performed using dChip and according to their expression profiles. This branch cluster is shown because this branch segregated most of the differentially expressed genes known to modulate apoptosis pathways; including Cdkn1 encoding p21cip1, Hspa1a encoding HSP70, and Gadd45β encoding GADD45β (see text). The genes in blue type are the ones for which dChip assigned apoptosis Gene Ontology annotations. E2f1 was the only differentially expressed gene for which dChip contains apoptosis Gene Ontology annotations, and although it did not cluster with the other apoptosis-related genes, it is included in the figure. The color key at the bottom of the illustration indicates the amount of over- (reds) or under-expression (blues). C=control, N=noise exposed group; in the array names.
The expression levels for the genes in the clusters illustrated in Fig 2 were higher following noise exposure in contrast to the expression of E2F1, which was lower after noise. This decrease in expression was significant for the comparison of the B6 arrays; seemingly because the sham-exposed control levels of E2F1 mRNA in these mice were higher (see dark red only in B6 sham-exposed control arrays in Fig 2). A subset of transcription factors was upregulated in both strains of mice by the noise exposure. However, only two of the genes were significantly changed in both strains of mice, namely CCAAT/enhancer binding protein δ and FBJ osteosarcoma oncogene (Fos). Thus, using the criterion chosen the overall balance of noise- induced gene expression changes was unique for the noise-resistant and noise-susceptible mice.
Two of the differentially expressed genes when comparing the two genetic backgrounds were significantly changed by noise only in one of the strains (highlighted in Tables 2 and 3). Specifically, 3.9 fold higher levels of Gcm2 were detected in the B6 that in 129 mice and after the noise exposure this gene was upregulated in the 129 mice only (2.6 fold higher levels after noise exposure; Table 3). Also 3.3 higher baseline levels of Snrpa1 mRNA were detected in 129 mice than in B6 mice while this gene was 3 fold upregulated after noise exposure in the B6 mice but not in the 129 (Table 3).
3.5. Induced HSPs Expression after Noise Exposure in the Cochleae of Mice Highly Resistant to Noise Damage
HSPs are major contributors to a stress protection response and are well known to be upregulated in the cochlea by noise exposure. In the present study, significant upregulation was observed in the noise-exposed 129 mice for HSP70 (HSPa1a: heat shock protein 1A, Table 2 and Figs 2 and 3). It is also noteworthy that a significant upregulation of DnaJ (also called HSP40), a HSP70 chaperon protein, was detected as well in the 129 arrays. Immunohistochemistry for HSP70 was then performed to investigate the degree to which these alterations in mRNA expression translated into an increase of HSP70 protein as well as to identify in which cochlear cell types this change could be distinguished. As illustrated in Fig 3 and Fig 4, this analysis showed that immunoreactivity for HSP70 was present in both sham-exposed and noise-exposed cochleae. For example, in the sham-exposed control cochlea of Fig 3A, C, and E, HSP70 was localized to spiral ligament Types I and V fibrocytes to the organ of Corti, and to the spiral limbus. In the cochleae of the noise-exposed 129 mice, Fig 3B, D, and F show that HSP70 immunoreactivity increased in the lateral wall, in regions of type I and type IV fibrocytes, in the organ of Corti and in the spiral limbus when comparing HSP70 immunoreactivity of a noise-exposed versus a sham-exposed control cochlea.
Fig. 3.
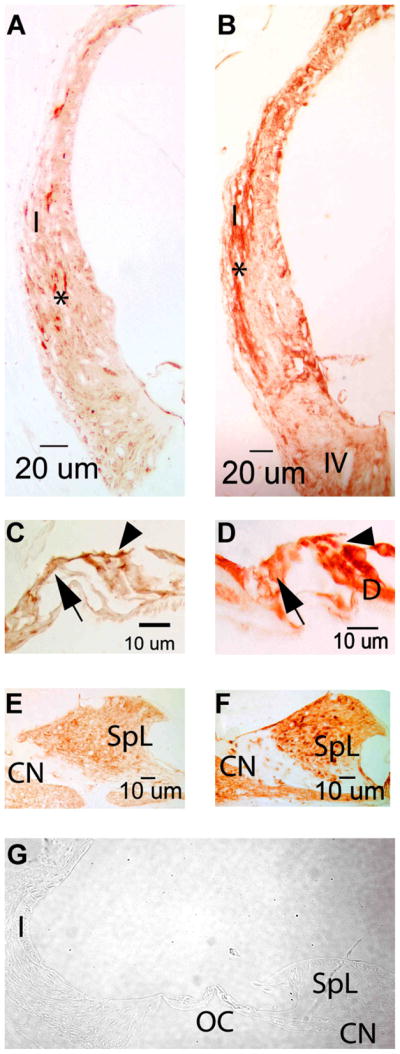
Noise exposure increased HSP70 immunoreactivity in the 129 mice cochlea. Immunoreactivity is noted in a number of cell types in cochleae from sham-exposed 129 mice (panels A, C and E) as well as in cochleae from noise-exposed 129 mice (panels B, D and F). The light reactivity evident in type I fibrocytes of the cochlear lateral wall (panel A, asterisk) was upregulated after noise exposure (panel B, asterisk). Reactivity in type IV fibrocytes is also noted post-noise exposure. No difference in the intensity of the immunoreactivity was noted in the sham-exposed and noise-exposed cochlea in the region of the inner hair cell (arrow, panels C and D) or outer hair cells (arrowhead, panels C and D). However, increased expression of HSP70 is detected in the Deiter cell (D) after noise exposure. (panel D vs C). The minimal reactivity noted in the fibrocytes of the spiral limbus (SpL) and in the cochlear nerve fibers (CN) in the sham-exposed mice is slightly upregulated following noise exposure (panels E and F). No immunoreactivity was detected in any of these cochlear sites when the primary antibody was omitted (panel G). I=type I fibrocytes, IV=type IV fibrocytes, D=Deiter cells, SpL=spiral limbus, CN=cochlear nerve.
FIG. 4.

Noise exposure increased HSP70 immunoreactivity in the Deiters cells of B6 mice. Immunoreactivity was noted in cochleae from sham-exposed B6 mice (panels A, C and E) as well as in cochleae from noise-exposed B6 mice (panels B, D and F). Light reactivity was evident in type I fibrocytes of the cochlear lateral wall in sham-exposed (panel A, I) and noise exposed B6 mice (panel B, I). No difference in the intensity of the immunoreactivity was noted in the sham-exposed and noise-exposed cochlea in the region of the inner hair cell (arrow, panels C and D) or outer hair cells (arrowhead, panels C and D). However, increased expression of HSP70 was detected in the Deiter cells (D) after noise exposure. (panel D vs C). The reactivity noted in the fibrocytes of the spiral limbus (SpL) and in the cochlear nerve fibers (CN) in the sham-exposed mice was unchanged by noise exposure (panels E and F). No immunoreactivity was detected in any of these cochlear sites when the primary antibody was omitted (data not shown). I=type I fibrocytes, D=Deiter cells, SpL=spiral limbus, CN=cochlear nerve.
Immunoreactivity for HSP70 was also detected in both sham-exposed and noise-exposed cochleae of B6 mice as shown in Fig 4. In contrast to the difference in HSP70 immunoreactivity intensity observed between sham-exposed and noise-exposed 129 cochleae (Fig 3), HSP70 immunoreactivity was similar in most cochlear structures from both groups of B6 mice with the exception that an increased expression of HSP70 was detected in the Deiter cells (D) after noise exposure (panel D vs C). Figure 4A, C, and E show HSP70 immunoreactivity in a sham-exposed control B6 cochlea and Fig 4B, D, and F illustrate a noise-exposed B6 cochlea. Comparable intensity of HSP70 immunoreactivity was localized to the stria vascularis, spiral ligament Types I and V fibrocytes and to the spiral limbus in both groups of B6 mice. Similar intensity of HSP70 immunoreactivity was also noted in the sham-exposed and noise-exposed cochlea in the region of the inner hair cell (arrow, panels C and D) or outer hair cells (arrowhead, panels C and D). HSP70 immunoreactivity of either group of B6 cochlea was more pronounced than HSP70 in the sham-exposed control 129 cochlea (compare Fig 3A, C, and E and Fig 4A, B, C, D, E and F), but generally less than the noise-exposed 129 cochlea (compare Fig 3B, D, and F and Fig 4A, B, C, D, E and F).
3.6. Significant Induction of GADD45 β and p21cip1 6 h After Noise Exposure in the Cochleae of Mice Highly Resistant to Noise Damage but not in the Cochleae of Susceptible Mice
The GADD45 proteins are emerging as powerful modulators of apoptosis. In the present study, two GADD45 genes, GADD45β and GADD45γ, were upregulated significantly following noise exposure in the resistant 129 mice as shown in both Fig 2 and Table 3. Additionally, there were two probe sets for GADD45β in the array used in this work. When the 129 noise-exposed arrays were compared to their 129 sham-exposed counterpart arrays, as indicated in Table 3, a 6.2 and a 6.1 fold increase in the levels of the GADD45β messenger were measured independently by each of the probe sets (p=0.000 and p=0.004, respectively, student t-test with Bonferroni adjustment). Moreover, Gadd45β was one of the genes differentially expressed between the noise-exposed arrays for mice of different genetic backgrounds, representing a genetic difference apparent only after the noise exposure. Three-fold greater GADD45β mRNA was detected in 129 noise-exposed arrays than in B6 noise-exposed arrays (p=0.025).
In addition to mRNA expression, the GADD45β protein expression was also explored as indicated in Fig 5, which shows cochlear sections stained with the GADD45β antibody. Figs 5B, D, and F illustrate the GADD45β immunofluorescence evident in sections from 129 mice that had been exposed to noise and sacrificed 6 h postexposure. In contrast, as shown in Figs 5A, C, and E virtually no immunoreactivity was detected in the cochleae of sham-exposed control mice. GADD45β immunofluorescence was most evident in the marginal cell region of the stria vascularis of noise-exposed 129 mice (arrows in Fig 5B). In contrast, identical staining conditions for the sham-exposed stria vascularis shown in Figs 5A revealed no GADD45β immunostaining. Enhanced GADD45β immunoreactivity following noise exposure was also evident in both the organ of Corti and spiral limbus. In noise-exposed cochleae, the localization of GADD45β to IHCs, OHCs, and some supporting cells is shown (arrowheads) in Fig 5D. Figures 5F demonstrate the presence of GADD45β in the interdental cells of the spiral limbus in noise-exposed 129 cochleae. Additionally, as shown in Fig 5, very strong immunofluorescence was observed in 8th nerve fibers after noise exposure when compared to corresponding sections from sham-exposed control mice were virtually no immunofluorescence was detected (Fig 5F vs. 5E). Further, no immunofluorescence was detected in experiments were the primary antibody was omitted (data not shown).
FIG. 5.

Noise exposure upregulated GADD45β in the cochlea of 129 mice. Immunofluorescence using a goat anti-GADD45β followed by anti-goat Alexa Fluor 647-labeled rabbit secondary antibody is shown with the phase-contrast light micrographs of the tissue to the right. Upregulation of the protein by noise exposure was noticeable in cochleae from noise-exposed 129 mice (panels B, D and F) when compared to their sham-exposed control mice (A, C, and E), which show little to no reactivity for GADD45β. Upregulation of GADD45β post-noise exposure was detected in the stria vascularis (arrows, panel B) and in the hair cell region of the organ of Corti (arrowheads, panel D). Moreover, the increased expression of GADD45β in the 8th nerve fibers in the osseous spiral lamina (asterisk, panel F) and in the interdental cells of the spiral limbus (arrow, panel F) was quite evident. No immunofluorescence was detected in experiments when the primary antibody was omitted (data not shown). The scale bar (panel F) applies to all panels.
p21cip1 is thought to have an antiapoptotic role by mediating protection from oxidative stress (O’Reilly et al., 2001; Zaman et al., 1999), which contributes to NIHL (reviewed in: (Henderson et al., 2006; Kopke et al., 1999). The present findings demonstrated the noise-induced upregulation of p21cip1 in the membranous labyrinth of resistant 129 mice. The mRNA level for p21cip1 was 2.1 fold higher (p=0.005) after noise exposure in resistant 129 mice as indicated in both Fig 2 and Table 3.
Using a p21cip1 antibody, p21cip1 protein expression was further investigated. Specifically, as shown in Figs 6B, D, and F, reactivity for p21cip1 was noted in sections from 129 mice that had been exposed to noise and sacrificed 6 h after the exposure whereas, as illustrated in Figs 6A, C, and E, virtually no reactivity was noted in cochleae from sham-exposed 129 mice. Figures 6B show p21cip1 immunofluorescence in the stria vascularis of noise-exposed mice. In contrast, no reactivity was noted in Figs 6A, which exhibit the sham-exposed stria vascularis. Localization of p21cip1 in the organ of Corti was associated with the hair cells as shown in Fig 6D. Following noise exposure, an intense immunofluorescence was observed in the 8th-nerve fibers of the osseous spiral lamina as shown in Fig 6F. A less intense reactivity was noted in the interdental cells of the spiral limbus, and only a faint reactivity was detected in the fibrocytes of the spiral limbus as seen in Figs 6F. No immunofluorescence was detected in experiments in which the primary antibody was omitted (data not shown).
Fig. 6.

Noise exposure upregulated p21cip1 in the cochleae of 129 mice. Immunofluorescence staining using a mouse monoclonal anti-p21cip1 followed by anti-mouse Cy5-labeled goat secondary antibody is shown with the phase-contrast light micrographs of the corresponding tissue to the right. Upregulation of p21cip1 by noise exposure was noticeable in cochleae from noise-exposed 129 mice (panels B, D and F) when compared to their sham-exposed control mice (A, C, and E), which show little to no reactivity for p21cip1. In the cochlea lateral wall an upregulation of the protein post-noise exposure was noted in the stria vascularis (arrows, panel B). In the organ of Corti, the upregulation of p21cip1 appeared most intense in the inner hair cells (arrowhead, panel D); however, immunoreactivity was also detected in the region of the outer hair cells (arrow, panel D). Strong immunofluorescence was observed in the 8th nerve fibers in the osseous spiral lamina (asterisk, panel F). No immunofluorescence was detected in experiments when the primary antibody was omitted (data not shown).
Cochleae sections of B6 mice were stained simultaneously with the 129 cochleae as described above, for p21cip1. However, no p21cip1 immunofluorescence was detected. No p21cip1 immunofluorescence was detected in the organ of Corti, osseous spiral lamina, or a portion of the spiral limbus tissues from B6 mice that had been exposed to noise and sacrificed 6 h after the exposure (data not shown, since all panels are completely black). Further, no p21cip1 immunofluorescence was noted in sham-exposed control B6 mice and there was no p21cip1 immunofluorescence detected in the lateral wall tissues of either group of B6 mice either (data not shown).
B6 cochleae were inspected for GADD45β protein expression in the same manner. A very faint GADD45β immunofluorescence detected in the 8th nerve fibers in the osseous spiral lamina from a B6 mouse exposed to noise and sacrificed 6 h after the exposure (data not shown). No GADD45β immunofluorescence was detected in lateral wall tissues of these mice. GADD45β immunofluorescence was not detected either in cochleae from two other noise-exposed B6 mice, stained in the same manner. In sham-exposed control B6 mice, no GADD45β immunofluorescence was detected (data not shown). In contrast to this higher intensity of GADD45β immunofluorescence was consistently noted in noise-exposed 129 cochleae as is evident in Fig 5 panels B, D, and F.
4. Discussion
4.1. Inbred Mice Differ with Respect to Their Susceptibility to NIHL
The pre-exposure ABR thresholds of the mice used in this study was in close agreement to previously reported values (Johnson et al., 1997). The B6 mice is a congenic strain corrected for the age related hearing loss exhibited by the C57/BL6J; as expected, no loss of hearing sensitivity was noted in these mice by ten weeks of age. On the other hand, by this age, the 129 mice exhibited slightly elevated ABR thresholds, as reported previously (Zheng et al., 1999). Susceptibility to noise damage was demonstrated to be dependent on the specific genotype (Jimenez et al., 2001; Ohlemiller et al., 2007). Mice of two 129 substrains, 129Sv/Ev (Yoshida et al., 2000) and 129X1 are known to exhibit very high resistance to NILH. The data presented here demonstrate that yet another 129 substrain, the 129S1, not previously studied with regards to NIHL, incurred no permanent loss of hearing after the noise exposure used in this study. In contrast, a 40-dB elevation of hearing thresholds persisted in the B6 mice (Fig 1). Thus, the B6 congenic mice, carrying the wildtype Ahl allele, which is not expected to contribute to the effects of noise overexposure is more susceptible to noise damage than the 129 strains. Deficient ahl alleles exacerbate noise susceptibility (Sliwinska-Kowalska et al., 2008). However, it has also been demonstrated that other factors, besides ahl, are involved in the cochlea’s response to noise overexposure (Harding et al., 2005). The NIHL incurred in the B6 mice in this study supports this.
4.2. Noise-induced Gene Expression Changes in the Cochleae of Mice with Distinct Susceptibility to NIHL
The gene-expression comparisons between the sham-exposed control 129 and B6 mice as well as the noise-exposed 129 and B6 arrays reflect differences in the genetic background of these inbred mouse strains. Understandably, many of these differences may not be relevant to the differences in noise susceptibility, which is the primary interest of the present work. To test the hypothesis that resistance to NIHL reflects the ability of specific cell types in the cochlea to induce protective mechanisms such as the ability to upregulate genes required to maintain or restore normal cochlear function, the noise-induced changes in gene expression were determined in mice exhibiting very different susceptibilities to NIHL. Only conspicuous differences between the two genetic backgrounds (Table 2) and noise-induced changes in gene expression are presented here (Table 3). A more stringent significance criterion than the default settings for dChip, which has as default a 1.2-fold difference, was set (see Methods). No previous comparisons of gene expression levels have been made in the cochlea between mice of different genetic backgrounds. Notably, basal levels of genes involved in modulation of kinase activity (a cluster of 6 genes) and genes clustered as related to immune response (a cluster of 7 genes) were expressed at higher levels in B6 than in 129 mice (shaded gray in Table 2). The latter may be interpreted as an ongoing inflammatory process in the B6 cochlea but further research is required to understand these differences.
It has been demonstrated that noise exposure activates an immune response in the cochlea (Hirose et al., 2005; Miyao et al., 2008; Tornabene et al., 2006). In this current work, upregulation of a set of genes involved in immune response was detected 6 hrs following the exposure in 129 mice which did not incur hearing loss (Table 3). The most robust of these immune response changes is an eight-fold increase in Socs3 expression. This was in contradiction with two previous comprehensive gene expression studies which did not detect upregulation of Socs3 in rats following a noise exposure (Cho et al., 2004; Kirkegaard et al., 2006). Notably, Socs3 down-regulates the JAK/STAT pathway by recruiting cytokines receptors for proteolysis and is considered to be anti-inflammatory and protective (for example, see Hotson et al., 2009 and Sutherland et al., 2007). In agreement with the previous gene expression studies, however, upregulation of Cxcl10 was noted following the noise exposure in 129 mice (Table 3). Definitely, further research is required to determine if the increased expression of Socs3 has a role in protection from NIHL in 129 mice as well as to confirm and understand the significance of the differentially expressed immune-response genes to noise-induced processes in the cochlea.
The noise–induced gene expression findings in this study are generally in agreement with previous studies that have reported the noise-induced upregulation of transcription factors and immediate early genes in the cochlea (Cho et al., 2004; Kirkegaard et al., 2006), although those studies investigated different time periods after noise over-stimulation. The present microarray experiments detected a 4.9- and 6.8-fold noise-induced increase in Fos mRNA in the 129 and B6 mice, respectively (p<0.001, see Table 3). This was consistent with previous studies which demonstrated increase in the expression of Fos protein and of AP-1 binding to DNA in the in the guinea pig cochlea after acoustic trauma (Ogita et al., 2000). Noise-induced Fos expression was also detected following noise exposure in the cochleae of rats in a previous microarray study (Cho et al., 2004). Immunocytochemistry studies by other investigators additionally demonstrated a remarkable increase in Fos expression shortly after noise exposure in the supporting cells of the organ of Corti (Shizuki et al., 2002). Supporting cells are important for survival of adult spiral ganglion neurons (Stankovic et al., 2004; Sugawara et al., 2005) and likely contribute to the functional effects of noise over-exposure.
To investigate the molecular basis of the resistance to noise overstimulation we focused on genes known to be involved in a protective response to stress or in cell-survival signaling pathways upregulated by noise in resistant 129 mice. These genes included HSP70, HSP40, GADD45β, and p21cip1. It is conceivable that early upregulation of these factors contributes synergistically to inhibition of apoptosis.
HSPs are major components of a protective cellular response to stress. HSP70 deficient mice show more extensive infarcts due to unrestrained apoptotic mechanisms (Lee et al., 2004). HSP27, 70, and 72 are known to be expressed in the cochlea and have been shown to be upregulated specifically by noise over-exposure (Gower et al., 1997; Leonova et al., 2002; Lim et al., 1993; Neely et al., 1991). However, it was important to learn whether there was a difference between mice strains exhibiting very distinct susceptibilities to noise damage and different functional outcomes after the noise exposures used in our study. In the resistant 129 strain, HSP70 and HSP40--a chaperone of HSP70 that has not been previously studied in the cochlea--were both significantly upregulated following noise exposure (see Table 3 and Figs 2 and 3). In B6 mice, no upregulation of the HSP70 mRNA level was noted and comparable intensity of HSP70 immunoreactivity was noted in the sham-exposed and noise-exposed mice in most regions of the cochlea (Fig 4). However, an increased HSP70 immunoreactivity was noted in the Deiter cells after noise exposure. Because Deiter cells are a small subset of the cells in the cochlea it is reasonable that no significant increase in HSP70 mRNA was detected after noise exposure in B6 mice (Fig 2 and 4). Immunocytochemical studies by other investigators demonstrated that noise over-exposure induces an accumulation of HSP72 protein, specifically in the stria vascularis and the OHCs (Gower et al., 1997; Leonova et al., 2002; Lim et al., 1993; Neely et al., 1991). Additionally, overexpression of HSP70 conferred significant neuroprotection by reducing caspase-8 and caspase-9 activation in a mouse model of hypoxia injury (Matsumori et al., 2006; Matsumori et al., 2005).
The induction of GADD45β expression by noise overstimulation found in highly resistant 129 mice may contribute to protection from apoptosis, and therefore from NIHL. In previous studies, GADD45β was demonstrated to suppress JNK apoptotic signaling (De Smaele et al., 2001), which is involved in hearing loss after noise exposure. Specifically, GADD45β was demonstrated to bind JNK kinase MKK7/JNKK2 and to halt its catalytic activity (Papa et al., 2007; Papa et al., 2004). MKK7 is a requisite activator of JNK in this pathway. Sequestration of MKK7 by GADD45β prevented the activation of JNK and subsequent cell death. Additionally, experiments with cell-permeable peptides demonstrated that GADD45β was required for efficient blocking of TNF-α–induced killing (De Smaele et al., 2001; Papa et al., 2004). De Smaele et al. (2001) found that GADD45β was upregulated rapidly through a mechanism that requires NF-κβ and that the NF-κβ anti-apoptotic functions depended on the suppression of JNK activation. The NF-κβ and JNK pathways are both affected by the transcriptional activation of GADD45β. Furthermore, GADD45β may be involved in additional pathways and perform other functions, since its induction was also proposed to regulate apoptosis by direct interaction with the cell cycle kinase inhibitor, p21cip1 (Kearsey et al., 1995).
Significantly, p21cip1 was also upregulated after noise exposure in the resistant 129 mice and increased protein expression was detected after the noise exposure (see Figs 2 and 6 and Table 3). The functions of p21cip1 are highly multifaceted but importantly, its induction has been linked to resistance to cell death after various cellular insults, (Besson et al., 2008; O’Reilly, 2005). Notably, after hyperoxia-induced oxidative DNA damage, cell death was more prevalent in p21cip1-deficient mice epithelia than in control mice (O’Reilly et al., 2001). In agreement with an antiapoptotic role for p21cip1, the protective effect of iron chelators in cortical neuronal cultures after oxidative stress has been correlated with upregulation of this protein (Zaman et al., 1999). In hair cells of the mouse organ of Corti, p21cip1 was expressed at embryonic day 14.5 and it remained expressed by postnatal day 6 but was not detected in the adult (Mantela et al., 2005). Mice deficient for p21cip1 expression exhibited no aberrant hearing phenotype. However, deficiency of p21cip1 expression exacerbated a mild progressive hair cell loss phenotype exhibited by mice deficient for expression of p19Ink4d, another cyclin-dependent kinase inhibitor (Chen et al., 2003; Laine et al., 2007).
Other genes of interest have not been previously investigated in the cochlea either. For example, a large body of work by other investigators has demonstrated powerful positive as well as negative cell-type specific regulation of apoptosis by Ier3, which increased by 2.2 fold in resistant 129 mice (Table 3). In vivo constitutive expression of Ier3 prevented specific subpopulations of lymphocytes, but not others, from undergoing apoptosis. T cells were precluded from undergoing apoptosis in transgenic mice over-expressing this gene resulting in mice that suffered from a high incidence of T cell lymphoma (Garcia et al., 2002; Wu, 2003; Zhang et al., 2002). Still, another finding pointing to new avenues for future research is the noise-induced decrease in the expression of histone H2B type 1-P (Hist1h2bp) mRNA detected in the resistant 129 mice (−4.1 fold, p=0.01, Table 3). This finding warrants further study, because during apoptosis, Hist1h2bp is known to undergo phosphorylation and such modification facilitates apoptotic chromatin condensation (Ajiro, 2000). It is tempting to speculate that, if there are lower levels of this H2B specific form, Hist1h2bp, then other H2B isoforms, which do not undergo the phosphorylation supporting apoptosis, could be assembled into the nucleosomes, thus decreasing apoptotic DNA condensation. Clearly the contribution of such mechanisms to NIHL needs to be tested and additional lines of research are required.
The comprehensive study of noise-induced gene expression changes in the cochleae of rats by Kirkegaard et al. (2006) utilized an impulse noise exposure protocol resulting in hair cell apoptosis and deafness. Significantly, the differentially expressed genes 3 h (34 genes) and 24 h (30 genes) postexposure in this report did not include the potentially protective changes in gene expression described here for the resistant 129. Indeed, the GADD45β and p21cip1 noise-induced upregulation described in the current report has only been detected in the resistant 129 mice. These gene expression results were confirmed by the detection of significantly enhanced GADD45β and p21cip1 immunofluorescence following noise exposure in the 129 but not in the B6 mice cochleae (see Figs 5, and 6). Further, immunofluorescence for both of these proteins was enhanced in cochlear cell types known to be affected by noise overstimulation. That is, IHCs and OHCs, cochlear nerve fibers, fibrocytes of the spiral limbus, as well as cells in the stria vascularis, were strongly stained in 129 noise-exposed mice, but not in their sham-exposed control counterparts or in the B6 mice.
Considering the differences in the noise-induced gene expression changes found between the mouse strains, sequence variations linked to HSPa1a, Gadd45β, and Cdkn1a genes are of special interest. The differences in the regulation of the expression of these genes may be due to sequence differences between the strains at those loci, but also to the downstream effects of a genetic difference at another locus. No simple nucleotide polymorphisms (SNPs) are linked to the Gadd45β gene [http://www.ncbi.nlm.nih.gov, http://bioinfo.embl.it/SnpApplet/, http://mouse.perlegen.com (Frazer et al., 2007)]. However, SNPs have been annotated about 2500 nucleotides to the 5′ end of the Gadd45β gene, and these may include variations in regulatory sequences. Additionally, 25 SNPs are linked to HSPa1a and 138 SNPs are linked to Cdkn1a. Some of these SNPs include sequence differences between C57BL/6J and 129SvJ 129X1. The B6 strain is a congenic strain of the C57BL/6J and except for the Ahl locus, in chromosome 10, these strains are genetically equivalent. The HSPa1a and Cdkn1a genotype, in chromosome 17 are the same as the genotype of the C57BL/6J mice. Notably, human polymorphisms in the HSP70 gene have been correlated with the individual’s susceptibility to NIHL (Chang et al., 2010). Further research is required to determine if the sequence variations noted above contribute to the resistance to NIHL exhibited by 129 mice.
In summary, gene expression differences induced by a noise exposure without detrimental functional consequences for mice of the 129 strain were revealed. Although the implications of the upregulation of these genes and proteins are not understood, their functional capabilities are known to be complex. For example, GADD45β and p21cip1 are likely to influence various interrelated cellular pathways and there is strong evidence for the antiapoptotic roles of these proteins. The increased expression of HSP70, GADD45β, and p21cip1 may contribute to the resistance to NIHL observed in 129 mice. Additionally, the possibility of coordinated signaling resulting in the induction of p21cip1 and GADD45β has been proposed, by other investigators (Kearsey et al., 1995; Wang et al., 2005). These findings may contribute to the design of novel interventions against NIHL using endogenous protective mechanisms known to interfere with pathways of cell death.
Research Highlights.
Different noise effects in gene expression accompany distinct functional outcomes.
Expression of strong modulators of apoptosis is induced by noise in resistant mice.
Induced p21cip1 and Gadd45β protein levels may contribute to protection from NIHL.
Acknowledgments
We would like to thank Barden B. Stagner for assistance with the preparation of the illustrations. This research was supported by the Public Health Service NIH-NIDCD grants DC006442 (MAG) and DC005578 (AEV).
Abbreviations
- 129
combined 129X1/SvJ and 129S1/SvlmJ mouse substrains
- B6.CAST-Cdh23CAST/J
congenic mouse strain derived from C57BL/6J but carrying the ahl allele of the Cast/Ei and abbreviated here as B6
- d
day(s)
- dB
decibel
- E2F1
E2F transcription factor 1
- GADD45
growth arrest and DNA damage inducible protein 45
- Gdf15
growth differentiation factor 15
- h
hour(s)
- HSP
heat shock protein as in HSP40 and HSP70
- Hz
Hertz
- Ier3
Ier3 protein contributing to regulation of T cell proliferation
- IHC
inner hair cell
- JNK
c-Jun N-terminal kinase
- kHz
kilohertz
- MOLF
MOLF/EiJ inbred mouse strain
- MPKK7
mitogen-activated protein kinase kinase 7
- mRNA
messenger RNA
- NIHL
noise-induced hearing loss
- OBN
octave band of noise
- OHC
outer hair cell
- p21cip1
cyclin-dependent kinase -interacting protein 1
- RT-PCR
reverse transcription polymerase chain reaction
- SD
standard deviation
- SGNs
spiral ganglion neurons
Footnotes
Publisher's Disclaimer: This is a PDF file of an unedited manuscript that has been accepted for publication. As a service to our customers we are providing this early version of the manuscript. The manuscript will undergo copyediting, typesetting, and review of the resulting proof before it is published in its final citable form. Please note that during the production process errors may be discovered which could affect the content, and all legal disclaimers that apply to the journal pertain.
References
- Ahn JH, Kang HH, Kim YJ, Chung JW. Anti-apoptotic role of retinoic acid in the inner ear of noise-exposed mice. Biochem Biophys Res Commun. 2005;335:485–90. doi: 10.1016/j.bbrc.2005.07.114. [DOI] [PubMed] [Google Scholar]
- Ajiro K. Histone H2B phosphorylation in mammalian apoptotic cells. An association with DNA fragmentation. J Biol Chem. 2000;275:439–43. doi: 10.1074/jbc.275.1.439. [DOI] [PubMed] [Google Scholar]
- Besson A, Dowdy SF, Roberts JM. CDK inhibitors: cell cycle regulators and beyond. Developmental cell. 2008;14:159–69. doi: 10.1016/j.devcel.2008.01.013. [DOI] [PubMed] [Google Scholar]
- Bohne BA, Harding GW, Lee SC. Death pathways in noise-damaged outer hair cells. Hear Res. 2007;223:61–70. doi: 10.1016/j.heares.2006.10.004. [DOI] [PubMed] [Google Scholar]
- Chen P, Zindy F, Abdala C, Liu F, Li X, Roussel MF, Segil N. Progressive hearing loss in mice lacking the cyclin-dependent kinase inhibitor Ink4d. Nature cell biology. 2003;5:422–6. doi: 10.1038/ncb976. [DOI] [PubMed] [Google Scholar]
- Cho Y, Gong TW, Kanicki A, Altschuler RA, Lomax MI. Noise overstimulation induces immediate early genes in the rat cochlea. Brain Res Mol Brain Res. 2004;130:134–48. doi: 10.1016/j.molbrainres.2004.07.017. [DOI] [PubMed] [Google Scholar]
- Davis RR, Kozel P, Erway LC. Genetic influences in individual susceptibility to noise: a review. Noise Health. 2003;5:19–28. [PubMed] [Google Scholar]
- De Smaele E, Zazzeroni F, Papa S, Nguyen DU, Jin R, Jones J, Cong R, Franzoso G. Induction of gadd45beta by NF-kappaB downregulates pro-apoptotic JNK signalling. Nature. 2001;414:308–13. doi: 10.1038/35104560. [DOI] [PubMed] [Google Scholar]
- Derijard B, Hibi M, Wu IH, Barrett T, Su B, Deng T, Karin M, Davis RJ. JNK1: a protein kinase stimulated by UV light and Ha-Ras that binds and phosphorylates the c-Jun activation domain. Cell. 1994;76:1025–37. doi: 10.1016/0092-8674(94)90380-8. [DOI] [PubMed] [Google Scholar]
- Engstrom H, Ades HW, Bredberg G. Normal structure of the organ of Corti and the effect of noise-induced cochlear damage. Sensorineural hearing loss; Ciba Found Symp; 1970. pp. 127–56. [DOI] [PubMed] [Google Scholar]
- Fortunato G, Marciano E, Zarrilli F, Mazzaccara C, Intrieri M, Calcagno G, Vitale DF, La Manna P, Saulino C, Marcelli V, Sacchetti L. Paraoxonase and superoxide dismutase gene polymorphisms and noise-induced hearing loss. Clin Chem. 2004;50:2012–8. doi: 10.1373/clinchem.2004.037788. [DOI] [PubMed] [Google Scholar]
- Frazer KA, Eskin E, Kang HM, Bogue MA, Hinds DA, Beilharz EJ, Gupta RV, Montgomery J, Morenzoni MM, Nilsen GB, Pethiyagoda CL, Stuve LL, Johnson FM, Daly MJ, Wade CM, Cox DR. A sequence-based variation map of 8.27 million SNPs in inbred mouse strains. Nature. 2007;448:1050–3. doi: 10.1038/nature06067. [DOI] [PubMed] [Google Scholar]
- Fredelius L. Time sequence of degeneration pattern of the organ of Corti after acoustic overstimulation. A transmission electron microscopy study. Acta Otolaryngol. 1988;106:373–85. doi: 10.3109/00016488809122260. [DOI] [PubMed] [Google Scholar]
- Fredelius L, Rask-Andersen H. The role of macrophages in the disposal of degeneration products within the organ of corti after acoustic overstimulation. Acta Otolaryngol. 1990;109:76–82. doi: 10.3109/00016489009107417. [DOI] [PubMed] [Google Scholar]
- Garcia J, Ye Y, Arranz V, Letourneux C, Pezeron G, Porteu F. IEX-1: a new ERK substrate involved in both ERK survival activity and ERK activation. The EMBO journal. 2002;21:5151–63. doi: 10.1093/emboj/cdf488. [DOI] [PMC free article] [PubMed] [Google Scholar]
- Gower VC, Thompson AM. Localization of inducible heat shock protein mRNA in the guinea pig cochlea with a nonradioactive in situ hybridization technique. Laryngoscope. 1997;107:228–32. doi: 10.1097/00005537-199702000-00016. [DOI] [PubMed] [Google Scholar]
- Harding GW, Bohne BA, Vos JD. The effect of an age-related hearing loss gene (Ahl) on noise-induced hearing loss and cochlear damage from low-frequency noise. Hear Res. 2005;204:90–100. doi: 10.1016/j.heares.2005.01.004. [DOI] [PubMed] [Google Scholar]
- Henderson D, Bielefeld EC, Harris KC, Hu BH. The role of oxidative stress in noise-induced hearing loss. Ear Hear. 2006;27:1–19. doi: 10.1097/01.aud.0000191942.36672.f3. [DOI] [PubMed] [Google Scholar]
- Hirose K, Discolo CM, Keasler JR, Ransohoff R. Mononuclear phagocytes migrate into the murine cochlea after acoustic trauma. J Comp Neurol. 2005;489:180–94. doi: 10.1002/cne.20619. [DOI] [PubMed] [Google Scholar]
- Hotson AN, Hardy JW, Hale MB, Contag CH, Nolan GP. The T cell STAT signaling network is reprogrammed within hours of bacteremia via secondary signals. J Immunol. 2009;182:7558–68. doi: 10.4049/jimmunol.0803666. [DOI] [PMC free article] [PubMed] [Google Scholar]
- Hu BH, Henderson D, Nicotera TM. Involvement of apoptosis in progression of cochlear lesion following exposure to intense noise. Hear Res. 2002;166:62–71. doi: 10.1016/s0378-5955(02)00286-1. [DOI] [PubMed] [Google Scholar]
- Jacono AA, Hu B, Kopke RD, Henderson D, Van De Water TR, Steinman HM. Changes in cochlear antioxidant enzyme activity after sound conditioning and noise exposure in the chinchilla. Hear Res. 1998;117:31–8. doi: 10.1016/s0378-5955(97)00214-1. [DOI] [PubMed] [Google Scholar]
- Jimenez AM, Stagner BB, Martin GK, Lonsbury-Martin BL. Susceptibility of DPOAEs to sound overexposure in inbred mice with AHL. J Assoc Res Otolaryngol. 2001;2:233–45. doi: 10.1007/s101620010044. [DOI] [PMC free article] [PubMed] [Google Scholar]
- Johnson KR, Erway LC, Cook SA, Willott JF, Zheng QY. A major gene affecting age-related hearing loss in C57BL/6J mice. Hear Res. 1997;114:83–92. doi: 10.1016/s0378-5955(97)00155-x. [DOI] [PubMed] [Google Scholar]
- Kearsey JM, Coates PJ, Prescott AR, Warbrick E, Hall PA. Gadd45 is a nuclear cell cycle regulated protein which interacts with p21Cip1. Oncogene. 1995;11:1675–83. [PubMed] [Google Scholar]
- Kirkegaard M, Murai N, Risling M, Suneson A, Jarlebark L, Ulfendahl M. Differential gene expression in the rat cochlea after exposure to impulse noise. Neuroscience. 2006;142:425–35. doi: 10.1016/j.neuroscience.2006.06.037. [DOI] [PubMed] [Google Scholar]
- Kopke R, Allen KA, Henderson D, Hoffer M, Frenz D, Van de Water T. A radical demise. Toxins and trauma share common pathways in hair cell death. Ann N Y Acad Sci. 1999;884:171–91. doi: 10.1111/j.1749-6632.1999.tb08641.x. [DOI] [PubMed] [Google Scholar]
- Kyriakis JM, Banerjee P, Nikolakaki E, Dai T, Rubie EA, Ahmad MF, Avruch J, Woodgett JR. The stress-activated protein kinase subfamily of c-Jun kinases. Nature. 1994;369:156–60. doi: 10.1038/369156a0. [DOI] [PubMed] [Google Scholar]
- Laine H, Doetzlhofer A, Mantela J, Ylikoski J, Laiho M, Roussel MF, Segil N, Pirvola U. p19(Ink4d) and p21(Cip1) collaborate to maintain the postmitotic state of auditory hair cells, their codeletion leading to DNA damage and p53-mediated apoptosis. J Neurosci. 2007;27:1434–44. doi: 10.1523/JNEUROSCI.4956-06.2007. [DOI] [PMC free article] [PubMed] [Google Scholar]
- Leonova EV, Fairfield DA, Lomax MI, Altschuler RA. Constitutive expression of Hsp27 in the rat cochlea. Hear Res. 2002;163:61–70. doi: 10.1016/s0378-5955(01)00379-3. [DOI] [PubMed] [Google Scholar]
- Lim HH, Jenkins OH, Myers MW, Miller JM, Altschuler RA. Detection of HSP 72 synthesis after acoustic overstimulation in rat cochlea. Hear Res. 1993;69:146–50. doi: 10.1016/0378-5955(93)90102-7. [DOI] [PubMed] [Google Scholar]
- Lomax MI, Gong TW, Cho Y, Huang L, Oh SH, Adler HJ, Raphael Y, Altschuler RA. Differential Gene Expression Following Noise Trauma in Birds and Mammals. Noise Health. 2001;3:19–35. [PubMed] [Google Scholar]
- Mantela J, Jiang Z, Ylikoski J, Fritzsch B, Zacksenhaus E, Pirvola U. The retinoblastoma gene pathway regulates the postmitotic state of hair cells of the mouse inner ear. Development (Cambridge, England) 2005;132:2377–88. doi: 10.1242/dev.01834. [DOI] [PMC free article] [PubMed] [Google Scholar]
- Matsumori Y, Northington FJ, Hong SM, Kayama T, Sheldon RA, Vexler ZS, Ferriero DM, Weinstein PR, Liu J. Reduction of caspase-8 and -9 cleavage is associated with increased c-FLIP and increased binding of Apaf-1 and Hsp70 after neonatal hypoxic/ischemic injury in mice overexpressing Hsp70. Stroke; a journal of cerebral circulation. 2006;37:507–12. doi: 10.1161/01.STR.0000199057.00365.20. [DOI] [PubMed] [Google Scholar]
- Matsumori Y, Hong SM, Aoyama K, Fan Y, Kayama T, Sheldon RA, Vexler ZS, Ferriero DM, Weinstein PR, Liu J. Hsp70 overexpression sequesters AIF and reduces neonatal hypoxic/ischemic brain injury. J Cereb Blood Flow Metab. 2005;25:899–910. doi: 10.1038/sj.jcbfm.9600080. [DOI] [PubMed] [Google Scholar]
- Neely JG, Thompson AM, Gower DJ. Detection and localization of heat shock protein 70 in the normal guinea pig cochlea. Hear Res. 1991;52:403–6. doi: 10.1016/0378-5955(91)90028-8. [DOI] [PubMed] [Google Scholar]
- Noben-Trauth K, Zheng QY, Johnson KR. Association of cadherin 23 with polygenic inheritance and genetic modification of sensorineural hearing loss. Nat Genet. 2003;35:21–3. doi: 10.1038/ng1226. [DOI] [PMC free article] [PubMed] [Google Scholar]
- O’Reilly MA. Redox activation of p21Cip1/WAF1/Sdi1: a multifunctional regulator of cell survival and death. Antioxidants & redox signaling. 2005;7:108–18. doi: 10.1089/ars.2005.7.108. [DOI] [PubMed] [Google Scholar]
- O’Reilly MA, Staversky RJ, Watkins RH, Reed CK, de Mesy Jensen KL, Finkelstein JN, Keng PC. The cyclin-dependent kinase inhibitor p21 protects the lung from oxidative stress. Am J Respir Cell Mol Biol. 2001;24:703–10. doi: 10.1165/ajrcmb.24.6.4355. [DOI] [PubMed] [Google Scholar]
- Ogita K, Matsunobu T, Schacht J. Acoustic trauma enhances DNA binding of transcription factor AP-1 in the guinea pig inner ear. Neuroreport. 2000;11:859–62. doi: 10.1097/00001756-200003200-00040. [DOI] [PubMed] [Google Scholar]
- Ohinata Y, Miller JM, Altschuler RA, Schacht J. Intense noise induces formation of vasoactive lipid peroxidation products in the cochlea. Brain Res. 2000;878:163–73. doi: 10.1016/s0006-8993(00)02733-5. [DOI] [PubMed] [Google Scholar]
- Ohlemiller KK, Gagnon PM. Genetic dependence of cochlear cells and structures injured by noise. Hear Res. 2007;224:34–50. doi: 10.1016/j.heares.2006.11.005. [DOI] [PMC free article] [PubMed] [Google Scholar]
- Ohlemiller KK, Wright JS, Dugan LL. Early elevation of cochlear reactive oxygen species following noise exposure. Audiol Neurootol. 1999a;4:229–36. doi: 10.1159/000013846. [DOI] [PubMed] [Google Scholar]
- Ohlemiller KK, McFadden SL, Ding DL, Flood DG, Reaume AG, Hoffman EK, Scott RW, Wright JS, Putcha GV, Salvi RJ. Targeted deletion of the cytosolic Cu/Zn-superoxide dismutase gene (Sod1) increases susceptibility to noise-induced hearing loss. Audiol Neurootol. 1999b;4:237–46. doi: 10.1159/000013847. [DOI] [PubMed] [Google Scholar]
- Ou HC, Bohne BA, Harding GW. Noise damage in the C57BL/CBA mouse cochlea. Hear Res. 2000;145:111–22. doi: 10.1016/s0378-5955(00)00081-2. [DOI] [PubMed] [Google Scholar]
- Papa S, Monti SM, Vitale RM, Bubici C, Jayawardena S, Alvarez K, De Smaele E, Dathan N, Pedone C, Ruvo M, Franzoso G. Insights into the structural basis of the GADD45beta -mediated inactivation of the JNK kinase, MKK7/JNKK2. J Biol Chem. 2007 doi: 10.1074/jbc.M703112200. [DOI] [PubMed] [Google Scholar]
- Papa S, Zazzeroni F, Bubici C, Jayawardena S, Alvarez K, Matsuda S, Nguyen DU, Pham CG, Nelsbach AH, Melis T, De Smaele E, Tang WJ, D’Adamio L, Franzoso G. Gadd45 beta mediates the NF-kappa B suppression of JNK signalling by targeting MKK7/JNKK2. Nat Cell Biol. 2004;6:146–53. doi: 10.1038/ncb1093. [DOI] [PubMed] [Google Scholar]
- Pirvola U, Xing-Qun L, Virkkala J, Saarma M, Murakata C, Camoratto AM, Walton KM, Ylikoski J. Rescue of hearing, auditory hair cells, and neurons by CEP-1347/KT7515, an inhibitor of c-Jun N-terminal kinase activation. J Neurosci. 2000;20:43–50. doi: 10.1523/JNEUROSCI.20-01-00043.2000. [DOI] [PMC free article] [PubMed] [Google Scholar]
- Scarpidis U, Madnani D, Shoemaker C, Fletcher CH, Kojima K, Eshraghi AA, Staecker H, Lefebvre P, Malgrange B, Balkany TJ, Van De Water TR. Arrest of apoptosis in auditory neurons: implications for sensorineural preservation in cochlear implantation. Otol Neurotol. 2003;24:409–17. doi: 10.1097/00129492-200305000-00011. [DOI] [PubMed] [Google Scholar]
- Shizuki K, Ogawa K, Matsunobu T, Kanzaki J, Ogita K. Expression of c-Fos after noise-induced temporary threshold shift in the guinea pig cochlea. Neurosci Lett. 2002;320:73–6. doi: 10.1016/s0304-3940(02)00059-9. [DOI] [PubMed] [Google Scholar]
- Sliwiniska-Kowalska M, Pawelczyk M, Kowalski TJ. Genetic factors in susceptibility to age- and noise-related hearing loss. Pol Merkur Lekarski. 2006;21:384–8. [PubMed] [Google Scholar]
- Sliwinska-Kowalska M, Noben-Trauth K, Pawelczyk M, Kowalski TJ. Single nucleotide polymorphisms in the cadherin 23 (CDH23) gene in Polish workers exposed to industrial noise. Am J Hum Biol. 2008;20:481–3. doi: 10.1002/ajhb.20744. [DOI] [PubMed] [Google Scholar]
- Sliwinska-Kowalska M, Dudarewicz A, Kotylo P, Zamyslowska-Szmytke E, Pawlaczyk-luszczynska M, Gajda-Szadkowska A. Individual susceptibility to noise-induced hearing loss: choosing an optimal method of retrospective classification of workers into noise-susceptible and noise-resistant groups. Int J Occup Med Environ Health. 2006;19:235–45. doi: 10.2478/v10001-006-0029-2. [DOI] [PubMed] [Google Scholar]
- Stankovic K, Rio C, Xia A, Sugawara M, Adams JC, Liberman MC, Corfas G. Survival of adult spiral ganglion neurons requires erbB receptor signaling in the inner ear. J Neurosci. 2004;24:8651–61. doi: 10.1523/JNEUROSCI.0733-04.2004. [DOI] [PMC free article] [PubMed] [Google Scholar]
- Sugawara M, Corfas G, Liberman MC. Influence of supporting cells on neuronal degeneration after hair cell loss. J Assoc Res Otolaryngol. 2005;6:136–47. doi: 10.1007/s10162-004-5050-1. [DOI] [PMC free article] [PubMed] [Google Scholar]
- Sutherland KD, Lindeman GJ, Visvader JE. Knocking off SOCS genes in the mammary gland. Cell Cycle. 2007;6:799–803. doi: 10.4161/cc.6.7.4037. [DOI] [PubMed] [Google Scholar]
- Taggart RT, McFadden SL, Ding DL, Henderson D, Jin X, Sun W, Salvi R. Gene Expression Changes in Chinchilla Cochlea from Noise-Induced Temporary Threshold Shift. Noise Health. 2001;3:1–18. [PubMed] [Google Scholar]
- Van Laer L, Carlsson PI, Ottschytsch N, Bondeson ML, Konings A, Vandevelde A, Dieltjens N, Fransen E, Snyders D, Borg E, Raes A, Van Camp G. The contribution of genes involved in potassium-recycling in the inner ear to noise-induced hearing loss. Hum Mutat. 2006;27:786–95. doi: 10.1002/humu.20360. [DOI] [PubMed] [Google Scholar]
- Wang J, Van De Water TR, Bonny C, de Ribaupierre F, Puel JL, Zine A. A peptide inhibitor of c-Jun N-terminal kinase protects against both aminoglycoside and acoustic trauma-induced auditory hair cell death and hearing loss. J Neurosci. 2003;23:8596–607. doi: 10.1523/JNEUROSCI.23-24-08596.2003. [DOI] [PMC free article] [PubMed] [Google Scholar]
- Wang J, Ruel J, Ladrech S, Bonny C, van de Water TR, Puel JL. Inhibition of the c-Jun N-terminal kinase-mediated mitochondrial cell death pathway restores auditory function in sound-exposed animals. Mol Pharmacol. 2007;71:654–66. doi: 10.1124/mol.106.028936. [DOI] [PubMed] [Google Scholar]
- Wang T, Hu YC, Dong S, Fan M, Tamae D, Ozeki M, Gao Q, Gius D, Li JJ. Co-activation of ERK, NF-kappaB, and GADD45beta in response to ionizing radiation. J Biol Chem. 2005;280:12593–601. doi: 10.1074/jbc.M410982200. [DOI] [PMC free article] [PubMed] [Google Scholar]
- Wang Y, Hirose K, Liberman MC. Dynamics of noise-induced cellular injury and repair in the mouse cochlea. J Assoc Res Otolaryngol. 2002;3:248–68. doi: 10.1007/s101620020028. [DOI] [PMC free article] [PubMed] [Google Scholar]
- Wu MX. Roles of the stress-induced gene IEX-1 in regulation of cell death and oncogenesis. Apoptosis. 2003;8:11–8. doi: 10.1023/a:1021688600370. [DOI] [PubMed] [Google Scholar]
- Yamane H, Nakai Y, Takayama M, Konishi K, Iguchi H, Nakagawa T, Shibata S, Kato A, Sunami K, Kawakatsu C. The emergence of free radicals after acoustic trauma and strial blood flow. Acta Otolaryngol Suppl. 1995;519:87–92. doi: 10.3109/00016489509121877. [DOI] [PubMed] [Google Scholar]
- Yang WP, Henderson D, Hu BH, Nicotera TM. Quantitative analysis of apoptotic and necrotic outer hair cells after exposure to different levels of continuous noise. Hear Res. 2004;196:69–76. doi: 10.1016/j.heares.2004.04.015. [DOI] [PubMed] [Google Scholar]
- Yoshida N, Hequembourg SJ, Atencio CA, Rosowski JJ, Liberman MC. Acoustic injury in mice: 129/SvEv is exceptionally resistant to noise-induced hearing loss. Hear Res. 2000;141:97–106. doi: 10.1016/s0378-5955(99)00210-5. [DOI] [PubMed] [Google Scholar]
- Zaman K, Ryu H, Hall D, O’Donovan K, Lin KI, Miller MP, Marquis JC, Baraban JM, Semenza GL, Ratan RR. Protection from oxidative stress-induced apoptosis in cortical neuronal cultures by iron chelators is associated with enhanced DNA binding of hypoxia-inducible factor-1 and ATF-1/CREB and increased expression of glycolytic enzymes, p21(waf1/cip1), and erythropoietin. J Neurosci. 1999;19:9821–30. doi: 10.1523/JNEUROSCI.19-22-09821.1999. [DOI] [PMC free article] [PubMed] [Google Scholar]
- Zhang Y, Schlossman SF, Edwards RA, Ou CN, Gu J, Wu MX. Impaired apoptosis, extended duration of immune responses, and a lupus-like autoimmune disease in IEX-1-transgenic mice. Proceedings of the National Academy of Sciences of the United States of America. 2002;99:878–83. doi: 10.1073/pnas.022326699. [DOI] [PMC free article] [PubMed] [Google Scholar]
- Zheng QY, Johnson KR, Erway LC. Assessment of hearing in 80 inbred strains of mice by ABR threshold analyses. Hear Res. 1999;130:94–107. doi: 10.1016/s0378-5955(99)00003-9. [DOI] [PMC free article] [PubMed] [Google Scholar]
- Zhu Y, Ohlemiller KK, McMahan BK, Gidday JM. Mouse models of retinal ischemic tolerance. Invest Ophthalmol Vis Sci. 2002;43:1903–11. [PubMed] [Google Scholar]
- Zine A, van de Water TR. The MAPK/JNK signalling pathway offers potential therapeutic targets for the prevention of acquired deafness. Curr Drug Targets CNS Neurol Disord. 2004;3:325–32. doi: 10.2174/1568007043337166. [DOI] [PubMed] [Google Scholar]