Abstract
Epidemiological and in vivo studies have demonstrated that exposure to the pesticides paraquat (PQ) and maneb (MB) increase the risk of developing Parkinson’s disease (PD) and cause dopaminergic cell loss, respectively. PQ is a well-recognized cause of oxidative toxicity; therefore, the purpose of this study was to determine if MB potentiates oxidative stress caused by PQ, thus providing a mechanism for enhanced neurotoxicity by the combination. The results show that PQ alone at a moderately toxic dose (20–30% cell death in 24 h) caused increased reactive oxygen species (ROS) generation, oxidation of mitochondrial thioredoxin-2 and peroxiredoxin-3, lesser oxidation of cytoplasmic thioredoxin-1 and peroxiredoxin-1, and no oxidation of cellular GSH/GSSG. In contrast, MB alone at a similar toxic dose resulted in no ROS generation, no oxidation of thioredoxin and peroxiredoxin, and an increase in cellular GSH after 24 h. Together, MB increased GSH and inhibited ROS production and thioredoxin/peroxiredoxin oxidation observed with PQ alone, yet resulted in more extensive (> 50%) cell death. MB treatment resulted in increased abundance of nuclear Nrf2 and mRNA for phase II enzymes under the control of Nrf2, indicating activation of cell protective responses. The results show that MB potentiation of PQ neurotoxicity does not occur by enhancing oxidative stress and suggests that increased toxicity occurs by a combination of divergent mechanisms, perhaps involving alkylation by MB and oxidation by PQ.
Keywords: paraquat, maneb, thioredoxin, peroxiredoxin, Nrf2, Parkinson’s disease
Pesticides include all substances or mixtures of substances intended for preventing, destroying, repelling, or mitigating pests; classes are commonly referred to by the organisms that they are designed to control, such as herbicides, insecticides, and fungicides (Franco et al., 2010). Over the past two decades, epidemiological studies have reported an increased risk of developing Parkinson’s disease (PD) in residents of rural areas that have been exposed to pesticides (Ritz and Yu, 2000). These observations have led to development of an environmental hypothesis of PD in which chemical agents present in the environment are proposed to selectively damage dopaminergic neurons in the substantia nigra pars compacta (SNpc), thus promoting the progression and development of PD (Drechsel and Patel, 2008).
A recent study reported that exposure to the herbicide paraquat (PQ) and the fungicide maneb (MB) significantly increases the risk of developing PD (Costello et al., 2009). These results supported earlier observations, including rodent studies showing that the mixture of MB and PQ causes dopaminergic neuron loss in vivo (Thiruchelvam et al., 2000, 2003, 2005). These observations are important for several reasons, i.e., they emphasize the need to systematically monitor exposures, develop better strategies to detect toxicity of mixtures occurring in the environment, and apply basic science approaches to understand and anticipate mechanisms that could result in combined toxicities.
PQ, one of the most widely used herbicides in the world, is quick acting and nonselective. PQ toxicity is caused by oxidative stress due to redox cycling, a process in which it accepts an electron from an appropriate donor and subsequently reduces O2 to produce superoxide anion radical (O2−.) and regenerates (Drechsel and Patel, 2008). Superoxide and related reactive oxygen species (ROS) cause toxicity by radical and nonradical mechanisms, with glutathione and thioredoxin antioxidant systems being critical for protection. Additionally, mitochondria are a major source of PQ-induced ROS production in neurons (Castello et al., 2007).
The fungicide MB, a manganese-containing ethylenebis (dithiocarbamate) compound, is used to treat numerous plant pathologies. Information regarding the mechanism of toxicity of this environmental toxicant is limited, but MB alters the toxicokinetics of PQ in mice (Barlow et al., 2003), inhibits complex III of the mitochondrial electron transport chain in isolated mitochondria from rat brain (Zhang et al., 2003), and causes mitochondrial dysfunction in primary mesencephalic neuron culture (Domico et al., 2006). Because complex III is a major site of ROS production in mitochondria, MB could potentiate mitochondrial ROS production and exacerbate PQ toxicity.
To examine possible potentiation of PQ oxidative toxicity by MB, we used SH-SY5Y neuroblastoma cells, a dopaminergic neuronal cell line, to study PQ and MB effects on the major thiol antioxidant systems. We took advantage of the improved ability to measure compartmental oxidative stress by specifically examining the oxidation of mitochondrial thioredoxin-2 and peroxiredoxin-3 and the oxidation of cytoplasmic/nuclear thioredoxin-1 and peroxiredoxin-1. The data show doses of PQ and MB that cause 20–25% cell death in 24 h result in distinct redox changes in the dopaminergic neurons. Specifically, PQ acts via a ROS-mediated mechanism, whereas MB does not. Importantly, both activate the redox-sensitive transcription factor, Nrf2, suggesting that MB acts as a cytoplasmic alkylating agent. These results show that PQ and MB act via diverse mechanisms, perhaps resulting in increased combined toxicity due to an additive effect of two toxic mechanisms.
MATERIALS AND METHODS
Cell culture and viability assay.
SH-SY5Y human neuroblastoma cells were obtained from ATCC (Manassas, VA) and maintained in medium consisting of DMEM/F12 (1:1 mixture), 10% FBS, and 1% penicillin, and streptomycin and all assays were conducted within 10–15 cell passages. Cell viability was assessed using a WST-1 assay from Roche Diagnostics (Mannheim, Germany) and performed as described by the manufacturer. Briefly, 1 × 10⁵ cells were seeded into a 96-well plate and allowed to adhere and recover overnight. The cells were then treated with PQ (50 or 100μM), MB (1.5 or 4μM), or PQ (50μM) + MB (1.5μM) for 24 h. Following treatment, the media was aspirated from all wells and replaced with fresh media containing the WST-1 reagent. The plate was then incubated 1 h at 37oC, after which the absorbance was read at 450 nm on a microplate reader. Trypan blue exclusion assay was also conducted to confirm results of WST-1 assays.
Intracellular GSH analysis.
1.5 × 10⁶ cells were seeded in a 6-well plate and allowed to adhere and recover overnight. The cells were then treated in triplicate with PQ, MB, or PQ + MB for 6 or 24 h. At the end of the treatment period, the cells were gently washed with PBS. Five hundred microliters of a solution consisting of 5% perchloric acid, 0.2 M boric acid, and 10μM γ-Glu-Glu was added to each well, and the cells were scraped from the plate, collected in 1.5-ml tubes and placed on ice. Samples were then derivatized with dansyl chloride, analyzed via HPLC to determine the GSH, and GSSG concentrations and the GSH redox potential (EhGSSG) was calculated using the Nernst equation (Jones et al., 1998).
Peroxiredoxin redox Western blot.
Cells were plated and treated with PQ and MB in the same manner as for GSH analysis. After the 24-h treatment, the cells were washed with PBS, treated with N-ethylmaleimide to react with protein thiols, and redox Western blots performed as described previously (Cox et al., 2009).
Thioredoxin redox Western blot.
Cells were plated and treated with PQ and MB in the same manner as for GSH analysis. Trx1 redox state was measured using an iodoacetic acid-labeling technique (Watson et al., 2003). The redox state of Trx2 was evaluated using a previously described PEG-maleimide labeling method (Requejo et al., 2010).
Intracellular ROS measurement.
Cells were plated onto 6-well plates and allowed to become 80–90% confluent. Cells were then loaded with 100μM 2′, 7′-dichlorodihydrofluorescene diacetate (H2DCFDA) (Invitrogen, Carlsbad, CA) for 30 min in DMEM/F12 media with containing 1% FBS. The medium was then aspirated and Krebs-Ringer solution containing PQ, MB, or PQ + MB was added to the cells. The plate was incubated 1 h at 37oC, and the fluorescence (emission 485 nm; excitation 515 nm) was read on a microplate fluorometer.
Nuclear isolation and Nrf2 Western blot.
Cells were plated on 100-mm plates and allowed to become 80–90% confluent. The cells were then treated with PQ, MB, or PQ + MB for 3 h. Cells were harvested, and cytosolic and nuclear fractions were isolated using NE-PER nuclear and cytoplasmic extraction reagents from Thermo Scientific (Rockford, IL). Approximately, 40 μg of cytosolic and nuclear protein was loaded and separated using a 10% SDS-PAGE gel. Membranes were probed with primary antibodies against Nrf2 (Abcam, Cambridge, MA), Lamin A/C, and GAPDH (Cell Signalling). Membranes were visualized using a LiCor Odyssey scanner (Lincoln, NE).
Quantitative real-time PCR measurement of mRNA abundance.
Following a 6-h treatment, RNA was collected using the RNeasy kit (Qiagen) per the manufacturer’s instructions. cDNA was synthesized using 1 μg of RNA and the Quantitect cDNA synthesis kit (Qiagen) per the manufacturer’s instructions. Quantitative real-time (qRT)-PCR was performed on a BioRad Opticon 2 PCR cycler using SYBR Green detection reagents purchased from SABiosciences. Primers were designed by and purchased from SABiosciences for the detection of human NADPH:quinone oxidoreductase-1 (NQO1), γ-glutamylcysteine ligase catalytic subunit (GCLC), Trx1, thioredoxin reductase-1 (TR1), Prx1, and β-actin. Gene expression was measured via protocols suggested by the reagent manufacturer (SABiosciences). In brief, samples were heated to 95°C for 10 min and then cycled from 95°C (15 s) to 60°C (30 s) to 72°C (30 s) 40 times. Melting curve analysis was performed to ensure the amplification of a single amplicon. Samples were analyzed via the ΔΔCt method using β-actin for normalization purposes and are presented as fold change from control samples. Data were compiled from three independent experiments.
Statistical analysis.
Statistics were performed using the software package GraphPad Prism version 5 (GraphPad Software, San Diego, CA). Data in graphs were represented as the mean ± SEM, and means were compared using one-way ANOVA and Dunnett post hoc test. Means were considered to be significantly different if p < 0.05.
RESULTS
MB-Mediated Cytotoxicity Is Greater Than PQ in SH-SY5Y Neuroblastoma Cells
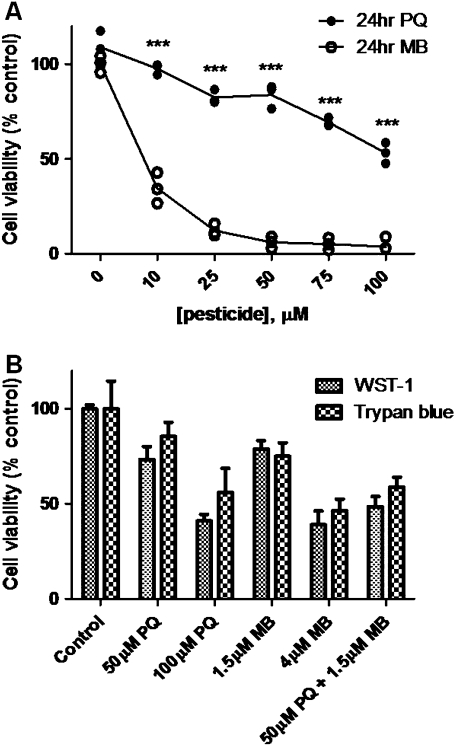
To determine appropriate concentrations of PQ and MB for mechanistic studies, cell viability, dose-response experiments were performed. SH-SY5Y cells, a human, dopaminergic neuronal cell line, were treated for 24 h with increasing concentrations of PQ or MB, and cell viability was assessed using a WST-1 assay. Results of these experiments (Fig. 1A) showed that MB was approximately 29 times more cytotoxic when compared with PQ (LC50: 3.75μM vs. 109.6μM). To investigate if a mixture of PQ and MB potentiated cytotoxicity, LC20 concentrations of PQ (50μM) and MB (1.5μM) were used in combination. Figure 1B shows that a mixture of PQ and MB resulted in an additive response. Because the WST-1 assay employs a tetrazolium dye that is reduced by the mitochondrial electron transport chain and observations that PQ and MB affect mitochondrial function, trypan blue exclusion assays were also performed to confirm the cell viability results (Fig. 1B). A small discrepancy between the two assays observed for the PQ-treated cells would indicate a potential mitochondrial mechanism.
FIG. 1.
MB is significantly more toxic, compared with PQ, in SH-SY5Y cells. SH-SY5Y cells were treated for 24 h with increasing concentrations of PQ or MB, and cell viability was measured using a WST-1 assay (A). The mixture of PQ and MB has an additive effect on cytotoxicity, e.g., the addition of the viability loss caused by PQ and MB alone. (WST-1 and trypan blue) (B). All assays were performed in triplicate, and the data are represented as the mean ± SEM. Cell viability values for MB and PQ were compared with each other to determine statistical significance (***p < 0.001).
MB Treatment Causes Significant Increase in Cellular GSH
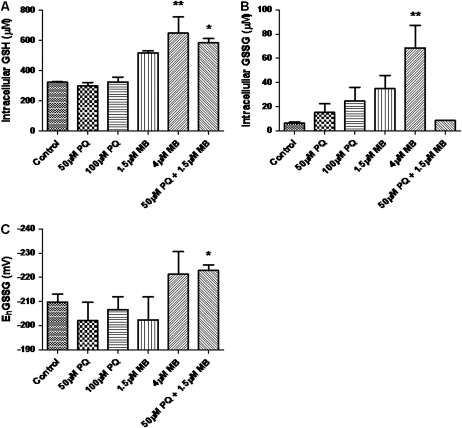
Both PQ and MB have been reported to cause oxidative stress (Drechsel and Patel, 2008); therefore, we investigated PQ- and MB-mediated alterations in intracellular GSH redox status. Cells were treated for either 6 or 24 h with PQ, MB or a mixture of PQ and MB. After the treatment period, cells were harvested, and GSH and GSSG were measured using HPLC (Fig. 2). PQ treatments, 6 h and 24 h, caused a minor decrease in reduced GSH, but this was not statistically significant (6 h data not shown). However, MB caused a significant increase in reduced GSH at the 24-h time point (Fig. 2A). Cellular GSSG levels were increased at 6-h time point by both PQ treatments and 1.5μM MB (data not shown); however, only the 24-h treatment with 4μM MB caused a statistically significant increase in GSSG (Fig. 2B). Using the Nernst equation, changes in the intracellular GSH/GSSG redox potential (EhGSSG) were calculated. At 24 h, PQ + MB caused a significantly more negative EhGSSG, i.e., a more reducing redox potential (Fig. 2C).
FIG. 2.
MB treatment causes an increase in intracellular GSH. SH-SY5Y cells were treated for 24 h and GSH (A) and GSSG (B) were measured via HPLC. The redox potential (EhGSSG) (C) was calculated using the Nernst equation. Each experiment was performed in triplicate and is represented as mean ± SEM. Data was analyzed via one-way ANOVA and Dunnett’s post hoc test (**p < 0.01).
PQ Causes an Oxidation of Cytoplasmic Prx1 and Mitochondrial Prx3 and Trx2
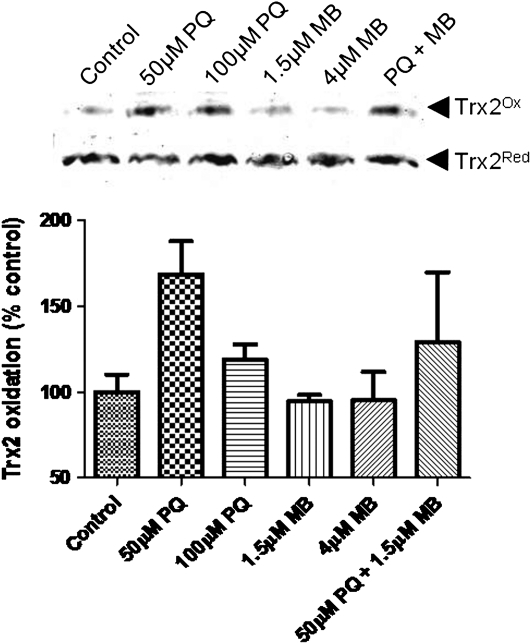
To examine compartmental redox effects, we performed redox Western blots to analyze the ability of PQ and MB to oxidize Trx and Prx in mitochondria and cytoplasm. Results from these experiments revealed that PQ or MB caused little or no oxidation of cytoplasmic Trx1 (data not shown). Unlike Trx1, results of these blots clearly show that PQ oxidized mitochondrial Trx2, whereas MB did not (Fig. 3). The mixture of PQ and MB caused Trx2 oxidation to an extent seen with PQ alone. Together, these data show that PQ principally causes oxidation of mitochondrial Trx2 and that MB did not enhance nor inhibit the effect.
FIG. 3.
PQ causes an oxidation of Trx2. Results of redox Western blot analysis assessing oxidation of mitochondrial Trx2. These blots are representative of at least three independent experiments.
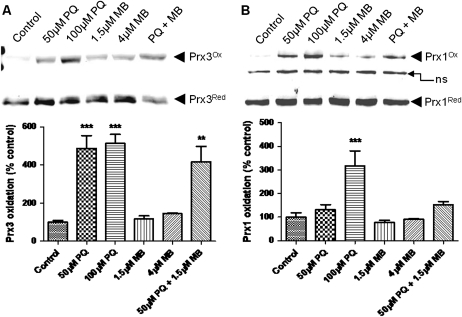
Trx support the activities of Prx, peroxidases that complement and may be quantitatively more important in protection against oxidants than GSH peroxidases (Rhee et al., 2005). We performed redox Western blots to assess the oxidation of the major mitochondrial (Prx3) and cytoplasmic (Prx1) 2-Cys Prx (Fig. 4). Redox blots showed significant oxidation of Prx3 by PQ (Fig. 4A). MB, on the other hand, caused only a slight oxidation of Prx3. Prx1 was oxidized by PQ and MB caused only minor oxidation (Fig. 4B). Prx3, not Prx1, was significantly oxidized by the mixture of PQ and MB. In summary, these data show that PQ strongly oxidizes both Prx isoforms and Trx2, whereas MB has little to no affect on Prx or Trx disulfide formation either without or with PQ.
FIG. 4.
PQ oxidizes cytoplasmic (Prx1) and mitochondrial Prx (Prx3). Prx3 (A) was significantly oxidized by PQ, whereas MB caused only a slight oxidation. Prx1 (B) was also oxidized by PQ; however, this result was not statistically significant. These blots are representative of at least three independent experiments, and data were analyzed via one-way ANOVA and Dunnett’s post hoc test (**p < 0.01; ***p < 0.001).
MB Treatment Does Not Cause Intracellular ROS Production
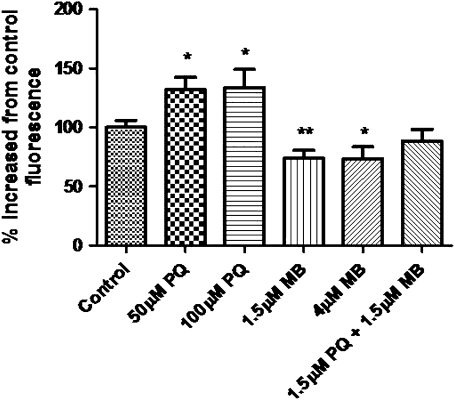
To further elucidate the mechanisms by which PQ and MB exert toxicity in dopaminergic neurons, we investigated the ability of PQ and MB to induce ROS in SH-SY5Y cells using H2DCFDA conversion to the highly fluorescent product, DCF (Rhee et al., 2010), to measure intracellular ROS production. PQ-treated cells displayed a significant increase in DCF fluorescence (Fig. 5). MB treatment did not induce an increase in fluorescence but actually resulted in a significant decrease when compared with control cells. Also, the mixture of PQ and MB did not cause an increase or decrease in DCF fluorescence, indicating that MB may inhibit, rather than potentiate, oxidative mechanisms.
FIG. 5.
PQ causes intracellular ROS production. SH-SY5Y cells were loaded with H2DCFDA for 30 min then treated with PQ, MB, or PQ + MB for 1 h. DCF fluorescence was measured using a fluorescent microplate reader. Samples were analyzed in triplicate, and the data are represented as mean ± SEM. Data were analyzed using one-way ANOVA and Dunnett’s post hoc test (**p < 0.01).
MB Triggers a Robust Nrf2 Response in SH-SY5Y Cells
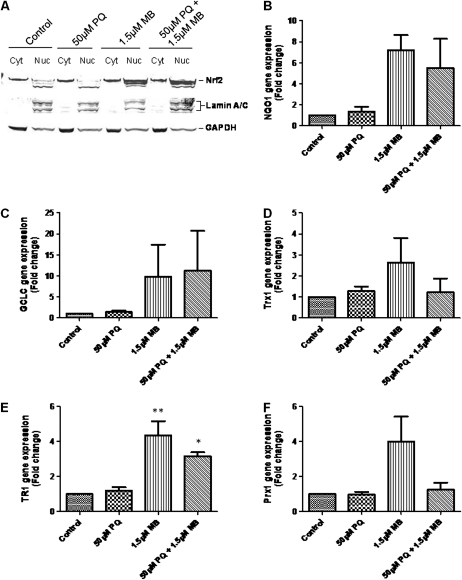
The Nrf2/Keap-1 system can be activated by both ROS and electrophiles, resulting in expression of phase II detoxifying enzymes, like those involved in de novo GSH synthesis (Zhang, 2006). Because MB increased intracellular GSH, we investigated the Nrf2/Keap-1 response after PQ and MB treatments. Western blots of cytosolic and nuclear fractions showed that MB treatment caused an increase in the abundance of nuclear Nrf2 (Fig. 6A). To confirm Nrf2 activity, we used qRT-PCR to analyze abundance of Nrf2 responsive genes. Figures 6B–F details the changes in abundance of mRNA for NQO1, GCLC, Trx1, TR1, and Prx1, respectively. A feature common to all the genes analyzed was that MB caused the most dramatic increase in gene expression. Also, the changes in expression were greater in MB-treated cells compared with the PQ-treated cells. Taken together, these data indicate that MB is the more potent Nrf2 activator when compared with PQ.
FIG. 6.
MB treatment causes a potent activation of Nrf2. Nuclear translocation of Nrf2 (A) was assessed, and cells were assayed for abundance of Nrf2-responsive genes: (B) γ-glutamylcysteine ligase—catalytic subunit (GCLC), (C) NADPH:quinone oxidoreductase-1 (NQO1), (D) thioredoxin 1 (Trx1), (E) thioredoxin reductase 1 (TR1), and (F) peroxiredoxin 1 (Prx1). Assays were performed in triplicate in at least three independent experiments. Data are represented as mean ± SEM, and data were analyzed using one-way ANOVA and Dunnett’s post hoc test (*p < 0.05; **p < 0.01).
DISCUSSION
Epidemiological studies have reported increased risk of PD due to pesticide exposure (Drechsel and Patel, 2008; Costello et al., 2009; Hancock et al., 2008; Ritz and Yu, 2000), and rodent studies have demonstrated decreased motor activity, decreased tyrosine hydroxylase immunoreactivity in the SNpc, and altered dopamine metabolism in the striatum of PQ- and MB-treated mice (Thiruchelvam et al., 2000, 2003, 2005). Additionally, MB has been shown to increase levels of PQ in the brain and slow PQ clearance (Barlow et al., 2003). For these reasons, we sought to further elucidate if MB could potentiate PQ-mediated oxidative stress in dopaminergic neurons. Through the evaluation of alterations in Trx, Prx, and GSH redox states, the data presented here indicate that PQ and MB cause toxicity via divergent mechanisms involving compartment-specific stress and reactive thiol oxidation and alkylation.
GSH is one of the most central thiol antioxidants and has frequently been characterized as a “redox buffer” to preserve the reduced state of proteins, protecting against cellular insults like ROS, reactive nitrogen species, and electrophiles (Jones and Go 2010). Decreased intracellular GSH is associated with impaired cellular functions including ubiquitin proteasome activity, inflammation, and mitochondrial energy production and is observed in the SNpc of PD patients (Martin and Teismann, 2009). Here, we report that PQ, at concentrations that caused only moderate toxicity, led to a minor loss of GSH. In contrast, MB increased cellular GSH, an effect also observed by Barlow et al. (2003) in PC12 cells and in primary mesencephalic neuron cultures. Our data indicate that PQ and MB are working through different mechanisms and that oxidative stress can be considered more than a simple imbalance of oxidants and reductants.
To advance the understanding of the toxic mechanisms of PQ and MB, we investigated the ability of these agents to oxidize other important cellular redox couples, namely Trx and Prx. Trx, along with thioredoxin reductase and NADPH, acts as a general disulfide reductase (Arner and Holmgren, 2000) and is involved in the catalytic function of ribonucleotide reductase and Prx and in the redox regulation of transcription factors such as NF-κB, Nrf2, and AP-1 (Hansen et al., 2004; Hirota et al., 1997; Matthews et al., 1992; Rhee et al., 2005). Prx are homodimeric, thiol-specific antioxidant proteins that have a major role in detoxification of mitochondrial ROS (Drechsel and Patel, 2010; Wood et al., 2003). The current results showed that PQ oxidized mitochondrial Trx2 and Prx3 but not cytoplasmic Trx1. MB treatment did not result in an oxidation of either Trx or Prx. These results suggest that PQ is acting via a mitochondrial mechanism, supporting the results of the WST-1 assay and the interpretation that PQ stimulates mitochondrial ROS generation (Castello et al., 2007).
Trx2 performs a variety of functions related to cellular viability. For example, the mitochondrial permeability transition has been demonstrated to be regulated by Trx2 (He et al., 2008) and is a key defensive mechanism against oxidant-induced apoptosis (Chen et al., 2006). Trx2 knockouts cause embryonic lethality during developmental periods of mitochondrial maturation, highlighting the necessity of proper Trx2 function in overall mitochondrial function (Nonn et al., 2003). Thus, untimely PQ-mediated oxidation or MB modification of this key protein could compromise its function and contribute to a decrease in cell viability.
MB caused little to no oxidation of either Prx or Trx, indicating a mechanism divergent from that of PQ. MB did not cause disulfide formation; however, it could be adducting essential Cys residues. This type of modification may not be evident in a Prx or Trx2 redox Western blot because an intra- or intermolecular disulfide would not be created. Both reduced and MB-adducted Prx or Trx2 could migrate to the molecular weight corresponding to “reduced” Prx or Trx2. Also, due to the low concentration of MB (1.5–4μM) used compared with the concentration of intracellular GSH (∼300μM), GSH could be buffering the toxic effects of MB.
Our data suggest that PQ is acting via a mechanism involving mitochondrial ROS production, whereas MB acts via an alkylation mechanism. This is evidenced by the oxidation of Trx2, Prx1, and Prx3, and a significant increase in DCF fluorescence caused by PQ treatment and the lack thiol oxidation or oxidants produced in the MB samples. H2DCFDA, the probe used to measure ROS production, is thought to mostly detect hydrogen peroxide (Oyama et al., 1994). In this study, MB treatment actually resulted in decreased DCF fluorescence compared with the control cells. Decreased DCF fluorescence was also seen in yeast cells treated with mancozeb, a mixture zinc and manganese ethylenebis (dithiocarbamate) (Dias et al., 2010). However, the use of H2DCFDA to detect ROS is controversial (Chen et al., 2010), and additional detailed studies will be needed to address possible upstream effects of MB on oxidant generation.
Alteration in tissue redox balance is a common pathological feature of neurodegenerative diseases (de Vries et al., 2008). The transcription factor Nrf2 is central to the efficient detoxification of reactive metabolites and ROS and is effective in blocking neurotoxicity resulting from GSH depletion, lipid peroxidation, calcium overload, excitotoxins, and mitochondrial dysfunction (Johnson et al., 2008). Our data show that MB caused a large increase in the abundance of nuclear Nrf2. Additionally, MB increased mRNA for phase II detoxification enzymes under the regulation of Nrf2. These enzymes include γ-glutamylcysteine ligase catalytic subunit (GCLC), NADPH:quinone oxidoreductase-1 (NQO1), glutathione S-transferase, heme oxygenase-1 (HO-1), Trx, and Prx (Zhang, 2006). In our study, MB was the most potent Nrf2 activator, and this activation could occur by MB alkylation of sensor thiols in Keap-1. Keap-1, a protein involved in the negative regulation of Nrf2 through sequestration of Nrf2 in the cytosol, preventing activation, contains multiple Cys-rich regions believed to sense ROS and electrophiles. Oxidation or alkylation of these residues cause the release of Nrf2 and allows nuclear translocation and transcription of phase II detoxification genes (Zhang, 2006). Barlow et al. (2003) also, indirectly, demonstrated MB-mediated Nrf2 activation via increased HO-1 protein and GCLC activity, both Nrf2-mediated genes, in response to MB.
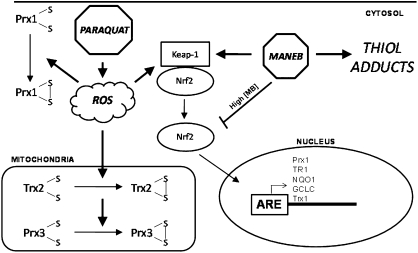
In summary, the data presented here show MB potentiation of PQ neurotoxicity does not occur by enhancing oxidative stress. The data provide little evidence of synergy or potentiation of the toxicity of one by the other. Instead, the data show that PQ and MB act through different toxic mechanisms (Fig. 7). PQ induces ROS production affecting intracellular redox states, especially affecting mitochondria, whereas MB does not. MB was especially potent in activating the transcription of genes controlled by Nrf2 and increasing cellular GSH, indicating the involvement of cytoplasmic targets by an alkylation mechanism. Cell death occurred despite a strong Nrf2 response, suggesting that acute exposures may be more important for loss of cells than chronic exposures. The results underscore the importance of mixtures toxicology, where transient individual exposures can be additive in toxicologic outcome.
FIG. 7.
A scheme illustrating the proposed divergent mechanisms of PQ and MB toxicity. PQ, through ROS generation, is able to alter redox status of the Trx/Prx system of mitochondria and cause a minor activation of Nrf2. MB, acting as an alkylating agent, alters cellular homeostasis via thiol adducts, causing robust activation of Nrf2 resulting in the transcription of phase II antioxidant enzymes.
FUNDING
National Institute of Environmental Health Sciences at the National Institutes of Health (RO1 ES009047 to D.P.J. and T32 ES012870 to J.R.R.); The Emory-Egleston Children’s Research Committee (to J.M.H.).
References
- Arner ES, Holmgren A. Physiological functions of thioredoxin and thioredoxin reductase. Eur. J. Biochem. 2000;267:6102–6109. doi: 10.1046/j.1432-1327.2000.01701.x. [DOI] [PubMed] [Google Scholar]
- Barlow BK, Thiruchelvam MJ, Bennice L, Cory-Slechta DA, Ballatori N, Richfield EK. Increased synaptosomal dopamine content and brain concentration of paraquat produced by selective dithiocarbamates. J. Neurochem. 2003;85:1075–1086. doi: 10.1046/j.1471-4159.2003.01773.x. [DOI] [PubMed] [Google Scholar]
- Castello PR, Drechsel DA, Patel M. Mitochondria are a major source of paraquat-induced reactive oxygen species production in the brain. J. Biol. Chem. 2007;282:14186–14193. doi: 10.1074/jbc.M700827200. [DOI] [PMC free article] [PubMed] [Google Scholar]
- Chen X, Zhong Z, Xu Z, Chen L, Wang Y. 2',7'-Dichlorodihydrofluorescein as a fluorescent probe for reactive oxygen species measurement: forty years of application and controversy. Free Radic. Res. 2010;44:587–604. doi: 10.3109/10715761003709802. [DOI] [PubMed] [Google Scholar]
- Chen Y, Yu M, Jones DP, Greenamyre JT, Cai J. Protection against oxidant-induced apoptosis by mitochondrial thioredoxin in SH-SY5Y neuroblastoma cells. Toxicol. Appl. Pharmacol. 2006;216:256–262. doi: 10.1016/j.taap.2006.05.006. [DOI] [PubMed] [Google Scholar]
- Costello S, Cockburn M, Bronstein J, Zhang X, Ritz B. Parkinson’s disease and residential exposure to maneb and paraquat from agricultural applications in the central valley of California. Am. J. Epidemiol. 2009;169:919–926. doi: 10.1093/aje/kwp006. [DOI] [PMC free article] [PubMed] [Google Scholar]
- Cox AG, Peskin AV, Paton LN, Winterbourn CC, Hampton MB. Redox potential and peroxide reactivity of human peroxiredoxin 3. Biochemistry. 2009;48:6495–6501. doi: 10.1021/bi900558g. [DOI] [PubMed] [Google Scholar]
- de Vries HE, Witte M, Hondius D, Rozemuller AJ, Drukarch B, Hoozemans J, van Horssen J. Nrf2-induced antioxidant protection: a promising target to counteract ROS-mediated damage in neurodegenerative disease? Free Radic. Biol. Med. 2008;45:1375–1383. doi: 10.1016/j.freeradbiomed.2008.09.001. [DOI] [PubMed] [Google Scholar]
- Dias PJ, Teixeira MC, Telo JP, Sa-Correia I. Insights into the mechanisms of toxicity and tolerance to the agricultural fungicide mancozeb in yeast, as suggested by a chemogenomic approach. OMICS. 2010;14:211–227. doi: 10.1089/omi.2009.0134. [DOI] [PubMed] [Google Scholar]
- Domico LM, Zeevalk GD, Bernard LP, Cooper KR. Acute neurotoxic effects of mancozeb and maneb in mesencephalic neuronal cultures are associated with mitochondrial dysfunction. Neurotoxicology. 2006;27:816–825. doi: 10.1016/j.neuro.2006.07.009. [DOI] [PubMed] [Google Scholar]
- Drechsel DA, Patel M. Role of reactive oxygen species in the neurotoxicity of environmental agents implicated in Parkinson’s disease. Free Radic. Biol. Med. 2008;44:1873–1886. doi: 10.1016/j.freeradbiomed.2008.02.008. [DOI] [PMC free article] [PubMed] [Google Scholar]
- Drechsel DA, Patel M. Respiration-dependent H2O2 removal in brain mitochondria via the thioredoxin/peroxiredoxin system. J. Biol. Chem. 2010;285:27850–27858. doi: 10.1074/jbc.M110.101196. [DOI] [PMC free article] [PubMed] [Google Scholar]
- Franco R, Li S, Rodriguez-Rocha H, Burns M, Panayiotidis MI. Molecular mechanisms of pesticide-induced neurotoxicity: relevance to Parkinson’s disease. Chem. Biol. Interact. 2010;188:289–300. doi: 10.1016/j.cbi.2010.06.003. [DOI] [PMC free article] [PubMed] [Google Scholar]
- Hancock DB, Martin ER, Mayhew GM, Stajich JM, Jewett R, Stacy MA, Scott BL, Vance JM, Scott WK. Pesticide exposure and risk of Parkinson’s disease: a family-based case-control study. BMC Neurol. 2008;8:6. doi: 10.1186/1471-2377-8-6. [DOI] [PMC free article] [PubMed] [Google Scholar]
- Hansen JM, Watson WH, Jones DP. Compartmentation of Nrf-2 redox control: regulation of cytoplasmic activation by glutathione and DNA binding by thioredoxin-1. Toxicol. Sci. 2004;82:308–317. doi: 10.1093/toxsci/kfh231. [DOI] [PubMed] [Google Scholar]
- He M, Cai J, Go YM, Johnson JM, Martin WD, Hansen JM, Jones DP. Identification of thioredoxin-2 as a regulator of the mitochondrial permeability transition. Toxicol. Sci. 2008;105:44–50. doi: 10.1093/toxsci/kfn116. [DOI] [PMC free article] [PubMed] [Google Scholar]
- Hirota K, Matsui M, Iwata S, Nishiyama A, Mori K, Yodoi J. AP-1 transcriptional activity is regulated by a direct association between thioredoxin and Ref-1. Proc. Natl. Acad. Sci. U S A. 1997;94:3633–3638. doi: 10.1073/pnas.94.8.3633. [DOI] [PMC free article] [PubMed] [Google Scholar]
- Johnson JA, Johnson DA, Kraft AD, Calkins MJ, Jakel RJ, Vargas MR, Chen PC. The Nrf2-ARE pathway: an indicator and modulator of oxidative stress in neurodegeneration. Ann. N Y Acad. Sci. 2008;1147:61–69. doi: 10.1196/annals.1427.036. [DOI] [PMC free article] [PubMed] [Google Scholar]
- Jones DP, Carlson JL, Samiec PS, Sternberg P, Jr, Mody VC, Jr, Reed RL, Brown LA. Glutathione measurement in human plasma. Evaluation of sample collection, storage and derivatization conditions for analysis of dansyl derivatives by HPLC. Clin. Chim. Acta. 1998;275:175–184. doi: 10.1016/s0009-8981(98)00089-8. [DOI] [PubMed] [Google Scholar]
- doi: 10.1111/j.1463-1326.2010.01266.x. Jones, D. P., and Go, Y. M. (2010). Redox compartmentation of cellular stress. Diabetes Obes. Metab. 12(Suppl. 2), 116L–125. [DOI] [PMC free article] [PubMed] [Google Scholar]
- Martin HL, Teismann P. Glutathione—a review on its role and significance in Parkinson’s disease. FASEB J. 2009;23:3263–3272. doi: 10.1096/fj.08-125443. [DOI] [PubMed] [Google Scholar]
- Matthews JR, Wakasugi N, Virelizier JL, Yodoi J, Hay RT. Thioredoxin regulates the DNA binding activity of NF-kappa B by reduction of a disulphide bond involving cysteine 62. Nucleic Acids Res. 1992;20:3821–3830. doi: 10.1093/nar/20.15.3821. [DOI] [PMC free article] [PubMed] [Google Scholar]
- Nonn L, Williams RR, Erickson RP, Powis G. The absence of mitochondrial thioredoxin 2 causes massive apoptosis, exencephaly, and early embryonic lethality in homozygous mice. Mol. Cell. Biol. 2003;23:916–922. doi: 10.1128/MCB.23.3.916-922.2003. [DOI] [PMC free article] [PubMed] [Google Scholar]
- Oyama Y, Hayashi A, Ueha T, Maekawa K. Characterization of 2′,7′-dichlorofluorescin fluorescence in dissociated mammalian brain neurons: estimation on intracellular content of hydrogen peroxide. Brain Res. 1994;635:113–117. doi: 10.1016/0006-8993(94)91429-x. [DOI] [PubMed] [Google Scholar]
- Requejo R, Chouchani ET, Hurd TR, Menger KE, Hampton MB, Murphy MP. Measuring mitochondrial protein thiol redox state. Methods Enzymol. 2010;474:123–147. doi: 10.1016/S0076-6879(10)74008-8. [DOI] [PubMed] [Google Scholar]
- Rhee SG, Chae HZ, Kim K. Peroxiredoxins: a historical overview and speculative preview of novel mechanisms and emerging concepts in cell signaling. Free Radic. Biol. Med. 2005;38:1543–1552. doi: 10.1016/j.freeradbiomed.2005.02.026. [DOI] [PubMed] [Google Scholar]
- Rhee SG, Chang TS, Jeong W, Kang D. Methods for detection and measurement of hydrogen peroxide inside and outside of cells. Mol. Cells. 2010;29:539–549. doi: 10.1007/s10059-010-0082-3. [DOI] [PubMed] [Google Scholar]
- Ritz B, Yu F. Parkinson’s disease mortality and pesticide exposure in California 1984–1994. Int. J. Epidemiol. 2000;29:323–329. doi: 10.1093/ije/29.2.323. [DOI] [PubMed] [Google Scholar]
- Thiruchelvam M, Brockel BJ, Richfield EK, Baggs RB, Cory-Slechta DA. Potentiated and preferential effects of combined paraquat and maneb on nigrostriatal dopamine systems: environmental risk factors for Parkinson’s disease? Brain Res. 2000;873:225–234. doi: 10.1016/s0006-8993(00)02496-3. [DOI] [PubMed] [Google Scholar]
- Thiruchelvam M, McCormack A, Richfield EK, Baggs RB, Tank AW, Di Monte DA, Cory-Slechta DA. Age-related irreversible progressive nigrostriatal dopaminergic neurotoxicity in the paraquat and maneb model of the Parkinson’s disease phenotype. Eur. J. Neurosci. 2003;18:589–600. doi: 10.1046/j.1460-9568.2003.02781.x. [DOI] [PubMed] [Google Scholar]
- Thiruchelvam M, Prokopenko O, Cory-Slechta DA, Buckley B, Mirochnitchenko O. Overexpression of superoxide dismutase or glutathione peroxidase protects against the paraquat + maneb-induced Parkinson disease phenotype. J. Biol. Chem. 2005;280:22530–22539. doi: 10.1074/jbc.M500417200. [DOI] [PubMed] [Google Scholar]
- Watson WH, Pohl J, Montfort WR, Stuchlik O, Reed MS, Powis G, Jones DP. Redox potential of human thioredoxin 1 and identification of a second dithiol/disulfide motif. J. Biol. Chem. 2003;278:33408–33415. doi: 10.1074/jbc.M211107200. [DOI] [PubMed] [Google Scholar]
- Wood ZA, Schroder E, Robin Harris J, Poole LB. Structure, mechanism and regulation of peroxiredoxins. Trends Biochem. Sci. 2003;28:32–40. doi: 10.1016/s0968-0004(02)00003-8. [DOI] [PubMed] [Google Scholar]
- Zhang DD. Mechanistic studies of the Nrf2-Keap1 signaling pathway. Drug Metab. Rev. 2006;38:769–789. doi: 10.1080/03602530600971974. [DOI] [PubMed] [Google Scholar]
- Zhang J, Fitsanakis VA, Gu G, Jing D, Ao M, Amarnath V, Montine TJ. Manganese ethylene-bis-dithiocarbamate and selective dopaminergic neurodegeneration in rat: a link through mitochondrial dysfunction. J. Neurochem. 2003;84:336–346. doi: 10.1046/j.1471-4159.2003.01525.x. [DOI] [PubMed] [Google Scholar]


