

Non-technical summary
Most cellular processes are exquisitely sensitive to pH. Consequently our cells have a range of processes directed to control cellular pH. Plasma membrane transport proteins move acid or base across the plasma membrane to regulate pH precisely. We studied AE1 (also called Band 3) of erythrocytes and kidney cells, which rapidly transports the base, bicarbonate. AE1's high transport rate, combined with the surprisingly slow rates of H+ diffusion in cytosol, led us to wonder whether AE1 changes the pH of its local environment. The key findings were that H+ diffusion through the cytosol occurs at 0.6 μm s−1, and along the inner surface of the plasma membrane at only 0.01 μm s−1. We estimated that the size of the region of altered pH (H+ microdomain) around AE1 is 0.3 μm in diameter. pH-regulatory transporters, like AE1, have differential effects on their immediate environment, with implications for the regulation of nearby pH-sensitive proteins.
Abstract
Abstract
Microdomains, regions of discontinuous cytosolic solute concentration enhanced by rapid solute transport and slow diffusion rates, have many cellular roles. pH-regulatory membrane transporters, like the Cl−/HCO3− exchanger AE1, could develop H+ microdomains since AE1 has a rapid transport rate and cytosolic H+ diffusion is slow. We examined whether the pH environment surrounding AE1 differs from other cellular locations. As AE1 drives Cl−/HCO3− exchange, differences in pH, near and remote from AE1, were monitored by confocal microscopy using two pH-sensitive fluorescent proteins: deGFP4 (GFP) and mNectarine (mNect). Plasma membrane (PM) pH (defined as ∼1 μm region around the cell periphery) was monitored by GFP fused to AE1 (GFP.AE1), and mNect fused to an inactive mutant of the Na+-coupled nucleoside co-transporter, hCNT3 (mNect.hCNT3). GFP.AE1 to mNect.hCNT3 distance was varied by co-expression of different amounts of the two proteins in HEK293 cells. As the GFP.AE1–mNect.hCNT3 distance increased, mNect.hCNT3 detected the Cl−/HCO3− exchange-associated cytosolic pH change with a time delay and reduced rate of pH change compared to GFP.AE1. We found that a H+ microdomain 0.3 μm in diameter forms around GFP.AE1 during physiological HCO3− transport. Carbonic anhydrase isoform II inhibition prevented H+ microdomain formation. We also measured the rate of H+ movement from PM GFP.AE1 to endoplasmic reticulum (ER), using mNect fused to the cytosolic face of ER-resident calnexin (CNX.mNect). The rate of H+ diffusion through cytosol was 60-fold faster than along the cytosolic surface of the plasma membrane. The pH environment surrounding pH regulatory transport proteins may differ as a result of H+ microdomain formation, which will affect nearby pH-sensitive processes.
Introduction
A cell's ability to convert environmental stimuli into a specific cellular response arises in part from locally restricted signalling, enhanced by organellar barriers and cytosolic heterogeneity of solute concentration. Solute microdomains, regions of cytosolic concentration discontinuity for solutes such as Ca2+ and cAMP, are the product of precise regulation of the concentration of solute in space, time and amplitude. Cells carefully control cytosolic pH through the activity of pH-regulatory transport proteins (Laude & Simpson, 2009; Neves & Iyengar, 2009). Whether H+ microdomains develop near the cytosolic surface of such transporters has not been established, but is of particular interest given the breadth of cellular processes regulated by pH changes (Casey et al. 2010).
AE1, a plasma membrane Cl−/HCO3− exchanger, is the predominant protein of the erythrocyte plasma membrane (Fairbanks et al. 1971; Cordat & Casey, 2009). α-Intercalated cells of the distal renal tubule also express an N-terminally truncated AE1 variant (kAE1) (Alper et al. 2001). Erythrocyte AE1 has an intracellular amino-terminal domain that interacts with cytoskeletal proteins and glycolytic enzymes (Low, 1986), a membrane-spanning domain responsible for Cl−/HCO3− exchange activity (Grinstein et al. 1978; Cordat & Casey, 2009), and a short cytosolic C-terminus containing an acidic motif (LDADD) that binds cytosolic carbonic anhydrase (CA) isoform II (CAII) (Vince et al. 2000; Sterling et al. 2001). CAs catalyse the hydration of CO2 to form HCO3− and H+. CAII interacts physically and functionally with AE1 to form a bicarbonate transport metabolon (Reithmeier, 2001; Sterling et al. 2001), a physical complex of enzymes in a linked metabolic pathway that functions to maximize flux of substrate through the pathway by limiting its loss through diffusion (Johnson & Casey, 2009). In the presence of CAII AE1 has a high turnover rate of 5 × 10⁴ s−1, which is among the fastest rates for a membrane transport protein (Sterling & Casey, 2002).
H+ diffusion rates have been studied in cardiomyocytes by creation of local pHi disturbances using acid-filled patch-pipettes (Spitzer et al. 2000, 2002; Vaughan-Jones et al. 2002), local microperfusion of extracellular membrane-permeant acids or bases (Swietach et al. 2005), and flash photolysis-induced release of caged H+ (Swietach et al. 2007). Cytosolic H+ gradients as large as 1 pH unit were established, which persisted for minutes (Spitzer et al. 2000). Diffusion of H+ in the cytosol is two orders of magnitude slower than in water; a H+ gradient requires 1 min to diffuse 100 μm along the length of a cardiomyocyte (Vaughan-Jones et al. 2002; Swietach et al. 2005). Cytosolic diffusion rates are slowed by interaction of H+ with buffering groups on slowly moving macromolecules (Vaughan-Jones et al. 2006). The addition of a mobile buffer (CO2/HCO3−) increases the rate of H+ diffusion, thus decreasing the longitudinal pH gradient in cells (Spitzer et al. 2002), although the magnitude of the effect depends on the rate of H+ loading (Swietach et al. 2005).
Evidence for cytosolic H+ gradients has been found in other cells. H+ discontinuities in isolated mouse intestinal enterocytes result from the activity of proton-coupled dipeptide transporters (Stewart et al. 1999). H+ gradients are generated in oligodendrocytes by a differential subcellular distribution of Na+/H+ exchangers (NHEs), Na+/HCO3− co-transporters and CAII (Ro & Carson, 2004). Acidification of the leading edge of tumour cells is associated with polarized expression of pH-regulatory proteins, including AEs (Klein et al. 2000), NHEs (Stuwe et al. 2007), CAs (Swietach et al. 2008), monocarboxylate transporters (Halestrap & Meredith, 2004), and H+-ATPases (Martinez-Zaguilan et al. 1999). A similar phenomenon is also seen in microvascular endothelial cells (Rojas et al. 2006).
Do H+ microdomains form around pH-regulatory transport proteins such as AE1? Rapid AE1-mediated HCO3− transport, combined with a low rate of H+ diffusion in the cytosol, suggests that H+ microdomains develop around AE1 during Cl−/HCO3− exchange. Proteins in close proximity to AE1 would thus be subjected to a different pH to those more distant from AE1. In turn this could lead to differential regulation of pH-sensitive processes localized in the environ of pH-regulatory transporters. To examine the presence of a H+ microdomain around the surface of AE1, the pH-sensitive fluorescent proteins (FPs) deGFP (GFP), a dual-emission green FP (Hanson et al. 2002), and monomeric Nectarine (mNect), a red FP (RFP) variant (Johnson et al. 2009), were fused to AE1 and the inactive control plasma membrane protein hCNT3 (human concentrative nucleoside transporter 3), respectively. pHi changes during AE1-mediated Cl−/HCO3− exchange were measured concomitantly at the surface of plasma membrane GFP.AE1 and mNect.hCNT3. To measure the spatial dimensions of the H+ microdomain around AE1, GFP4.AE1 and mNect.hCNT3 were expressed at different ratios in HEK293 cells, and the average distance between the two proteins at the plasma membrane was determined.
Methods
Materials
Synthetic DNA oligonucleotides were from Integrated DNA Technologies (Coralville, IA, USA). PCR products and products of restriction digests were purified by agarose gel electrophoresis and extraction using the QIAquick Gel Extraction Kit (Qiagen, Mississauga, ON, Canada). Plasmid DNA was purified, using the HiSpeed Plasmid Purification Kit (Qiagen). Restriction endonucleases were purchased from either Invitrogen (Burlington, Ontario, Canada) or New England Biolabs (Ontario, Canada). T4 polynucleotide kinase was from New England Biolabs. ECL chemiluminescent reagent was from Perkin Elmer Life Sciences (Waltham, MA, USA). Protease inhibitor cocktail tablets were from Roche Applied Sciences (Quebec, Canada). Mouse anti-AE1 monoclonal antibody (IVF12) was a generous gift from Dr Mike Jennings, University of Arkansas (Jennings et al. 1986). Rabbit anti-RFP polyclonal antibody (ab34771) was from Abcam (Cambridge, MA, USA). Mouse anti-glyceraldehyde 3-phosphate dehydrogenase (GAPDH) monoclonal antibody (sc-47724) and donkey anti-rabbit IgG conjugated to horseradish peroxidase (SC-2317) were from Santa Cruz Biotechnology, Inc. (Santa Cruz, CA, USA). Sheep anti-mouse IgG conjugated to horseradish peroxidase (NA93IV) was from GE Healthcare UK Limited (Amersham, UK). Poly-l-lysine, nigericin sodium salt, 6-ethoxy-2-benzothiazolesulfonamide and 2′,7′-bis(2-carboxyethyl)-5(6)-carboxyfluorescein acetoxymethyl ester (BCECF-AM) were from Sigma-Aldrich Canada (Oakville, Canada). Platinum Pfx DNA polymerase, Dulbecco's modified Eagle's media, calf serum, fetal bovine serum and penicillin–streptomycin–glutamine were from Gibco-Invitrogen Corporation (Burlington, ON, Canada). Round glass coverslips were from Fisher Scientific (ON, Canada). Streptavidin agarose resin was from Thermo Scientific (Rockford, IL, USA). EZ-Link Sulfo-NHS-SS-Biotin (sulfosuccinimidyl 2-(biotinamido) ethyl-1,3′-dithiopropionate) was from Pierce (Rockford, IL, USA). Sodium perfluorooctanoate (PFO) was from Oakwood Products, Inc. (West Columbia, SC, USA). Immobilon-P PVDF membranes were from Millipore (Billerica, MA, USA). Excitation and emission filters were from Chroma Technology (Rockingham, VT, USA). Additional information on methods can be found in the Supplemental material, available online only.
Construction of fusion proteins
Mammalian expression constructs pDEJ6 (mNectarine), pDEJ20 (mNect.hCNT3) and hCNT3 were described previously (Johnson et al. 2009). pJRC9 (AE1) and AE1-P652C were described previously (Casey et al. 1995; Tang et al. 1998). Calnexin in pcDNA3.1/zeo(+) was from Dr Marek Michalak, University of Alberta. Dual-emission green fluorescent protein 4 in pEGFP/N1 (called GFP hereafter for simplicity) was received from Dr Jim Remington, University of Oregon (Hanson et al. 2002). GFP.AE1 (pDEJ5) was generated through a three-step cloning process. pDEJ3 was generated by a single PCR step and cloning. Forward and reverse primers (5′-GCGCCATATGCTCGAGCAACTGGACACTCAGGACCAC-3′ and 5′-GCGCGAGCAGAGGCTGTGAAGGAT-3′, respectively) amplified a 591 base pair fragment of pJRC9, and added 5′ NdeI and XhoI restriction sites. The cDNA was generated by PCR (30 cycles of 94°C for 30 s, 55°C for 60 s, 72°C for 120 s). pJRC9 and PCR product were cut with NdeI and BssHII and ligated to generate pDEJ3. pDEJ4 was generated by digestion of pDEJ3 and pcDNA3.1(–) with XhoI and HindIII, followed by ligation. pDEJ5 was constructed by two steps of PCR and cloning. The forward primer (5′-CCGCTCGAGATGGTGAGCAAGGGCGAGG-3′) annealed to the first 19 base pairs of GFP and added a 5′ XhoI restriction site. The reverse primer (5′-CCATCATGTCTTCATAATCATCCTGCAGCTCCTCACCACCGCCACCCTTGTACAGCTCGTCCATGCC-3′) annealed to the last 21 base pairs of GFP, with the exception of the stop codon, which was removed. The reverse primer also contained four glycine codons and the first 34 base pairs of AE1 (excluding the initial ATG). The cDNA was generated by PCR (30 cycles of 94°C for 30 s, 56°C for 60 s, 72°C for 120 s). The second round of PCR included the original forward primer, a 1/50 dilution of the PCR product generated by the first round of PCR, pDEJ4 as template, and the reverse primer (5′-TGAGCCATGTAGGCATCTATGCGGAACACC-3′). The final PCR product and pDEJ4 were cut with XhoI and ClaI and ligated to generate pDEJ5 (GFP.AE1). pDEJ14 (mNect.AE1) was constructed using the same strategy as pDEJ5, except that pDEJ6 (mNect) was used as template in the first round of PCR instead of GFP. Mammalian expression construct GFP-Y66L.AE1 (pDEJ9) was generated through a two-step PCR strategy and cloning. The round 1 forward primer (5′-CCACTGCTTACTGGCTTATCG-3′) and reverse primer (5′-TGCACGCCGAGGGTCAGGG-3′) mutated TAC to CTC to render GFP non-fluorescent. The cDNA was generated by PCR (30 cycles of 94°C for 30 s, 53.7°C for 30 s, 72°C for 45 s). The second round of PCR included the original forward primer, a 1/50 dilution of the PCR product generated by the first round of PCR, pDEJ5 as template, and the reverse primer (5′-TCGTCCATCACCAGCTCC-3′). The final PCR product and pDEJ5 were digested with BmtI and BsrGI, and ligated to generate pDEJ9. Mammalian expression construct CNX.mNect (pDEJ19) was generated through a 3-step cloning process. First, pDEJ15 was generated by a single PCR step and cloning. The forward primer (5′-CCTTAGGATGGAAGGGAAGTGGTTACTGTGTTTG-3′) annealed to the first 27 base pairs of calnexin. The reverse primer (5′-GCGGTACCCTCTCTTCGTGGCTTTCTGTTTCTTGG-3′) annealed to the last 27 base pairs of the calnexin coding sequence, with the exception of the stop codon, which was removed. A KpnI site was also added to the 3′ end of the primer. The cDNA was generated by PCR (30 cycles of 94°C for 30 s, 63°C for 60 s, 72°C for 120 s), and then treated with T4 polynucleotide kinase to phosphorylate the 5′-OH of the PCR product. The treated PCR product was then ligated into a pcDNA3.1(+) vector that had been cut with EcoRV to generate pDEJ15. pDEJ17 was generated by a single PCR step and cloning. The forward primer (5′-GCGGTACCGGTGGTGTGAGCAAGGGCGAGGAGC-3′) annealed to the first 18 base pairs of pDEJ6 (mNect), with the exception of the start codon, which was removed. The primer also added a 5′ KpnI restriction site, and two glycine codons. The reverse primer (5′-AGAATTCACTCTCTTCGTGGCTTTCTCTTGTACAGCTCGTCCATGCC-3′) amplified the last 21 base pairs of mNect (pDEJ6), with the exception of the stop codon, which was removed. An ER-retention sequence (corresponding to amino acids RKPRRE) followed by a stop codon and an EcoRI restriction site were also added to the 3′ end of the primer. The cDNA was generated by PCR (30 cycles of 94°C for 30 s, 63°C for 60 s, 72°C for 120 s) and was inserted into the KpnI and EcoRI sites of pcDNA3.1(+) to generate pDEJ17. pDEJ15 and pDEJ17 were then digested with KpnI and ligated to generate CNX.mNect (pDEJ19). All fusion protein sequences were confirmed by sequencing (DNA Core Services Laboratory, University of Alberta, Department of Biochemistry).
Tissue culture
mNect, GFP, AE1, AE1-P652C, GFP.AE1, GFP-Y66L.AE1, mNect.AE1, mNect.hCNT3, hCNT3 and CNX.mNect constructs were expressed by transient transfection of HEK293 cells (Graham et al. 1977) using the calcium phosphate method (Ruetz et al. 1993). Cells were grown at 37°C in an air/CO2 (19:1) environment in Dulbecco's modified Eagle's medium, supplemented with 5% (v/v) fetal bovine serum, 5% (v/v) calf serum, and 1% (v/v) penicillin–streptomycin–glutamine. In experiments where fluorescence of intact HEK293 cells was monitored, HEK293 cells were grown on poly-l-lysine-coated 25 mm round glass coverslips, and transiently transfected with the appropriate cDNA.
Measurement of fluorescence in intact HEK293 cells
HEK293 cells, grown and transfected on round glass coverslips, were mounted in a 35 mm diameter Attofluor Cell Chamber (Molecular Probes). The chamber holds a custom-built insert, reducing the internal diameter to 13 mm and chamber volume to approximately 0.2 ml. During experiments the chamber was perfused at 3.5 ml min−1. The chamber was placed on the stage of a Wave FX Spinning Disc Confocal Microscope (Quorum Technologies, Guelph, Canada), using the Yokogawa CSU10 scanning head complemented with an emission filterwheel (Ludl MAC5000) carrying a dual bandpass (500–535 nm and 568–616 nm) emission filter (Chroma). The Olympus IX81 motorized inverted microscope has a motorized XY stage with Piezo Focus Drive (ASI, MS-4000 XYZ Automated Stage) and live cell environment chamber (Chamlide, Korea), set to 24°C or 37°C. Acquisition was performed with a Hamamatsu C9100-13 Digital Camera (EM-CCD), ×20 objective (air immersion, numerical aperature 0.75), DAPI laser (404 nm, for GFP) and RFP laser (561 nm, for mNect). GFP fluorescence data were acquired at 2 points s−1, and mNect fluorescence data were acquired at 0.5 points s−1 (to minimize photobleaching). Lasers are from Spectral Applied Research Inc. (Richmond Hill, ON, Canada). Image analysis was performed with Volocity 4.2 software (PerkinElmer, ON, Canada).
Alternatively, the chamber was placed on a Leica DMIRB inverted microscope, equipped with a PTI (Photon Technologies International) D-104 microscope photometer. The light source, connected to the microscope via a fibre optic cable, was a 75 W xenon arc lamp in a PTI DeltaScan dual-excitation monochromator equipped with a chopper. Excitation wavelengths were set to 400 nm (when monitoring GFP), or 440 and 502.5 nm (when monitoring BCECF). Wavelengths of emitted light were selected with a cube mounted in the microscope, containing a 425 nm beam splitter, and a cube mounted in the photometer containing a 485 nm beam splitter, a 445–475 nm emission filter, and a 495–525 nm emission filter (GFP only), or a cube mounted in the microscope containing a 515 nm beam splitter and a 522.5–547.5 nm emission filter (BCECF).
Calibration of fluorescence values for pH
To convert the fluorescence values observed for GFP and mNect to pH, transfected HEK293 cells mounted on the microscope stage were sequentially perfused with pH clamping buffers (5 mm glucose, 140 mm KCl, 5 mm potassium gluconate, 1 mm calcium gluconate, 1 mm magnesium sulfate, 2.5 mm sodium phosphate, 30 mm Hepes), containing 20 μm nigericin, at known pH values of approximately 6.5, 7.0 and 7.5 (Thomas et al. 1979). Fluorescence counts for GFP and mNect were measured, and corrected for photobleaching (see below and Johnson et al. 2009). A calibration curve relating the average fluorescence of each FP at each pH to the medium pH value was fitted to a straight line by linear regression. The resulting equation for the line was used to transform fluorescence data to intracellular pH.
Photobleaching correction
HEK293 cells expressing cytosolic FPs, or FP-fusions were perfused with nigericin/high potassium solution, pH 7.0, to clamp cytosolic pH, and excited as described above. Fluorescence values over time were converted to F/F0 and fitted with an exponential decay equation of the form:
where fluorescence starts at Span + Plateau and decays to Plateau with rate constant K. The half-life is 0.69/K. The variables over three photobleaching experiments, independently assessed for GFP and mNect, were averaged for each day, and the data for each experiment that day were corrected by the average decay equation.
Cl−/HCO3− exchange activity assay
Transfected HEK293 cells grown on glass coverslips and mounted on the microscope stage, as described above, were perfused with Cl−-containing Ringer buffer for 5 min before image acquisition to ensure that the pH of cells was at equilibrium. Cells were then perfused alternately with Ringer buffer (5 mm glucose, 5 mm potassium gluconate, 1 mm calcium gluconate, 1 mm MgSO4, 2.5 mm NaH2PO4, 25 mm NaHCO3− and 10 mm Hepes, pH 7.4), containing either 140 mm NaCl or 140 mm sodium gluconate. Both buffers were continuously bubbled with 5% CO2 (balance air) and a small shunt inserted into the custom-built insert allowed this gas mixture to be blown over the surface of the solution. At the end of each experiment, cells were subjected to pH calibration using the nigericin/high potassium method (described above). Between each experiment, the perfusion lines were rinsed sequentially with water, 100% ethanol and water to avoid nigericin contamination. Fluorescence of GFP and/or mNect was monitored at the excitation and emission wavelengths described above. Further, illumination was paused at times indicated during Cl−/HCO3− exchange to minimize photobleaching.
For confocal microscopy experiments, fluorescence values were obtained by using the freehand tool in Volocity 4.2 to select regions of interest (ROIs) on fluorescent cells. Three to five cells from each coverslip were analysed. Cytosolic ROIs were drawn to encompass the entire interior of cells. Plasma membrane (PM) ROIs were drawn as a thin boxed line around the periphery of cells (∼1 μm wide). Endoplasmic reticulum (ER) ROIs were drawn so that the centre of the ROI was about 4 μm away from the centre of the PM ROI. Background ROIs were selected in areas with no cells placed beside measured ROIs. The mean intensity of each ROI over time for the GFP and mNect channels was determined using Volocity software. The mean background intensity was subtracted from the mean intensity of each FP, and photobleaching correction applied (see above). Corrected fluorescence values were converted to pHi (as described above), and the Cl−/HCO3− exchange rates were calculated by linear regression of the initial rate of pHi change during perfusion with Cl−-free Ringer buffer (the slope (dpH/dt) of the line fitted by the least squares method).
Measurement of intrinsic buffer capacity and flux of proton equivalents
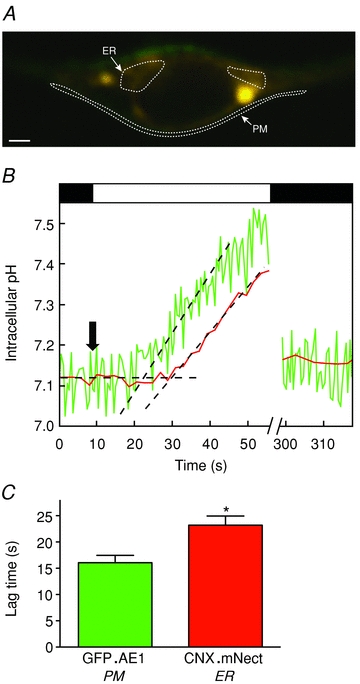
Intrinsic buffer capacity was measured using the ammonium chloride pulse method (Loiselle & Casey, 2010). Briefly, HEK293 cells grown on glass coverslips and transfected with GFP.AE1 cDNA were mounted on the confocal microscope stage and perfused consecutively with CO2/HCO3−-free Ringer buffer containing 50, 0, 1, 5, 10 and 20 mm NH4Cl. At the end of each experiment, cells were subjected to pH calibration, using the nigericin/high potassium method. GFP fluorescence in PM ROIs was corrected for photobleaching and converted to pHi, as described above. The intracellular NH4Cl concentration ([NH4Cl]i) was calculated using the Henderson–Hasselbalch equation, and the intrinsic buffer capacity (βi) was calculated as Δ([NH4Cl]i/ΔpHi (mm/pH) (Loiselle & Casey, 2010). Total buffer capacity (βtotal) was calculated as  , where
  (Sterling & Casey, 1999). Flux of proton equivalents (in mm min−1) was then calculated as dpHi/dt×βtotal (Sterling & Casey, 1999).
Measuring the time of initial pH rise
Cl−/HCO3− exchange assays were carried out on transfected HEK293 cells, and analysed as described above. Transport rates were determined by linear regression of the initial rate of pHi change upon switching to Cl−-free Ringer buffer. The baseline pHi was also fitted by linear regression. The point at which the two lines intersect was determined mathematically and that point on the X-axis (time, s) was defined as the time at which each FP begins to detect a change in pHi. The time at which the medium was switched to Cl−-free Ringer buffer was subtracted from this value to determine the absolute time to detect the pHi change. Alternatively, HEK293 cells transiently transfected with GFP.AE1 cDNA were perfused with CO2/HCO3−-free Ringer buffer containing 50 mm, then 0 mm NH4Cl, and response time determined as above.
Quantification of ER-associated fluorescence in PM ROI
HEK293 cells were grown on 25 mm round coverslips, and co-transfected with GFP.AE1 and CNX.mNect cDNA, or GFP.AE1 and mNect.hCNT3 cDNA. Cells were placed on the stage of a confocal microscope, and perfused continuously with Ringer buffer, pH 7.4. Cells were illuminated as described above for 30 s. ROIs were drawn along the plasma membrane of the cell. The mean intensity of each ROI over time for the GFP and mNect channels was determined using Volocity software. The mean background intensity was subtracted from the mean intensity of each FP. To correct for differences in ROI size and protein expression efficiency, fluorescence values were normalized to give the same GFP fluorescence in both cell types. The intensity of mNect fluorescence in the ER was assumed to be the same for cells expressing CNX.mNect or mNect.hCNT3. In this way the percentage ER-associated mNect fluorescence in PM ROI = CNX.mNect fluorescence/mNect.hCNT3 fluorescence × 100.
Distribution of GFP.AE1 and mNect.hCNT3 at the plasma membrane
HEK293 cells co-transfected with GFP.AE1 and mNect.hCNT3 cDNAs were analysed by confocal microscopy as described above. The level of FP abundance along portions of the plasma membrane were analysed with ImageJ software. Pixel intensity versus distance was plotted, and the area under the curve was analysed with PRISM software.
Calculation of average distance between GFP.AE1 and mNect.hCNT3 molecules
HEK293 cells grown on glass coverslips were co-transfected with cDNA encoding GFP.AE1, mNect.hCNT3 and untagged hCNT3. Cl−/HCO3− exchange assays were carried out as described above. Cells were harvested at the end of each experiment, and saved for later SDS-PAGE analysis. GFP.AE1 and mNect.hCNT3 expression levels were quantified, using three standards that were run alongside all experimental protein samples on SDS-PAGE gels. The molar amount (per 10 μl aliquot) of two of these standards, GFP.AE1 and mNect.AE1, were quantified by densitometry in comparison to a known amount of AE1-Ct standard (a purified GST fusion protein containing the last 40 amino acids (residues 872–911) of AE1) (Bonar & Casey, 2010), using the anti-AE1 (IVF12) antibody. The third standard is a sample in which cells were harvested, counted, and a known amount used as a cell number standard on subsequent blots. The standards and experimental samples for each day were separated by SDS-PAGE and immunoblotted. Immunoblots were probed for GAPDH (as a measure of number of cells), AE1 and RFP, which enabled the number of molecules/cell for GFP.AE1 and mNect.hCNT3 to be determined by densitometry. This value was multiplied by the percentage of protein at the cell surface (as determined by cell surface processing assays) to determine the absolute number of GFP.AE1 dimers and mNect.hCNT3 monomers at the cell surface per cell. The cell surface area of 2591 μm2 for HEK293 cells (Sommerhage et al. 2008) did not take into account processes extending from the cell surface, which were detected by electron microscopy (Gentet et al. 2000), which increase surface area by 50.3%. We therefore estimated the HEK293 cell surface area as 3887 μm2 (Gentet et al. 2000). The average GFP.AE1 dimer to mNect.hCNT3 monomer distance was calculated as the square root of (3887 μm2/(number of GFP.AE1 dimers + number of mNect.hCNT3 monomers)).
Statistical analysis
Values are expressed ± standard error of measurement. Statistical significance was determined using an unpaired t test (PRISM software), with P < 0.05 considered significant.
Results
Construction and characterization of pH-reporter fusion proteins
Our aim was to determine whether a H+ microdomain develops around AE1 as it exchanges Cl− for HCO3−, which requires a pH probe with high spatial and temporal resolution. We used pH-sensitive fluorescent proteins (FPs) with pKa (–log of the acid dissociation constant) values in the physiological range that localize to distinct regions. deGFP4 (called GFP here for simplicity) (Hanson et al. 2002) was fused to the N-terminal cytoplasmic domain of AE1 to construct GFP.AE1, which reported pH at the surface of AE1. We avoided fusion to the cytosolic C-terminal tail of AE1 out of concern that GFP might interfere with plasma membrane trafficking and CAII binding, both of which require the C-terminal AE1 tail (Chernova et al. 1997; Sterling et al. 2001). We characterized the functional activity of GFP.AE1 in comparison to AE1 alone and found that fusion of the FP did not affect AE1 transport activity (see Fig. 1 in online Supplemental material). To measure pH simultaneously at a plasma membrane region physically distant from AE1, we fused mNectarine (mNect, an RFP variant) to the intracellular N-terminus of an inactive isoform of the human Na+-coupled nucleoside co-transporter, hCNT3-F563C, generating mNect.hCNT3-F563 (called mNect.hCNT3 for simplicity) (Johnson et al. 2009). While wild-type hCNT3 can transport H+ along with nucleoside exclusively under acid conditions, the mutant hCNT3-F563C cannot transport H+ (Johnson et al. 2009). mNect.hCNT3 thus acts as a plasma membrane-localized protein, not involved in H+ translocation. To ensure that we could accurately measure pH near and away from AE1, we completed control experiments. We determined that GFP and mNect fluorescence could be measured concurrently without interference from each other. That is, there was no crosstalk between GFP and mNect (Supplemental Fig. 2). Similarly, we found that there was no fluorescence resonance energy transfer between GFP and mNect (Supplemental Fig. 3).
Halide sensitivity of FP fluorescence
Many fluorescent proteins are pH sensitive (Miesenböck et al. 1998), but the fluorescence of some is additionally quenched by halides (Wachter & Remington, 1999). This was an issue since AE1 exchanges Cl− for HCO3− thus affecting [Cl−] and [H+] concurrently. The degree to which GFP and mNect fluorescence were quenched by H+ and Cl− was quantified by measuring Stern-Volmer constants (Supplemental Fig. 4). The two FPs are quenched 108-fold more strongly by H+ than Cl− on a molar basis. Moreover, the two FPs will respond to a shift from 0 to 100 mm Cl− by a decrease in fluorescence of no more than 5%, indicating that both proteins are suitable to measure pH during Cl−/HCO3− exchange.
Correction for FP photobleaching
Extended periods of illumination of GFP and mNect, under pH-clamped conditions, resulted in a continuous decrease of fluorescence, indicative of photobleaching (Fig. 1A). We corrected for photobleaching by fitting fluorescence data from pH 7.0-clamped GFP and mNect co-transfected HEK293 cells (Fig. 1A) with an exponential decay equation, and applying an exponential correction (Johnson et al. 2009) (Fig. 1B). To limit the effects of photobleaching, FP illumination was paused during experiments when possible.
Figure 1. Photobleaching correction for GFP and mNectarine.
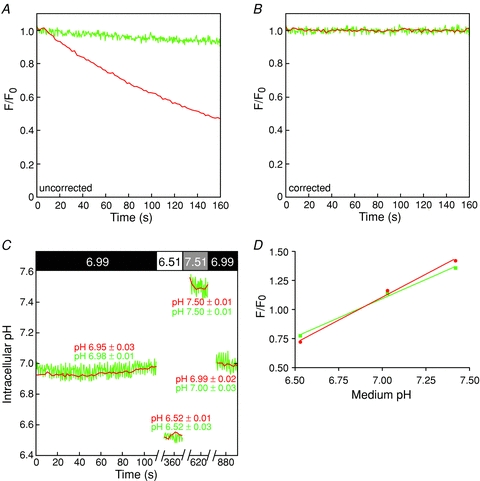
HEK293 cells grown on glass coverslips were transiently co-transfected with GFP and mNect cDNAs and placed on the stage of a confocal microscope. A and B, cells were perfused with nigericin/high potassium solution, pH 7.0 (24°C) to clamp cytosolic pH. GFP (green) and mNect (red) fluorescence were monitored. F0 is the initial fluorescence intensity and F is the fluorescence intensity at each time point. B, data from A have been corrected for photobleaching, using the approach described in Methods. C, cells were perfused consecutively with nigericin/high potassium medium, at the pHs indicated in bars at top. Fluorescence values were corrected for photobleaching and transformed to pH. Coloured numbers above and below the traces indicate average pH reported by each GFP (n = 5) and mNect (n = 5). In all experiments in which fluorescence of cells was analysed, n refers to the number of coverslips analysed. On each coverslip 3–5 cells were analysed. Breaks in the X-axis represent time (240 s) during which illumination was paused to minimize photobleaching. D, plot of F/F0versus medium pH derived from pH clamping experiment similar to that shown in C. Note that Y error bars are plotted, but are smaller than data points.
The ability of cytosolic GFP and mNect to report HEK293 cell cytosolic pH accurately following photobleaching correction was assessed by sequentially clamping cytosolic pH to medium pH, using the H+ ionophore nigericin (Fig. 1C). Data were corrected for photobleaching, and fluorescence was calibrated to cytosolic pH by generation of a standard curve, relating average fluorescence to medium pH at standard pH values. Average pH values during perfusion with each solution were then calculated (Fig. 1C). The absolute difference in pH reported by GFP and mNect was 0.02 ± 0.01 pH units, and the absolute difference between medium pH and FP-reported pH was 0.03 ± 0.01 and 0.02 ± 0.01 for GFP and mNect, respectively. The magnitude of these errors in measurement of cytosolic pH are close to the 0.01 pH unit error found previously for the well-established pH-sensor, BCECF-AM (Johnson et al. 2009). There was a linear relationship between medium pH and fluorescence of GFP and mNect in co-transfected cells (Fig. 1D). We conclude that after correction for photobleaching and appropriate calibration, GFP and mNect accurately report cytosolic pH.
Correspondence of GFP and mNect pH measurements
The accuracy of changes in pHi reported by cytosolic GFP and mNect during AE1-mediated Cl−/HCO3− exchange was examined next. HEK293 cells grown on glass coverslips were transiently co-transfected with cytosolic GFP, cytosolic mNect and either AE1 or AE1-P652C, a functionally inactive mutant of AE1 (Tang et al. 1998). Coverslips were placed on the stage of a confocal microscope, and perfused alternately with Cl−-containing Ringer buffer and Cl−-free Ringer buffer. The change in the transmembrane Cl− gradient upon switching to Cl−-free Ringer buffer drives AE1-mediated Cl− efflux from the cell in exchange for HCO3−, causing an intracellular alkalinization detected by the pH-sensitive FPs as an increase in fluorescence. HCO3− transport rates were determined by linear regression of the initial rate of pHi change upon switching to Cl−-free Ringer buffer. A rise in pHi in response to switching to Cl−-free Ringer buffer was observed for GFP/mNect/AE1 co-transfected cells (Fig. 2A), but not for cells co-transfected with inactive AE1-P652C (Fig. 2B). Flux of H+-equivalents (mm min−1) was calculated as dpHi/dt×βtotal, where  , and where βi was experimentally determined (Supplemental Fig. 5), and
 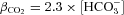 (Sterling & Casey, 1999). The H+-equivalent fluxes reported by GFP and mNect in AE1 co-transfected cells did not differ significantly from each other (Fig. 2C). Background H+-equivalent flux reported by GFP and mNect in AE1-P652C co-transfected cells also did not differ significantly from each other (Fig. 2C). The slight acidification observed suggests that there may be a slight increase in the CO2 concentration in the Cl−-free Ringer solution, which would slightly decrease the rate of measured alkalinization observed in AE1-transfected cells (Fig. 2A). Together, these data reveal that GFP and mNect report indistinguishable pH values during AE1-mediated Cl−/HCO3− exchange, and that the alkalinization observed in AE1-transfected cells arises from the change in the Cl− gradient, and not a decrease in CO2 concentration between the two solutions.
Figure 2. pH and response time measured using cytosolic GFP and mNectarine during AE1-mediated Cl−/HCO3− exchange.
HEK293 cells grown on glass coverslips were transiently co-transfected with GFP, mNect and wild-type (WT) AE1 cDNA (A) or with GFP, mNect and AE1-P652C cDNA, a functionally inactive mutant of AE1 (B). Coverslips were placed on the stage of a confocal microscope, and perfused alternately with Cl−-containing Ringer buffer (black bars) and Cl−-free Ringer buffer (white bar), at 24°C. At the end of each experiment pH was calibrated via the nigericin/high potassium technique (not shown). Green and red traces represent GFP and mNect fluorescence, respectively. Fluorescence values were corrected for photobleaching, and transformed to pH. Breaks in the X-axis represent time (240 s) during which illumination was paused to minimize photobleaching. Dashed lines represent linear regression of baseline pHi and initial rate of pHi change resulting from Cl−/HCO3− exchange. Black arrow indicates the time point when perfusion was switched to Cl−-free Ringer buffer. C, quantification of the initial Cl−/HCO3− exchange rate upon switching to Cl−-free Ringer buffer. Error bars represent SEM (n = 3 (AE1-WT) or 4 (AE1-P652C)). N.S. indicates non-significant difference (P = 0.9 and P = 0.5, for AE1-WT and AE1-P652C, respectively). D, in Cl−/HCO3− exchange assays of cells transfected with AE1-WT, response time represents the elapsed time between perfusion switch to Cl−-free Ringer buffer (indicated by black arrow in A) and the start of pHi rise reported by cytosolic GFP and cytosolic mNect. Error bars represent SEM (n = 4). N.S. indicates non-significant difference (P = 0.8).
In each Cl−/HCO3− exchange assay, cells were perfused with Ringer buffer, followed by Ringer buffer without Cl−, to induce AE1-mediated Cl−/HCO3− exchange and associated alkalinization. Illumination was then consistently paused for 240 s to minimize photobleaching and perfusion was concomitantly switched back to Cl−-containing Ringer buffer. Following this 240 s interval without illumination (see break in X-axis Fig. 2A and B), samples were again illuminated in order to record the return to baseline pH. The data following the pause in illumination show the return to baseline pH, indicating that correction for photobleaching was effective.
To examine the temporal response of free cytosolic GFP and mNect to changes in pHi we measured the time between the removal of extracellular Cl− and the FP's detection of a change in pHi during AE1-mediated Cl−/HCO3− exchange (Fig. 2A). dpHi/dt was determined by linear regression of the initial rate of pHi change upon switching to Cl−-free Ringer buffer. Baseline pHi was also fitted by linear regression. The intersection of these two lines represents the time when each FP began to detect a change in pHi (Fig. 2A). The time at which the medium was switched to Cl−-free Ringer buffer was subtracted from this value to obtain the response time to detect the pHi change. Measured in this way, response time integrates the time taken to exchange media, the rate of pHi change induced by AE1, the rate of H+ diffusion and the time taken for the FP to change fluorescence upon pH variation. All of these factors, but the last, are the same for GFP and mNect in the experimental design used here, so any difference in response time is attributable to a difference in temporal response of the two FPs. There was no significant difference in response time during Cl−/HCO3− exchange between cytosolic GFP and mNect (10.7 ± 1.6 s and 11.3 ± 1.0 s, respectively) (Fig. 2D). To assess the temporal responsiveness of GFP and mNect independently of Cl−/HCO3− exchange, we also measured GFP and mNect response time after an NH4Cl pre-pulse (Supplemental Fig. 6). There was no significant difference in cytosolic GFP and mNect response time (7.9 ± 0.1 s and 7.9 ± 0.3 s, respectively) (Supplemental Fig. 6). To further examine the nature of the time delay, we measured the time taken to detect the fluorescence of BCECF upon switching from medium alone to medium containing the fluorophore BCECF. BCECF was initially detected at 5.4 ± 1.0 s, with complete media exchange occurring at 10.4 ± 2.4 s (data not shown). Thus of the 7.9 s response time for GFP and mNect to detect NH4Cl-associated acidification, 5.4 s arises from the time to exchange solutions in the perfusion chamber. Together, these data reveal that the temporal responses of GFP and mNect to changes in pH are indistinguishable, and that a significant component of the time delay is the time taken to exchange the solution (Fig. 2D and Supplemental Fig. 6).
Discrimination of ER and plasma membrane fluorescence
As is common with membrane proteins expressed in transfected cells, AE1 does not process fully to the plasma membrane (PM) in HEK293 cells (Sterling et al. 2001). The presence of endoplasmic reticulum (ER)-retained GFP.AE1 leads to the possibility that fluorescence measurements report not only on plasma membrane GFP.AE1, but also ER-associated GFP.AE1 not experiencing a transmembrane Cl− gradient and therefore not active in Cl−/HCO3− exchange. As the ER forms a reticular network and comes into very close proximity to the PM (Bola & Allan, 2009), fluorescence measured from a PM region of interest (ROI) might also include ER-associated fluorescence. To quantify the ER-associated fluorescence in the PM ROIs, mNect was fused to the cytoplasmic C-terminus of the ER-marker, calnexin (CNX) (Rajagopalan et al. 1994; Michalak et al. 2009). Cells were co-transfected with GFP.AE1 and CNX.mNect cDNAs, or GFP.AE1 and mNect.hCNT3 cDNAs, and the GFP and mNect fluorescence was determined in PM ROIs of each cell type. To normalize for differences in protein expression and size of ROI, mNect fluorescence was normalized to set GFP fluorescence to the same level in each ROI. Assuming that the intensity of ER-associated mNect fluorescence was the same in cells expressing mNect.hCNT3, or CNX.mNect, we determined the amount of mNect fluorescence in the PM ROI arising from ER-associated mNect. Approximately 17% of the PM mNect signal arose from ER-associated mNect (data not shown), which needs to be considered when interpreting later results.
Measurement of the rate of H+ diffusion from plasma membrane to cytosolic surface of ER
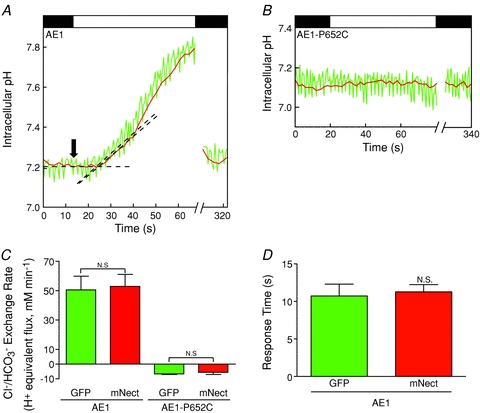
To measure the H+ diffusion rate from the plasma membrane to the ER surface, Cl−/HCO3− exchange was carried out in cells co-expressing GFP.AE1 and CNX.mNect. PM and ER ROIs were selected (Fig. 3A), and fluorescence intensities determined. Following removal of extracellular Cl−, the lag time to detect the rise of pH at CNX.mNect was significantly longer (23.2 ± 1.8 s) than at GFP.AE1 (16.1 ± 1.4 s) (Fig. 3B and C). It took approximately 7 s longer for CNX.mNect to detect a change in pHi initiated by AE1 at a distance of 4 μm from AE1 (the distance between the PM and centre of ER ROIs), which corresponds to a H+ diffusion rate of 0.6 μm s−1. The lag time does not arise from the rate at which each FP is able to report pH, since the two free cytosolic FPs have the same temporal responsiveness (Fig. 2D and Supplemental Fig. 6).
Figure 3. Lag time associated with Cl−/HCO3− exchange: measurement at plasma membrane and endoplasmic reticulum.
A, live cell fluorescence confocal image of an HEK293 cell, transiently co-transfected with GFP.AE1 and CNX.mNect cDNAs. White dashed lines illustrate the regions of interest (ROIs) whose fluorescence was quantified as a function of time, using the approach described in Methods. PM and ER indicate plasma membrane ROI and ER ROI, respectively. White bar represents 4 μm. B, HEK293 cells grown on glass coverslips were co-transfected with GFP.AE1 and CNX.mNect cDNAs. Coverslips were placed on the stage of a confocal microscope, and perfused alternately with Cl−-containing Ringer buffer (black bars) and Cl−-free Ringer buffer (white bar), at 24°C. At the end of each experiment, pH was calibrated via the nigericin/high potassium technique (not shown). Green and red traces represent GFP.AE1 and CNX.mNect fluorescence, respectively. Fluorescence values were corrected for photobleaching, and converted to pH. Breaks in the X-axis represent time (240 s) during which illumination was paused to minimize photobleaching. Black dashed lines represent linear regression of baseline pHi and initial rate of pHi change resulting from Cl−/HCO3− exchange. Black arrow indicates the time point when perfusion switched to Cl−-free Ringer buffer. C, lag time between changing to Cl−-free buffer and start of rise in pHi for plasma membrane GFP.AE1 and ER-resident CNX.mNect. Error bars represent SEM (n = 3). Asterisk indicates significant difference (P = 0.03).
Measurement of the rate of H+ diffusion along the cytosolic surface of the plasma membrane
The central question we wanted to answer is: does the pH in the immediate environment of AE1 differ from other sites at the plasma membrane? To answer this question, we measured pHi changes and differences in time of pH rise (ΔT) at varied GFP.AE1:mNect.hCNT3 co-transfection ratios during AE1-mediated Cl−/HCO3− exchange. Varying the amount of mNect.hCNT3 cDNA at constant levels of GFP.AE1 cDNA will produce cells with differing amounts of mNect.hCNT3 at the plasma membrane. Correspondingly, there will be a range of average distances between GFP.AE1 and mNect.hCNT3.
The mean GFP.AE1–mNect.hCNT3 distance was calculated on the basis of the amount of GFP.AE1 and mNect.hCNT3 present in each cell (Supplemental Fig. 7), and fraction of protein at the cell surface (Supplemental Fig. 8). If hCNT3 is present as oligomers it would change the calculation of distribution in the HEK293 cell membrane. Gel electrophoresis, using the non-denaturing detergent perfluorooctanoic acid, revealed that hCNT3 exists in the membrane as a monomer (Supplemental Fig. 9), which was used in calculations of protein distribution. Given the detection limits of GFP and mNect we were unable to make measurements over a broader range of GFP.AE1:mNect.hCNT3 expression ratios.
These calculations assume a random distribution of proteins at the plasma membrane. To investigate the distribution of the FPs at the plasma membrane, HEK293 cells co-transfected with GFP.AE1 and mNect.hCNT3 cDNAs were analysed by confocal microscopy. Less than 4% of pixels at the plasma membrane could be detected as peaks whose intensities were more than 10% of the maximum intensity (data not shown). We conclude that GFP.AE1 and mNect.hCNT3 are expressed randomly at the plasma membrane of HEK293 cells, at least at the resolution of the light microscope.
Two parameters were assessed as measures of H+ microdomain formation at the plasma membrane during Cl−/HCO3− exchange by AE1. (1) ΔT. If a H+ microdomain forms there should be a difference between the times when GFP.AE1 and a protein distant from AE1 (mNect.hCNT3) sense the pHi change. (2) Rate of pH change. During HCO3− influx the pH will rise as a result of base entry. We expect that the rate of pH change detected by GFP.AE1 will be faster than the rate detected by a distant protein, as the pH gradient would be highest at the centre of the H+ microdomain.
Cl−/HCO3− exchange assays were conducted on HEK293 cells co-expressing GFP.AE1 and mNect.hCNT3 (Fig. 4A) over the range of distances described above. Time differences and rates of pHi change were determined in PM ROIs (as seen in Fig. 3A).
Figure 4. Evidence for a H+ microdomain around AE1.
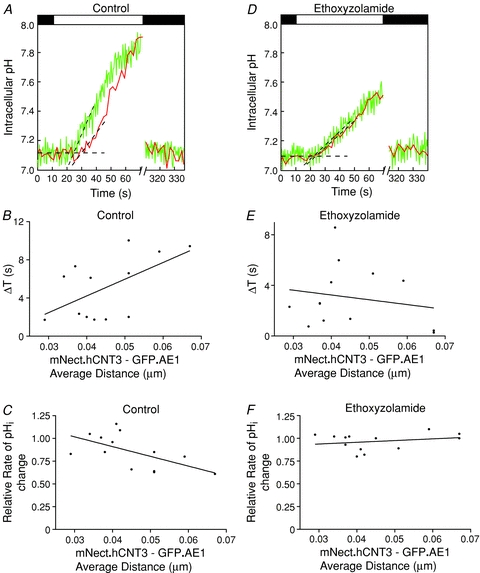
HEK293 cells grown on glass coverslips were transiently co-transfected with cDNA encoding GFP.AE1, mNect.hCNT3 and untagged hCNT3. The amount of GFP.AE1 cDNA remained constant, and the amount of mNect.hCNT3 decreased, compensated by increasing amounts of hCNT3 cDNA alone, to maintain a constant combined amount of mNect.hCNT3 and hCNT3 cDNA. With appropriate calibration this enabled determination of average distance between mNect.hCNT3 and GFP.AE1. Coverslips were placed on the stage of a confocal microscope, and perfused alternately with Cl−-containing Ringer buffer (black bars) and Cl−-free Ringer buffer (white bar), containing either (A–C) DMSO (control) or (D–F) 100 μm ethoxyzolamide, at 37°C. A and D, pH transient observed for GFP.AE1 (green) and mNect.hCNT3 (red) molecules at a distance of ∼0.07 μm apart. Breaks in the X-axis represent time (240 s) during which illumination was paused to minimize photobleaching. Black dashed lines represent linear regression of baseline pHi and initial rate of pHi change resulting from Cl−/HCO3− exchange. The difference between the time when a pHi rise was detected at GFP.AE1 and at mNect.hCNT3 was calculated as the time delay (ΔT) (B and E). The data were fitted by linear regression, and the slope of the line is significantly different from zero (P = 0.04, R2= 0.6) in control, and not significant in the presence of ethoxyzolamide (P = 0.5, R2= 0.2). C and F, the rate of pHi change at the surface of GFP.AE1 and mNect.hCNT3 was measured during Cl−/HCO3− exchange and relative rate of pHi change = hCNT3 rate/AE1 rate. The data were fitted with linear regression, and the slope of the line is significantly different from zero (P = 0.03, R2= 0.6) in control, but not in the presence of ethoxyzolamide (P = 0.4, R2= 0.3).
Time differences (ΔT) were measured as the difference between the extrapolated time when each of the two pH-reporter FPs initially detected a rise in pHi during Cl−/HCO3− exchange (Fig. 4A). Plots of ΔT versus average GFP.AE1–mNect.hCNT3 distance revealed that ΔT increased with increasing distance (Fig. 4B), and that the slope of the linear regression fit was significantly different from zero (P = 0.04). The slope of the linear fit is 175 s μm−1, which corresponds to a H+ diffusion rate along the plasma membrane of 0.01 μm s−1. The time difference between when pHi changes were detected at the surface of GFP.AE1 and mNect.hCNT3 is consistent with a H+ microdomain originating at the surface of AE1 during HCO3− transport.
Estimation of the size of the H+ microdomain
The dataset was analysed in a second way. The initial rate of pHi change initiated by AE1-mediated Cl−/HCO3− exchange reported by mNect.hCNT3 was normalized to the rate reported by GFP.AE1 (Fig. 4A) and plotted as a function of distance between the two proteins (Fig. 4C). The slope of the linear regression fit was significantly different from zero (P = 0.03), indicating that distant mNect.hCNT3 detects a lower rate of pHi change than detected at the surface of AE1. We measured differences in pHi that extended ∼0.07 μm from AE1. Thus, our calculations of average distances have allowed us to estimate the size of the H+ microdomain at a resolution smaller than the limit of light microscopy. Extrapolation of the linear fit to the relative rate of pHi change limit of 0 revealed a distance of 0.13 μm, which represents the limit over which the environment around AE1 differs. In other words, this provides an estimate of the radius of the H+ microdomain, assuming the data (Fig. 4C) can be fitted to a straight line. We could not justifiably fit the data with another function, so 0.13 μm is the best estimate of the radius (0.3 μm diameter) of the H+ microdomain surrounding AE1. We conclude that plasma membrane proteins distant from AE1 experience a slower rise in pH during AE1-mediated HCO3− influx, over a narrow distance range, consistent with a H+ microdomain around AE1. We further analysed the plateau pH reached upon achieving equilibrium in Cl−-free medium (Supplemental Fig. 10). There was no significant difference between the plateau pH detected by GFP.AE1 and mNect.hCNT3, when the proteins were separated by either 0.03 μm or 0.07 μm (Supplemental Fig. 10). This indicates that the H+ microdomain diminishes within the approximately 50 s taken to reach the new equilibrium pH.
Role of carbonic anhydrase in H+ microdomain formation
Carbonic anhydrase has two opposing roles in the generation of a H+ microdomain around AE1. CAII maximizes the Cl−/HCO3− exchange rate of AE1 (Sterling & Casey, 2002) (increasing the potential to develop a H+ microdomain), but CA also accelerates H+ diffusion (Stewart et al. 1999; Spitzer et al. 2002) (dissipating a H+ microdomain). In AE1-transfected cells, endogenous CAII expression levels are approximately stoichiometric with AE1 (Sterling & Casey, 2002) and no other cytosolic CA isoform is known to be expressed in HEK293 cells. To examine the role that CAII has in the development of the H+ microdomain around AE1, Cl−/HCO3− exchange assays were conducted in HEK293 cells co-transfected with different expression ratios of GFP.AE1 and mNect.hCNT3 in the presence of the carbonic anhydrase inhibitor, ethoxyzolamide (Fig. 4D–F). CA inhibition decreased the rate of Cl−/HCO3− exchange by 66%, and suppressed H+ microdomain formation as indicated by the lack of effect of changing GFP.AE1–mNect.hCNT3 distance on either ΔT (Fig. 4E) or rate of pHi change (Fig. 4F). This contrasts with the data collected using coverslips from the same dish of transfected cells, in the absence of ethoxyzolamide, where a H+ microdomain was observed (Fig. 4B and C).
The experiments of Fig. 4 were performed at physiological 37°C. To determine the effect of temperature on H+ microdomain development, we performed the same analysis at 24°C (Fig. 5). These experiments confirmed the presence of a H+ microdomain around AE1. At 24°C the estimated radius of the H+ microdomain was slightly larger, 0.17 μm, than that found at 37°C, consistent with a slowed diffusion rate at lower temperature. Measurement of the H+ diffusion rate on the basis of ΔT, however, indicated a slope of 99 s μm−1 (0.01 μm s−1), which does not differ from the rate of H+ movement at 37°C.
Figure 5. Effect of temperature on the H+ microdomain around AE1.
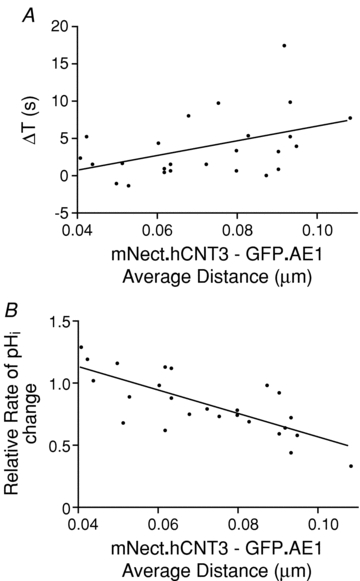
HEK293 cells grown on glass coverslips were transiently co-transfected with cDNA encoding GFP.AE1, mNect.hCNT3 and untagged hCNT3. The amount of GFP.AE1 cDNA remained constant, and the amount of mNect.hCNT3 decreased, compensated by increasing amounts of hCNT3 cDNA alone, to maintain a constant combined amount of mNect.hCNT3 and hCNT3 cDNA. Coverslips were placed on the stage of a confocal microscope, and perfused alternately with Cl−-containing Ringer buffer and Cl−-free Ringer buffer, at 24°C. At the end of each experiment, pH was calibrated via the nigericin/high potassium technique. With appropriate calibration this enabled the determination of the mean distance between mNect.hCNT3 and GFP.AE1. A, the difference between the time when a pHi rise was detected at GFP.AE1 and at mNect.hCNT3 was calculated as time delay (ΔT). The data were fitted by linear regression, and the slope of the line is significantly different from zero (P = 0.03, R2= 0.4). B, the rate of pHi change at the surface of GFP.AE1 and mNect.hCNT3 was measured during Cl−/HCO3− exchange. The figure plots the rate of pHi change at the surface of hCNT3/rate at surface of AE1. The data were fitted by linear regression, and the slope of the line is significantly different from zero (P < 0.0001, R2= 0.7).
Discussion
In this study we addressed the question of whether a H+ microdomain forms around the pH-regulatory transporter, AE1. Rapid AE1-mediated HCO3− transport, combined with a low rate of H+ diffusion in the cytosol, could cause discontinuities in pH (a H+ microdomain) immediately surrounding AE1. To measure the H+ microdomain around AE1, the pH-sensitive fluorescent proteins GFP and mNect were fused to AE1 and the inactive control plasma membrane protein hCNT3, respectively. As the distance between GFP.AE1 and mNect.hCNT3 increased, there was a time delay in the detection of pHi change and a reduction in the rate of pHi change at hCNT3, corresponding to a H+ microdomain spanning 0.3 μm in diameter (Fig. 6). Carbonic anhydrase enzymes have a central role in the development of the H+ microdomain around AE1 as pharmacological inhibition of carbonic anhydrase activity abolished the H+ microdomain. Under physiologically significant conditions (pH changes developed by the activity of membrane transport proteins initiated only by ion gradients) there is a time delay between when the pH change occurs at the plasma membrane and when it reaches intracellular organelles, representing the rate of H+ movement across the cytosol. H+ microdomains may be associated with other pH-regulatory transporters, which has broad implications for cellular functions.
Figure 6. Model for H+ diffusion and H+ microdomain around AE1.
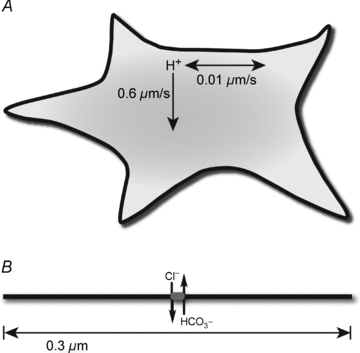
A, in HEK293 cells two different H+ diffusion rates were observed, 0.6 μm s−1 moving outwards from the plasma membrane and 0.01 μm s−1 horizontally along the plasma membrane. B, diagram depicts a region of the plasma membrane (thick black line), which is approximately 40 Å thick in mammals. AE1 (grey oval), facilitating transmembrane Cl−/HCO3− exchange, is 120 Å long (Wang et al. 1993). The H+ microdomain around AE1 was estimated as 0.3 μm in diameter.
Size of the H+ microdomain
A H+ microdomain is defined as a discrete region (∼1 μm in diameter) with a pH value that differs from the surrounding cytoplasm by >0.1 pH unit (Ro & Carson, 2004). We found that pH around AE1 differs from pH at other locations on the plasma membrane, in a region extending 0.13–0.17 μm from AE1, corresponding to a H+ microdomain of 0.3 μm diameter (Fig. 6). There may be an error in our estimation of AE1–hCNT3 distance. As mentioned, we may under-represent the microdomain measured, since 17% of the fluorescence measured arises from ER-associated proteins. There is some uncertainty of the actual surface area of an HEK293 cell, and errors in our estimate would alter the calculated size of the microdomain. Further, it is difficult to gauge how much error is associated with the immunoblot analysis used to calculate protein density in the plasma membrane. In the end, while there is some uncertainty about the exact distance over which a H+ microdomain was observed surrounding AE1, the data are compelling that as distances extend away from AE1, the remote location detects a slower rate of pHi change relative to AE1, with a delay in the detection of the change in pH. This conclusion is not likely to be confounded by other interpretations since results of control experiments rule out these possibilities. Cytosolic GFP and mNect report pHi indistinguishably, with respect to their response time and the rate of pHi rise they detect, so the differences we report here do not arise from the different fluorescent reporters fused to AE1 and hCNT3. GFP and mNect fluorescence were discretely measured, with no interference from one FP into the wavelength range used to measure the other FP. There was no fluorescence resonance energy transfer between GFP and mNect, so differences observed over the range of GFP.AE1:mNect.hCNT3 expression ratios were not confounded by this phenomenon.
How does the scale of the observed H+ microdomain compare to that of other cellular structures? Ca2+ and cAMP microdomains of 0.4–2 μm occur in cardiomyocytes (Sugimori et al. 1994; Zaccolo & Pozzan, 2002; Tian & Xie, 2008), so the 0.3 μm H+ microdomain is potentially smaller. Solute microdomain size varies with solute transport rate, diffusion rate and cytosolic concentration of substance (Barros & Martinez, 2007), so it is not surprising that a H+ microdomain differs from other solute microdomains. Ca2+ channels localize to plasma membrane lipid rafts and caveolae, which are 0.01–0.2 μm and 0.05–0.1 μm in diameter, respectively (Pani & Singh, 2009). The 0.3 μm H+ microdomain around AE1 is therefore larger than lipid rafts and caveolae, which act as organizing centres for cell signalling. Cardiomyocyte transverse tubules occur at intervals of ∼2 μm along the longitudinal axis of myocytes, and as such, no part of the cytoplasm is more than ∼1 μm from the nearest T-tubule (Orchard & Brette, 2008), suggesting that H+ microdomains of less than 1 μm may form. Interestingly, Cl−/HCO3− exchangers, AE3 and SLC26A6, localize to transverse tubules and sarcoplasmic reticulum of cardiomyocytes, where they have been suggested to function in localized pH regulation (Alvarez et al. 2007).
Role of carbonic anhydrase in H+ microdomain formation
The data here indicate that carbonic anhydrase activity is required for the H+ microdomain to form. The carbonic anhydrase inhibitor ethoxyzolamide suppressed H+ microdomain formation. CA may play multiple roles in H+ microdomain formation. First, we found that the rate of Cl−/HCO3− exchange decreases by 66% upon CA inhibition, consistent with previous data (Sterling et al. 2001). The reduced rate of HCO3− transport will reduce the driving force for H+ microdomain formation, allowing H+ diffusion to overcome H+ accumulation. Indeed, the ability of CA activity (in conjunction with CO2/HCO3− buffer) to diminish a H+ microdomain (by increasing H+ diffusion) depends on the magnitude of acid-equivalent flux (Swietach et al. 2005). CA activity had virtually no effect on H+ mobility when rapid acid-equivalent fluxes were induced in cardiomyocytes (Swietach et al. 2005, 2007), while CAII had a dramatic effect on H+ diffusion away from the slower transporting MCT1 (Becker & Deitmer, 2008) and PepT1 (Stewart et al. 1999). Second, considerable evidence supports the existence of a HCO3− transport metabolon, the physical complex of AE1 with cytosolic CAII (Johnson & Casey, 2009). Since CAII localizes to the cytosolic C-terminus of AE1, the site of H+ production or consumption is also localized to the surface of AE1, promoting H+ microdomain formation. Inhibition of CA function leaves CO2 ⇆ HCO3−+ H+ interconversion to occur uncatalysed and at random locations in the cytosol, which is counter to H+ microdomain formation.
Rates of H+ diffusion
H+ diffusion from AE1 at the plasma membrane to ER-localized CNX.mNect occurred at 0.6 μm s−1 (Fig. 6) while, ∼1.5 μm s−1 was reported for H+ diffusion in cardiomyocytes (Vaughan-Jones et al. 2002; Swietach et al. 2005). Great care needs to be taken in comparing our value for H+ diffusion to that reported in cardiomyocytes, given the difference in experimental conditions. In the cardiomyocyte experiments, acid was microinjected into the cells, resulting in a faster rise in [H+]. Moreover, a much larger [H+] gradient was present in the cardiomyocyte experiments than in our own. Acid was microinjected at pH 3 (1 mm H+), diffusing into cytosolic pH around pH 7.2 (6.3 × 10⁻⁸m H+), giving a concentration gradient of 16,000-fold. In our experiments, pH rose to only 7.8 (1.6 × 10⁻⁸m H+) from a baseline of pH 7.2 (6.3 × 10⁻⁸m H+), corresponding to a [H+] gradient of only 4-fold. Since the concentration gradient provides the driving force for H+ diffusion, we would expect a lower rate of H+ diffusion when pH changes were driven by physiological Cl−/HCO3− exchange than when driven by non-physiological, large concentration gradients. Cardiomyocytes may also differ in cytosolic structure/composition compared to HEK293 cells, and are rod-shaped, which may also contribute to the observed differences in diffusion rates.
Experiments in cardiomyocytes (Vaughan-Jones et al. 2002; Swietach et al. 2005) were performed with great care, and with an experimental design that enabled greater precision and modelling than was possible for our experiments. In cardiomyocytes it was possible to determine H+ diffusion coefficients, but this was not possible in the present experimental design, unfortunately. Use of diffusion coefficients allows for a better prediction of diffusion rates; rate will vary with distance since diffusion coefficients have units of cm2 s−1. Our measurement of a diffusion rate of 0.6 μm s−1 was measured over a distance of 4 μm, but will not be accurate over other scales. Nevertheless, the value does provide some notion of the time scale for H+ diffusion through cytosol associated with membrane transport of H+ equivalents.
The H+ diffusion rate from AE1 to hCNT3 (0.01 μm s−1) along the plasma membrane is 60-fold slower than the rate from AE1 to the ER surface, across the cytosol (Fig. 6). As discussed above, the diffusion rate applies to only a single distance and the caveats discussed above apply equally here. Because of the small distance scale over which these measurements were made, the slow rate of diffusion implies a dramatically low diffusion coefficient for H+ along the cytosolic surface of the plasma membrane. In these experiments great care was taken to control for confounding factors that might have influenced the results. Nonetheless, given the surprisingly slow rate of H+ diffusion that we have observed along the membrane surface, it is possible that some methodological artefact is present in the experiment. Indeed, we have already stated concern about our estimation of HEK293 cell surface area; underestimation of the cell's area would lead to an underestimation of the diffusion rate. Arguing against a systematic methodological error, however, the time when pH changes were detected and the rate of pH change both varied with distance from AE1 in repeated experiments performed at two different temperatures (Figs 4 and 5). The possibility of a methodological problem is also reduced by the observation that inhibition of carbonic anhydrase suppressed the distance dependence of the time and rate of pH change (Fig. 4).
We can only speculate about the cause for the surprisingly slow H+ diffusion rate along the plasma membrane. Restriction of diffusion by the plasma membrane barrier may contribute to the slow rate. Negative surface charge associated with the inner leaflet of the plasma membrane attracts cationic molecules (Yeung et al. 2008); such lipid-associated charged sites could also slow H+ movement along the plasma membrane surface. Many fixed or slowly diffusing ionizable groups reside close to AE1 since protein diffusion is slow in the plane of the bilayer and many membrane proteins are further constrained by cytoskeletal interactions. Association of H+ with physically restricted proteins will slow their diffusion. Together these data provide a first measurement of the diffusion of H+ from point sources along the plasma membrane.
H+ buffering is also a consideration in this work, as GFP and mNect (fused to AE1 and hCNT3) contain protonatable amino acid side-chains. We note that each AE1 transports up to 5 × 10⁴ ions s−1, while each AE1 has one GFP associated with it. The only residues likely to contribute to pH buffering in the physiological range are histidine (pKa 6.1) and lysine (pKa 10.5), of which 8 and 20 are found in GFP, respectively. The maximum buffering that GFP could provide is thus miniscule on the scale of the H+-equivalent flux carried by AE1. Furthermore, while we have fixed GFP onto the cytoplasmic domain of AE1, potentially adding to local buffering, we note that AE1 in erythrocytes and in kidney is part of a large fixed ‘macrocomplex’ composed of cytoskeletal proteins and integral membrane proteins (Bruce et al. 2003; Keskanokwong et al. 2007; Wu et al. 2010). Thus, the physiological environment of AE1 contains a high level of fixed proteins, which would contribute more strongly to localized buffering than would GFP.
Potential physiological significance of H+ microdomains and observed low rates of H+ diffusion
What significance does the AE1-associated H+ microdomain have on erythrocyte function? Erythrocyte pH has a profound effect on haemoglobin function, as an increase in the concentration of H+ or CO2 reduces the O2 affinity of haemoglobin, known as the Bohr effect, which is key to O2 release into the tissues (Jensen, 2004). AE1 carries out its Cl−/HCO3− function in the brief (0.2–1 s) periods when the erythrocyte transits peripheral and pulmonary capillaries (Kayar et al. 1992). In the 0.2–1 s capillary transit time, a H+ gradient generated by AE1 activity will move laterally along the erythrocyte membrane 0.002–0.01 μm, and move radially into the cell 0.1–0.6 μm. Since erythrocyte diameter is ∼8 μm (Jay, 1975), H+ diffuse throughout only a small fraction of the entire erythrocyte. The haemoglobin-dense erythrocyte cytosol has an especially high buffer capacity (Swietach et al. 2010) which may slow H+ diffusion because of restricted haemoglobin mobility. This slow rate of H+ diffusion may in part explain the requirement for the exceptionally high density of AE1 in the erythrocyte, where it constitutes 50% of integral membrane protein (Fairbanks et al. 1971).
Do these data suggest that H+ microdomains form around other pH-regulatory transporters? The ubiquitous and arguably most important pH-regulatory transporter is the alkalinizing Na+/H+ exchanger NHE1 (Malo & Fliegel, 2006). Since AE1 is dimeric (Casey & Reithmeier, 1991), a larger H+ microdomain would be expected to form than if AE1 were monomeric. NHE1 is also dimeric (Moncoq et al. 2008), and has a relatively rapid turnover rate of ∼700–2000 s−1 (Dixon et al. 1987; Cavet et al. 1999). While this rate is lower than AE1 (up to 5 × 10⁴ s−1), a H+ microdomain smaller than that of AE1 may still form around NHE1. The turnover rates of other pH-altering transporters are much slower: the proton-dependent oligopeptide transporter isoform 1 has a turnover rate of 100 s−1 (Mackenzie et al. 1996), and the monocarboxylate transporter isoform 1 has a turnover rate of 12 s−1 (Ovens et al. 2010), thereby decreasing the magnitude of a possible H+ microdomain around them.
The localized pHi changes we have measured could lead to a localized regulation of function of nearby proteins. Indeed, Ca2+-sensitive adenylyl cyclase activity is influenced by pH changes driven by NHE1 activity, both of which localize to lipid rafts and caveolae (Willoughby et al. 2005). An AE1-generated H+ microdomain would also affect the function of nearby proteins. For example, gating of the K+ channel Kir1.1 is sensitive to pH changes as small as 0.2 pH units (Schulte & Fakler, 2000). In addition, phosphofructokinase exhibits striking changes in activity over a few tenths of a pH unit (Trivedi & Danforth, 1966), and binds the N-terminus of AE1, along with other glycolytic enzymes (Campanella et al. 2005), suggesting that the enzymes may localize to the AE1 surface in order to be subject to pH regulation by AE1's H+ microdomain. Further, kAE1 activity has been suggested to establish H+ microdomains in glomerular podocytes to modulate nearby pH-sensitive TRPC (transient receptor potential superfamily of non-selective cation channels) (Wu et al. 2010). Broader effects of plasma membrane pH are suggested by observations that cationic peptides, such as K-Ras, associate with negative charges on plasma membrane phosphoinositides and phosphatidylserine (Yeung et al. 2008). The slow rates of H+ diffusion that we observed along the plasma membrane surface suggest that pH-regulatory transporters may have especially strong pH-modulatory effects on the plasma membrane environment. Acid accumulated in the H+ microdomain around a transporter could affect the ability of cationic signalling peptides to associate with the plasma membrane, thus influencing the signalling cascades in the vicinity of the transporter.
Using pH-sensitive fluorescent fusion proteins we measured a H+ microdomain around AE1 of 0.3 μm in diameter generated by its Cl−/HCO3− exchange activity. H+ microdomain formation was dependent on carbonic anhydrase activity. We also found that the rate of H+ diffusion along the plasma membrane is 60-fold slower than from the plasma membrane to the ER surface. This is the first evidence for a H+ microdomain detected at this scale driven by physiological ion transport activity. H+ microdomains may be a widespread phenomenon with extensive physiological implications.
Acknowledgments
We thank Drs Mike Jennings, Marek Michalak and Jim Remington for providing reagents. We also thank Drs Nicolas Touret, Todd Alexander, Gonzalo Vilas, and Pamela Bonar for comments on the manuscript. D.E.J. and J.R.C. are supported, respectively, by studentship and Scientist awards from the Alberta Heritage Foundation for Medical Research. This work was supported by a Canadian Institutes of Health Research operating grant.
Glossary
Abbreviations
- AE
Cl−/HCO3− anion exchanger
- CA
carbonic anhydrase
- CAII
CA isoform II
- CNX
calnexin
- CNX.mNect
mNectarine fused to CNX
- ER
endoplasmic reticulum
- GAPDH
glyceraldehyde 3-phosphate dehydrogenase
- GFP
dual emission green fluorescent protein 4
- GFP.AE1
GFP fused to AE1
- FP
fluorescent protein
- hCNT3
human concentrative nucleoside transporter 3
- mNect
monomeric Nectarine
- mNect.AE1
mNect fused to AE1
- mNect.hCNT3
mNectarine fused to hCNT3
- NHE
Na+/H+ exchanger
- pHi
intracellular pH
- PM
plasma membrane
- RFP
red fluorescent protein
- ROI
region of interest
Author contributions
Experiments were performed in the laboratory of J.R.C. J.R.C. conceived the research. J.R.C. and D.E.J. designed, analysed and interpreted data, and prepared the manuscript. D.E.J. collected the data. J.R.C. and D.E.J. both approved the final version of the manuscript.
Supplementary material
Suppl. Fig. 1
Suppl. Fig. 2
Suppl. Fig. 3
Suppl. Fig. 4
Suppl. Fig. 5
Suppl. Fig. 6
Suppl. Fig. 7
Suppl. Fig. 8
Suppl. Fig. 9
Suppl. Fig. 10
As a service to our authors and readers, this journal provides supporting information supplied by the authors. Such materials are peer-reviewed and may be re-organized for online delivery, but are not copy-edited or typeset. Technical support issues arising from supporting information (other than missing files) should be addressed to the authors
References
- Alper SL, Chernova MN, Stewart AK. Regulation of Na+-independent Cl−/HCO3− exchangers by pH. JOP. 2001;2:171–175. [PubMed] [Google Scholar]
- Alvarez BV, Kieller DM, Quon AL, Robertson M, Casey JR. Cardiac hypertrophy in anion exchanger 1-null mutant mice with severe hemolytic anemia. Am J Physiol Heart Circ Physiol. 2007;292:H1301–H1312. doi: 10.1152/ajpheart.00449.2006. [DOI] [PubMed] [Google Scholar]
- Barros LF, Martinez C. An enquiry into metabolite domains. Biophys J. 2007;92:3878–3884. doi: 10.1529/biophysj.106.100925. [DOI] [PMC free article] [PubMed] [Google Scholar]
- Becker HM, Deitmer JW. Nonenzymatic proton handling by carbonic anhydrase II during H+-lactate cotransport via monocarboxylate transporter 1. J Biol Chem. 2008;283:21655–21667. doi: 10.1074/jbc.M802134200. [DOI] [PubMed] [Google Scholar]
- Bola B, Allan V. How and why does the endoplasmic reticulum move? Biochem Soc Trans. 2009;37:961–965. doi: 10.1042/BST0370961. [DOI] [PubMed] [Google Scholar]
- Bonar P, Casey JR. Purification of functional human Cl−/HCO3− exchanger, AE1, over-expressed in Saccharomyces cerevisiae. Protein Expr Purif. 2010;74:106–115. doi: 10.1016/j.pep.2010.06.020. [DOI] [PubMed] [Google Scholar]
- Bruce LJ, Beckmann R, Ribeiro ML, Peters LL, Chasis JA, Delaunay J, Mohandas N, Anstee DJ, Tanner MJ. A band 3-based macrocomplex of integral and peripheral proteins in the RBC membrane. Blood. 2003;101:4180–4188. doi: 10.1182/blood-2002-09-2824. [DOI] [PubMed] [Google Scholar]
- Campanella ME, Chu H, Low PS. Assembly and regulation of a glycolytic enzyme complex on the human erythrocyte membrane. Proc Natl Acad Sci U S A. 2005;102:2402–2407. doi: 10.1073/pnas.0409741102. [DOI] [PMC free article] [PubMed] [Google Scholar]
- Casey JR, Ding Y, Kopito RR. The role of cysteine residues in the erythrocyte plasma membrane anion exchange protein, AE1. J Biol Chem. 1995;270:8521–8527. doi: 10.1074/jbc.270.15.8521. [DOI] [PubMed] [Google Scholar]
- Casey JR, Grinstein S, Orlowski J. Sensors and regulators of intracellular pH. Nat Rev Mol Cell Biol. 2010;11:50–61. doi: 10.1038/nrm2820. [DOI] [PubMed] [Google Scholar]
- Casey JR, Reithmeier RA. Analysis of the oligomeric state of Band 3, the anion transport protein of the human erythrocyte membrane, by size exclusion high performance liquid chromatography. Oligomeric stability and origin of heterogeneity. J Biol Chem. 1991;266:15726–15737. [PubMed] [Google Scholar]
- Cavet ME, Akhter S, de Medina FS, Donowitz M, Tse CM. Na+/H+ exchangers (NHE1–3) have similar turnover numbers but different percentages on the cell surface. Am J Physiol Cell Physiol. 1999;277:C1111–C1121. doi: 10.1152/ajpcell.1999.277.6.C1111. [DOI] [PubMed] [Google Scholar]
- Chernova MN, Humphreys BD, Robinson DH, Stuart-Tilley AK, Garcia AM, Brosius FC, Alper SL. Functional consequences of mutations in the transmembrane domain and the carboxy-terminus of the murine AE1 anion exchanger. Biochim Biophys Acta. 1997;1329:111–123. doi: 10.1016/s0005-2736(97)00090-4. [DOI] [PubMed] [Google Scholar]
- Cordat E, Casey JR. Bicarbonate transport in cell physiology and disease. Biochem J. 2009;417:423–439. doi: 10.1042/BJ20081634. [DOI] [PubMed] [Google Scholar]
- Dixon SJ, Cohen S, Cragoe EJ, Jr, Grinstein S. Estimation of the number and turnover rate of Na+/H+ exchangers in lymphocytes. Effect of phorbol ester and osmotic shrinking. J Biol Chem. 1987;262:3626–3632. [PubMed] [Google Scholar]
- Fairbanks G, Steck TL, Wallach DFH. Electrophoretic analysis of the major polypeptides of the human erythrocyte membrane. Biochemistry. 1971;10:2606–2617. doi: 10.1021/bi00789a030. [DOI] [PubMed] [Google Scholar]
- Gentet LJ, Stuart GJ, Clements JD. Direct measurement of specific membrane capacitance in neurons. Biophys J. 2000;79:314–320. doi: 10.1016/S0006-3495(00)76293-X. [DOI] [PMC free article] [PubMed] [Google Scholar]
- Graham FL, Smiley J, Russell WC, Nairn R. Characteristics of a human cell line transformed by DNA from human adenovirus type 5. J Gen Virol. 1977;36:59–74. doi: 10.1099/0022-1317-36-1-59. [DOI] [PubMed] [Google Scholar]
- Grinstein S, Ship S, Rothstein A. Anion transport in relation to proteolytic dissection of band 3 protein. Biochim Biophys Acta. 1978;507:294–304. doi: 10.1016/0005-2736(78)90424-8. [DOI] [PubMed] [Google Scholar]
- Halestrap AP, Meredith D. The SLC16 gene family–from monocarboxylate transporters (MCTs) to aromatic amino acid transporters and beyond. Pflugers Arch. 2004;447:619–628. doi: 10.1007/s00424-003-1067-2. [DOI] [PubMed] [Google Scholar]
- Hanson GT, McAnaney TB, Park ES, Rendell ME, Yarbrough DK, Chu S, Xi L, Boxer SG, Montrose MH, Remington SJ. Green fluorescent protein variants as ratiometric dual emission pH sensors. 1. Structural characterization and preliminary application. Biochemistry. 2002;41:15477–15488. doi: 10.1021/bi026609p. [DOI] [PubMed] [Google Scholar]
- Jay AW. Geometry of the human erythrocyte. I. Effect of albumin on cell geometry. Biophys J. 1975;15:205–222. doi: 10.1016/S0006-3495(75)85812-7. [DOI] [PMC free article] [PubMed] [Google Scholar]
- Jennings ML, Anderson MP, Monaghan R. Monoclonal antibodies against human erythrocyte band 3 protein. Localization of proteolytic cleavage sites and stilbenedisulfonate-binding lysine residues. J Biol Chem. 1986;261:9002–9010. [PubMed] [Google Scholar]
- Jensen FB. Red blood cell pH, the Bohr effect, and other oxygenation-linked phenomena in blood O2 and CO2 transport. Acta Physiol Scand. 2004;182:215–227. doi: 10.1111/j.1365-201X.2004.01361.x. [DOI] [PubMed] [Google Scholar]
- Johnson DE, Ai HW, Wong P, Young JD, Campbell RE, Casey JR. Red fluorescent protein pH biosensor to detect concentrative nucleoside transport. J Biol Chem. 2009;284:20499–20511. doi: 10.1074/jbc.M109.019042. [DOI] [PMC free article] [PubMed] [Google Scholar]
- Johnson DE, Casey JR. Bicarbonate transport metabolons. In: Supuran CT, Winum J-Y, editors. Drug Design of Zinc-Enzyme Inhibitors: Functional, Structural and Disease Applications. Wiley; 2009. pp. 415–437. [Google Scholar]
- Kayar SR, Hoppeler H, Armstrong RB, Laughlin MH, Lindstedt SL, Jones JH, Conley KR, Taylor CR. Estimating transit time for capillary blood in selected muscles of exercising animals. Pflugers Arch. 1992;421:578–584. doi: 10.1007/BF00375054. [DOI] [PubMed] [Google Scholar]
- Keskanokwong T, Shandro HJ, Johnson DE, Kittanakom S, Vilas GL, Thorner P, Reithmeier RA, Akkarapatumwong V, Yenchitsomanus PT, Casey JR. Interaction of integrin-linked kinase with the kidney chloride/bicarbonate exchanger, kAE1. J Biol Chem. 2007;282:23205–23218. doi: 10.1074/jbc.M702139200. [DOI] [PubMed] [Google Scholar]
- Klein M, Seeger P, Schuricht B, Alper SL, Schwab A. Polarization of Na+/H+ and Cl−/HCO3− exchangers in migrating renal epithelial cells. J Gen Physiol. 2000;115:599–608. doi: 10.1085/jgp.115.5.599. [DOI] [PMC free article] [PubMed] [Google Scholar]
- Laude AJ, Simpson AW. Compartmentalized signalling: Ca2+ compartments, microdomains and the many facets of Ca2+ signalling. FEBS J. 2009;276:1800–1816. doi: 10.1111/j.1742-4658.2009.06927.x. [DOI] [PubMed] [Google Scholar]
- Loiselle FB, Casey JR. Measurement of intracellular pH. Methods Mol Biol. 2010;637:311–331. doi: 10.1007/978-1-60761-700-6_17. [DOI] [PubMed] [Google Scholar]
- Low PS. Structure and function of the cytoplasmic domain of band 3: center of erythrocyte membrane–peripheral protein interactions. Biochim Biophys Acta. 1986;864:145–167. doi: 10.1016/0304-4157(86)90009-2. [DOI] [PubMed] [Google Scholar]
- Mackenzie B, Loo DD, Fei Y, Liu WJ, Ganapathy V, Leibach FH, Wright EM. Mechanisms of the human intestinal H+-coupled oligopeptide transporter hPEPT1. J Biol Chem. 1996;271:5430–5437. doi: 10.1074/jbc.271.10.5430. [DOI] [PubMed] [Google Scholar]
- Malo ME, Fliegel L. Physiological role and regulation of the Na+/H+ exchanger. Can J Physiol Pharmacol. 2006;84:1081–1095. doi: 10.1139/y06-065. [DOI] [PubMed] [Google Scholar]
- Martinez-Zaguilan R, Raghunand N, Lynch RM, Bellamy W, Martinez GM, Rojas B, Smith D, Dalton WS, Gillies RJ. pH and drug resistance. I. Functional expression of plasmalemmal V-type H+-ATPase in drug-resistant human breast carcinoma cell lines. Biochem Pharmacol. 1999;57:1037–1046. doi: 10.1016/s0006-2952(99)00022-2. [DOI] [PubMed] [Google Scholar]
- Michalak M, Groenendyk J, Szabo E, Gold LI, Opas M. Calreticulin, a multi-process calcium-buffering chaperone of the endoplasmic reticulum. Biochem J. 2009;417:651–666. doi: 10.1042/BJ20081847. [DOI] [PubMed] [Google Scholar]
- Miesenböck G, De Angelis DA, Rothman JE. Visualizing secretion and synaptic transmission with pH-sensitive green fluorescent proteins. Nature. 1998;394:192–195. doi: 10.1038/28190. [DOI] [PubMed] [Google Scholar]
- Moncoq K, Kemp G, Li X, Fliegel L, Young HS. Dimeric structure of human Na+/H+ exchanger isoform 1 overproduced in Saccharomyces cerevisiae. J Biol Chem. 2008;283:4145–4154. doi: 10.1074/jbc.M704844200. [DOI] [PubMed] [Google Scholar]
- Neves SR, Iyengar R. Models of spatially restricted biochemical reaction systems. J Biol Chem. 2009;284:5445–5449. doi: 10.1074/jbc.R800058200. [DOI] [PMC free article] [PubMed] [Google Scholar]
- Orchard C, Brette F. t-Tubules and sarcoplasmic reticulum function in cardiac ventricular myocytes. Cardiovasc Res. 2008;77:237–244. doi: 10.1093/cvr/cvm002. [DOI] [PubMed] [Google Scholar]
- Ovens MJ, Davies AJ, Wilson MC, Murray CM, Halestrap AP. AR-C155858 is a potent inhibitor of monocarboxylate transporters MCT1 and MCT2 that binds to an intracellular site involving transmembrane helices 7–10. Biochem J. 2010;425:523–530. doi: 10.1042/BJ20091515. [DOI] [PMC free article] [PubMed] [Google Scholar]
- Pani B, Singh BB. Lipid rafts/caveolae as microdomains of calcium signaling. Cell Calcium. 2009;45:625–633. doi: 10.1016/j.ceca.2009.02.009. [DOI] [PMC free article] [PubMed] [Google Scholar]
- Rajagopalan S, Xu Y, Brenner MB. Retention of unassembled components of integral membrane proteins by calnexin. Science. 1994;263:387–390. doi: 10.1126/science.8278814. [DOI] [PubMed] [Google Scholar]
- Reithmeier RA. A membrane metabolon linking carbonic anhydrase with chloride/bicarbonate anion exchangers. Blood Cells Mol Dis. 2001;27:85–89. doi: 10.1006/bcmd.2000.0353. [DOI] [PubMed] [Google Scholar]
- Ro HA, Carson JH. pH microdomains in oligodendrocytes. J Biol Chem. 2004;279:37115–37123. doi: 10.1074/jbc.M403099200. [DOI] [PubMed] [Google Scholar]
- Rojas JD, Sennoune SR, Maiti D, Bakunts K, Reuveni M, Sanka SC, Martinez GM, Seftor EA, Meininger CJ, Wu G, Wesson DE, Hendrix MJ, Martinez-Zaguilan R. Vacuolar-type H+-ATPases at the plasma membrane regulate pH and cell migration in microvascular endothelial cells. Am J Physiol Heart Circ Physiol. 2006;291:H1147–H1157. doi: 10.1152/ajpheart.00166.2006. [DOI] [PubMed] [Google Scholar]
- Ruetz S, Lindsey AE, Ward CL, Kopito RR. Functional activation of plasma membrane anion exchangers occurs in a pre-Golgi compartment. J Cell Biol. 1993;121:37–48. doi: 10.1083/jcb.121.1.37. [DOI] [PMC free article] [PubMed] [Google Scholar]
- Schulte U, Fakler B. Gating of inward-rectifier K+ channels by intracellular pH. Eur J Biochem. 2000;267:5837–5841. doi: 10.1046/j.1432-1327.2000.01671.x. [DOI] [PubMed] [Google Scholar]
- Sommerhage F, Helpenstein R, Rauf A, Wrobel G, Offenhausser A, Ingebrandt S. Membrane allocation profiling: a method to characterize three-dimensional cell shape and attachment based on surface reconstruction. Biomaterials. 2008;29:3927–3935. doi: 10.1016/j.biomaterials.2008.06.020. [DOI] [PubMed] [Google Scholar]
- Spitzer KW, Ershler PR, Skolnick RL, Vaughan-Jones RD. Generation of intracellular pH gradients in single cardiac myocytes with a microperfusion system. Am J Physiol Heart Circ Physiol. 2000;278:H1371–1382. doi: 10.1152/ajpheart.2000.278.4.H1371. [DOI] [PubMed] [Google Scholar]
- Spitzer KW, Skolnick RL, Peercy BE, Keener JP, Vaughan-Jones RD. Facilitation of intracellular H+ ion mobility by CO2/HCO3− in rabbit ventricular myocytes is regulated by carbonic anhydrase. J Physiol. 2002;541:159–167. doi: 10.1113/jphysiol.2001.013268. [DOI] [PMC free article] [PubMed] [Google Scholar]
- Sterling D, Casey JR. Transport activity of AE3 chloride/bicarbonate anion-exchange proteins and their regulation by intracellular pH. Biochem J. 1999;344:221–229. [PMC free article] [PubMed] [Google Scholar]
- Sterling D, Casey JR. Bicarbonate transport proteins. Biochem Cell Biol. 2002;80:483–497. doi: 10.1139/o02-152. [DOI] [PubMed] [Google Scholar]
- Sterling D, Reithmeier RA, Casey JR. A transport metabolon. Functional interaction of carbonic anhydrase II and chloride/bicarbonate exchangers. J Biol Chem. 2001;276:47886–47894. doi: 10.1074/jbc.M105959200. [DOI] [PubMed] [Google Scholar]
- Stewart AK, Boyd CA, Vaughan-Jones RD. A novel role for carbonic anhydrase: cytoplasmic pH gradient dissipation in mouse small intestinal enterocytes. J Physiol. 1999;516:209–217. doi: 10.1111/j.1469-7793.1999.209aa.x. [DOI] [PMC free article] [PubMed] [Google Scholar]
- Stuwe L, Muller M, Fabian A, Waning J, Mally S, Noel J, Schwab A, Stock C. pH dependence of melanoma cell migration: protons extruded by NHE1 dominate protons of the bulk solution. J Physiol. 2007;585:351–360. doi: 10.1113/jphysiol.2007.145185. [DOI] [PMC free article] [PubMed] [Google Scholar]
- Sugimori M, Lang EJ, Silver RB, Llinas R. High-resolution measurement of the time course of calcium-concentration microdomains at squid presynaptic terminals. Biol Bull. 1994;187:300–303. doi: 10.2307/1542286. [DOI] [PubMed] [Google Scholar]
- Swietach P, Leem CH, Spitzer KW, Vaughan-Jones RD. Experimental generation and computational modeling of intracellular pH gradients in cardiac myocytes. Biophys J. 2005;88:3018–3037. doi: 10.1529/biophysj.104.051391. [DOI] [PMC free article] [PubMed] [Google Scholar]
- Swietach P, Spitzer KW, Vaughan-Jones RD. pH-dependence of extrinsic and intrinsic H+-ion mobility in the rat ventricular myocyte, investigated using flash photolysis of a caged-H+ compound. Biophys J. 2007;92:641–653. doi: 10.1529/biophysj.106.096560. [DOI] [PMC free article] [PubMed] [Google Scholar]
- Swietach P, Tiffert T, Mauritz JM, Seear R, Esposito A, Kaminski C, Lew VL, Vaughan-Jones RD. Hydrogen ion dynamics in human red blood cells. J Physiol. 2010;588:4995–5014. doi: 10.1113/jphysiol.2010.197392. [DOI] [PMC free article] [PubMed] [Google Scholar]
- Swietach P, Wigfield S, Cobden P, Supuran CT, Harris AL, Vaughan-Jones RD. Tumor-associated carbonic anhydrase 9 spatially coordinates intracellular pH in three-dimensional multicellular growths. J Biol Chem. 2008;283:20473–20483. doi: 10.1074/jbc.M801330200. [DOI] [PubMed] [Google Scholar]
- Tang XB, Fujinaga J, Kopito R, Casey JR. Topology of the region surrounding Glu681 of human AE1 protein, the erythrocyte anion exchanger. J Biol Chem. 1998;273:22545–22553. doi: 10.1074/jbc.273.35.22545. [DOI] [PubMed] [Google Scholar]
- Thomas JA, Buchsbaum RN, Zimniak A, Racker E. Intracellular pH measurements in Ehrlich ascites tumor cells utilizing spectroscopic probes generated in situ. Biochemistry. 1979;18:2210–2218. doi: 10.1021/bi00578a012. [DOI] [PubMed] [Google Scholar]
- Tian J, Xie ZJ. The Na-K-ATPase and calcium-signaling microdomains. Physiology (Bethesda) 2008;23:205–211. doi: 10.1152/physiol.00008.2008. [DOI] [PMC free article] [PubMed] [Google Scholar]
- Trivedi B, Danforth WH. Effect of pH on the kinetics of frog muscle phosphofructokinase. J Biol Chem. 1966;241:4110–4112. [PubMed] [Google Scholar]
- Vaughan-Jones RD, Peercy BE, Keener JP, Spitzer KW. Intrinsic H+ ion mobility in the rabbit ventricular myocyte. J Physiol. 2002;541:139–158. doi: 10.1113/jphysiol.2001.013267. [DOI] [PMC free article] [PubMed] [Google Scholar]
- Vaughan-Jones RD, Spitzer KW, Swietach P. Spatial aspects of intracellular pH regulation in heart muscle. Prog Biophys Mol Biol. 2006;90:207–224. doi: 10.1016/j.pbiomolbio.2005.06.004. [DOI] [PubMed] [Google Scholar]
- Vince JW, Carlsson U, Reithmeier RA. Localization of the Cl−/HCO3− anion exchanger binding site to the amino-terminal region of carbonic anhydrase II. Biochemistry. 2000;39:13344–13349. doi: 10.1021/bi0015111. [DOI] [PubMed] [Google Scholar]
- Wachter RM, Remington SJ. Sensitivity of the yellow variant of green fluorescent protein to halides and nitrate. Curr Biol. 1999;9:R628–629. doi: 10.1016/s0960-9822(99)80408-4. [DOI] [PubMed] [Google Scholar]
- Wang DN, Kuhlbrandt W, Sarabia V, Reithmeier RAF. Two-dimensional structure of the membrane domain of human band 3, the anion transport protein of the erythrocyte membrane. EMBO J. 1993;12:2233–2239. doi: 10.1002/j.1460-2075.1993.tb05876.x. [DOI] [PMC free article] [PubMed] [Google Scholar]
- Willoughby D, Masada N, Crossthwaite AJ, Ciruela A, Cooper DM. Localized Na+/H+ exchanger 1 expression protects Ca2+-regulated adenylyl cyclases from changes in intracellular pH. J Biol Chem. 2005;280:30864–30872. doi: 10.1074/jbc.M414355200. [DOI] [PubMed] [Google Scholar]
- Wu F, Saleem MA, Kampik NB, Satchwell TJ, Williamson RC, Blattner SM, Ni L, Toth T, White G, Young MT, Parker MD, Alper SL, Wagner CA, Toye AM. Anion exchanger 1 interacts with nephrin in podocytes. J Am Soc Nephrol. 2010;21:1456–1467. doi: 10.1681/ASN.2009090921. [DOI] [PMC free article] [PubMed] [Google Scholar]
- Yeung T, Gilbert GE, Shi J, Silvius J, Kapus A, Grinstein S. Membrane phosphatidylserine regulates surface charge and protein localization. Science. 2008;319:210–213. doi: 10.1126/science.1152066. [DOI] [PubMed] [Google Scholar]
- Zaccolo M, Pozzan T. Discrete microdomains with high concentration of cAMP in stimulated rat neonatal cardiac myocytes. Science. 2002;295:1711–1715. doi: 10.1126/science.1069982. [DOI] [PubMed] [Google Scholar]
Associated Data
This section collects any data citations, data availability statements, or supplementary materials included in this article.