Non-technical summary
Though the pancreatic hormone insulin is known to act in the brain to increase sympathetic nerve activity and baroreflex control of sympathetic nerve activity, its specific site of action had yet to be identified. We show that a region in the hypothalamus, the arcuate nucleus, is the site at which insulin's effects are initiated. This new information may lead to a greater understanding of the role of insulin in the brain in adverse cardiovascular complications, like hypertension and heart attacks, which are associated with insulin-resistant states, such as obesity and diabetes.
Abstract
Abstract
Although the central effects of insulin to activate the sympathetic nervous system and enhance baroreflex gain are well known, the specific brain site(s) at which insulin acts has not been identified. We tested the hypotheses that (1) the paraventricular nucleus of the hypothalamus (PVN) and the arcuate nucleus (ArcN) are necessary brain sites and (2) insulin initiates its effects directly in the PVN and/or the ArcN. In α-chloralose anaesthetised female Sprague–Dawley rats, mean arterial pressure (MAP), heart rate (HR) and lumbar sympathetic nerve activity (LSNA) were recorded continuously, and baroreflex gain of HR and LSNA were measured before and during a hyperinsulinaemic–euglycaemic clamp. After 60 min, intravenous infusion of insulin (15 mU kg−1 min−1), but not saline, significantly increased (P < 0.05) basal LSNA (to 228 ± 28% control) and gain of baroreflex control of LSNA (from 3.8 ± 1.1 to 7.4 ± 2.4% control mmHg−1). These effects were reversed (P < 0.05) by local inhibition (bilateral microinjection of musimol) of the PVN (LSNA to 124 ± 8.8% control; LSNA gain to 3.9 ± 1.7% control mmHg−1) or of the ArcN (LSNA in % control: from 100 ± 0 to 198 ± 24 (insulin), then 133 ± 23 (muscimol) LSNA gain in % control mmHg−1: from 3.9 ± 0.3 to 8.9 ± 0.9 (insulin), then 5.1 ± 0.5 (muscimol)). While insulin receptor immunoreactivity was identified in neurons in pre-autonomic PVN subnuclei, microinjection of insulin (0.6, 6 and 60 nU) into the PVN failed to alter LSNA or LSNA gain. However, ArcN insulin increased (P < 0.05) basal LSNA (in % control to 162 ± 19, 0.6 nU; 193 ± 19, 6 nU; and 205 ± 28, 60 nU) and LSNA baroreflex gain (in % control mmHg−1 from 4.3 ± 1.2 to 6.9 ± 1.0, 0.6 nU; 7.7 ± 1.2, 6 nU; and 7.8 ± 1.3, 60 nU). None of the treatments altered MAP, HR, or baroreflex control of HR. Our findings identify the ArcN as the site at which insulin acts to activate the sympathetic nervous system and increase baroreflex gain, via a neural pathway that includes the PVN.
Introduction
The central effect of insulin to activate the sympathetic nervous system is now well established. Systemic euglycaemic hyperinsulinaemia induces sympathoexcitation and increases gain of baroreflex control of sympathetic nerve activity (SNA) (Rowe et al. 1981; Anderson et al. 1991; Young et al. 2010). Moreover, intracerebroventricular (i.c.v.) infusion of insulin in rats acutely increases SNA to several organs (Morgan et al. 1993; Muntzel et al. 1994; Rahmouni et al. 2004) and increases baroreflex control of both heart rate (HR) and lumbar SNA (LSNA) (Okada & Bunag, 1994; Pricher et al. 2008). Recent studies indicate that pregnancy reduces brain insulin levels and baroreflex gain, and i.c.v. insulin infusion normalises baroreflex function, implicating a key role for reduced brain insulin in the pregnancy-induced baroreflex impairment (Daubert et al. 2007; Brooks et al. 2010b; Azar & Brooks, 2011). However, despite the potential physiological and pathophysiological implications, the specific brain site at which insulin acts to stimulate the sympathetic nervous system and enhance baroreflex gain has not been identified.
Previous studies demonstrated that infusion of insulin via a lateral cerebral ventricle, but not the fourth ventricle, increases LSNA and its baroreflex regulation (Pricher et al. 2008), suggesting that insulin's actions are initiated at a hypothalamic rather than a brainstem site. Within the hypothalamus, considerable data implicate the paraventricular nucleus (PVN). Insulin receptors (InsRs) are highly expressed in the PVN (Werther et al. 1987; Unger et al. 1989; Marks et al. 1990). The PVN is a brain region clearly capable of influencing the autonomic nervous system via projections to the rostral ventrolateral medulla (RVLM), an identified link in the neurocircuitry by which insulin increases sympathetic activity (Bardgett et al. 2010). Increases in plasma insulin activate PVN pre-autonomic neurons, as indicated by increased expression of Fos (Carrasco et al. 2001). Moreover, in male rats, inactivation of PVN neurons reverses insulin's action to increase baroreflex gain (BRG) (Brooks et al. 2010a).
Additional data suggest that the excitatory effects of insulin in PVN may be mediated via local suppression of tonic γ-aminobutyric acid (GABA) inhibitory inputs. Insulin is an inhibitory neuromodulator (Spanswick et al. 2000; Williams et al. 2010); therefore, insulin would be expected to cause excitation through disinhibition of tonically excited neurons. Pre-autonomic PVN neurons receive substantial inhibitory GABAergic inputs (Decavel & van den Pol, 1990; Roland & Sawchenko, 1993) that are tonically active, and local pharmacological blockade of PVN GABAA receptors increases arterial pressure, HR and SNA and excites neurons that project to the brainstem or spinal cord (Li et al. 2002; Kenney et al. 2003; Li & Pan, 2005). Finally, previous in vitro electrophysiological studies have demonstrated that insulin increases the firing rate of PVN neurons by inhibition of GABAergic tone (Davidowa et al. 2006).
The arcuate nucleus (ArcN) is another brain nucleus that is replete with InsRs (Werther et al. 1987; Unger et al. 1989; Marks et al. 1990) and has been shown to regulate the autonomic nervous system. For example, stimulation of the ArcN increases HR and SNA (Nakamura et al. 2009). Moreover, the ArcN is central in autonomic adjustments that occur in the context of energy balance (Prodi & Obici, 2006; Rahmouni & Morgan, 2007).
Therefore, to begin to investigate the specific brain sites and mechanisms by which insulin acts to increase SNA and enhance baroreflex function, we tested the following hypotheses: (1) the PVN and/or the ArcN is a necessary brain site within the sympathetic neural pathway through which insulin acts to induce sympathoexcitation and increase baroreflex function; (2) insulin excites PVN neurons by presynaptic inhibition of GABAergic terminals; and (3) insulin acts directly in the PVN and/or ArcN to enhance SNA and baroreflex function. To test the first hypothesis, basal levels and baroreflex gain of HR and LSNA were measured in α-chloralose-anaesthetised female rats during intravenous infusion of insulin and then following local blockade of the PVN or ArcN via microinjection of the GABAA agonist muscimol. Immunocytochemistry was employed to test the second hypothesis by determining if InsRs are localised within caudal PVN sites that house the majority of pre-autonomic neuronal cell bodies and if the InsR co-localises with glutamic acid decarboxylase (GAD), a marker of GABAergic neurons. Finally, basal levels and baroreflex gain of HR and LSNA were measured before and after microinjection of insulin directly into the PVN or ArcN.
Methods
Animals
In view of prior studies implicating brain insulin in the impaired baroreflex function during pregnancy (Daubert et al. 2007; Brooks et al. 2010b; Azar & Brooks, 2011), all experiments were performed using female virgin Sprague–Dawley rats (250–280 g; Charles River). The rats were housed in a room with a 12 h:12 h light–dark cycle and had free access to food (LabDiet 5001, Richmond, IN, USA) and water. All procedures were conducted in accordance with the NIH Guide for the Care and Use of Laboratory Animals and approved by the Institutional (Oregon Health & Science University) Animal Care and Use Committee.
PVN and ArcN microinjections
Surgery
Anaesthesia was induced with 5% isoflurane (Novaplus) in 100% oxygen and was maintained with 1.5–2% isoflurane in 100% oxygen. Throughout the surgery and experimental protocol, body temperature was maintained at 37 ± 1°C using a rectal thermistor, heat lamp, and heating pad. A tracheal tube was placed for artificial ventilation and femoral arterial (1) and venous (3–5) catheters were implanted for the measurement of mean arterial pressure (MAP) and drug infusions, respectively. An additional catheter was inserted into the tail artery for blood glucose measurements. As published previously (Pricher et al. 2008), after a midline abdominal incision, the lumbar nerve was located and a bipolar stainless steel electrode was positioned and secured around it using lightweight silicone material (Kwik-Sil, WPI, Inc., Sarasota, FL, USA). Rats were then placed in a stereotaxic apparatus (David Kopf Instuments, Tujunga, CA, USA), and a midline incision was made on the top of the skull to prepare for PVN or ArcN microinjections. An opening was burred through the skull on the midline caudal to bregma. After completion of surgery a loading dose of α-chloralose (50 mg kg−1; Sigma) was administered intravenously over 30 min while isoflurane was slowly withdrawn, and this was followed by a continuous infusion of α-chloralose (25 mg kg−1 h−1) for the duration of the experiment. Throughout the experiment, artificial ventilation with 100% oxygen was maintained, and respiratory rate and tidal volume were adjusted to maintain expired CO2 at 30–40 mmHg. Anaesthetic depth was regularly confirmed by the lack of a pressor or withdrawal response to a foot or tail pinch. After completion of surgery and the α-chloralose loading dose, rats were allowed to stabilise for at least 60 min before experimentation.
Data acquisition
Pulsatile and mean arterial pressures (MAP) were continuously recorded on a Grass polygraph by connecting the arterial catheter to a Grass bridge amplifier. The pulsatile signal was directed to a Grass tachograph amplifier for determination of HR. Arterial pressure, HR and LSNA were collected using a Biopac MP100 data acquisition and analysis system sampling at 2000 Hz. LSNA was band-pass filtered (100–3000 Hz), amplified (×10,000), rectified and integrated in 1 s bins. MAP and HR data were also grouped into 1 s bins from which mean values were obtained. Post-mortem LSNA was quantified at the end of the experiment, and this background level was subtracted from values of LSNA recorded during the experiment. LSNA was normalised to control LSNA before the experimental infusions were initiated (% of control).
Baroreflex function
To measure baroreflex gain (BRG), MAP was first decreased to ∼50 mmHg by intravenous infusion of nitroprusside (1 mg ml−1; 20 μl min−1), then slowly raised to ∼175 mmHg over 3–5 min by both withdrawing nitroprusside infusion and infusing phenylephrine at increasing rates (1 mg ml−1; 1–35 μl min−1). Curves were constructed from data obtained during the MAP rise from 50 to 175 mmHg. The sigmoidal baroreflex relationships between MAP and HR or LSNA generated in each baroreflex test were fitted and compared using the Boltzmann equation: HR or LSNA = (P1 − P2)/[1 + exp(MAP − P3)/P4]+ P2. P1 is the maximum HR or LSNA, P2 is the minimum HR or LSNA, P3 is the MAP associated with the HR or LSNA value midway between the maximal and minimal HR or LSNA (BP50; denotes position of the curve on the x-axis), and P4 is the width, the coefficient used to calculate maximum gain, – (P1 − P2)/(P4 × 4), which is an index of the maximum slope of the most linear part of the sigmoidal baroreflex curve.
PVN and ArcN microinjection procedures
With a flat skull and using Bregma and the dorsal surface of the dura as zero, single-barrelled glass micropipettes (20–50 μm tip OD) were positioned using the following coordinates: 1.8–1.9 mm caudal, 0.5 mm lateral and 7.2–7.4 mm ventral for PVN, and 3.5–3.7 mm caudal, 0.2 mm lateral and 9.8–9.9 mm ventral for ArcN. Drugs for microinjection were dissolved in artificial cerebrospinal fluid (aCSF) containing (in mm): 128 NaCl, 2.6 KCl, 1.3 CaCl2, 0.9 MgCl2, 20 NaHCO3, 1.3 Na2HPO4 and 2 dextrose, pH 7.4. During experimental protocols, all microinjections (60 nl) were made bilaterally and each injection was conducted over approximately 5–10 s using a PicoPump (WPI). Prior to the beginning of the experiment, the PVN and ArcN were functionally identified by observing an increase in MAP, HR and LSNA following unilateral microinjection of 1 mm bicuculline (for PVN) or 1 mm NMDA (for ArcN).
At the conclusion of the experiment, ∼60 nl of 2.5% Alcian Blue in 0.5 m sodium acetate was injected into the PVN or ArcN using the same pipette and coordinates as for microinjections. The brain was removed and placed in 4% paraformaldehyde in phosphate-buffered saline for at least 48 h. The hypothalamus was subsequently cut into 25 μm sections using a cryostat and mounted on gelatin-coated glass microscope slides. Correct placement into PVN was confirmed by dye centred just dorsally, ventrally or within the PVN and just dorsally or within the ArcN (without breaching the ventral brain surface).
Experimental protocols
Baseline measurements of MAP, HR and LSNA were taken as the average of data collected 30 s prior to each determination of BRG.
Role of the PVN and ArcN in the sympathoexcitatory response to insulin
Two control assessments of BRG were determined, 30 min apart, to confirm experimental stability. In most cases, results were within 10% and the second curve was used for data analysis. To determine if i.v. insulin infusion increases BRG in rats and to establish the stability of the preparation, the effects of i.v. insulin on basal MAP, HR and LSNA and on BRG of HR and LSNA were then studied during a hyperinsulinaemic-euglycaemic clamp (n = 6). Briefly, after the insulin infusion (15 mU kg−1 min−1 in 0.9% saline at 0.25 ml h−1; Novolin R) commenced, blood glucose levels were measured every 2 min. When blood glucose levels were observed to fall (by ∼10 mg dl−1), an infusion of 50% dextrose was initiated and the rate adjusted (0.25–0.5 ml h−1) to maintain euglycaemia. Once euglycaemia was achieved (∼10–15 min after the start of the insulin infusion), the insulin and glucose infusions were maintained for 120 min and blood glucose levels again were measured at 30 min intervals. In a control group of rats (n = 6), saline was infused i.v. (0.5 ml h−1), and BRG of HR and LSNA, as well as baseline parameters, were again measured every 30 min.
The role of the PVN was investigated by determining if local PVN inhibition reversed the actions of i.v. insulin. BRG of LSNA and HR were measured before and 60 min after i.v. insulin (n = 6) or saline (n = 6) infusion. Twenty minutes later, the PVN was inhibited with 1 mm muscimol (Tocris) and BRG was measured after 10 min. Similarly, the role of the ArcN in the responses to i.v. insulin was investigated by local inhibition of the ArcN during the hyperinsulinaemic-euglycaemic clamp (n = 4) or i.v. saline (n = 4).
Haemodynamic, LSNA and baroreflex responses to insulin microinjection into the PVN and ArcN
To determine the site of insulin's action to increase basal LSNA and BRG, insulin or the aCSF vehicle was microinjected into two hypothalamic sites, the PVN and the ArcN. We began with a range of insulin doses (6 μU, 60 μU and 600 μU, in varying order; n = 5, PVN; n = 8, ArcN) that had been commonly used previously (McKernan & Calaresu, 1996; Sakaguchi & Bray, 1988; Sakaguchi et al. 1988; Ruggeri et al. 2001; Bardgett et al. 2010). However, an estimation of the average insulin concentrations achieved, assuming a diffusion distance of ∼400 μm and distribution only in the extracellular fluid (20% of total volume) (Sykova & Nicholson, 2008), indicated that these doses are likely to be supraphysiological (above levels in plasma, which is the source of cerebral insulin; Schwartz et al. 1992). Therefore in a second series, more physiological insulin doses (0.6 nU, 6 nU and 60 nU; n = 4, PVN; n = 6, ArcN) were microinjected. Baseline levels and BRG of HR and LSNA were measured before and 10–15 min after microinjection of insulin or vehicle (aCSF); at least 45 min was allowed between microinjections. To ensure that the effects of ArcN insulin were restricted to this nucleus and not secondary to the insulin infusate moving up the cannula track to the nearby dorsomedial hypothalamus (DMH), in a separate series of experiments (n = 3), insulin (6–600 μU) was microinjected 1 mm dorsal to the ArcN.
Data analysis
All data are presented as means ± SEM. To determine differences in basal and BRG values (presented as absolute values) between and within insulin and saline i.v. treatment groups, and to determine the effects of PVN and ArcN inhibition, a two-way ANOVA for repeated measures and a post hoc Newman–Keuls test were used. To test for differences in basal and BRG values between baseline and insulin or aCSF microinjections in the PVN or ArcN, a one-way ANOVA for repeated measures with a post hoc Newman–Keuls test was used. P < 0.05 was considered statistically significant.
Immunocytochemistry
Perfusion and immunohistochemistry
Female rats (n = 7) were overdosed with sodium pentobarbital (150 mg kg−1i.p.) and perfused transcardially with the following series of solutions: (1) 10 ml heparinised saline; (2) 50 ml 3.8% acrolein in 2% paraformaldehyde; and (3) 200 ml 2% paraformaldehyde (in 0.1 m phosphate buffer (PB)). The brain was then removed, and a coronal block containing the hypothalamus was placed for 30 min in 2% paraformaldehyde. The hypothalamus was then sectioned (40 μm) on a vibrating microtome and collected into 0.1 m PB. Prior to immunocytochemical processing, free-floating sections were incubated in 1% NaBH4 (Sigma-Aldrich, St Louis, MO, USA) for 30 min (to bind remaining free aldehydes and reduce autofluorescence), and 0.5% bovine serum albumin (BSA, Sigma-Aldrich) in 0.1 m Tris-buffered saline (TS) for 30 min (to reduce non-specific binding). Tissue sections were incubated in a primary antibody cocktail made in 0.1% BSA (Sigma-Aldrich) and 0.25% Triton X-100 (Sigma-Aldrich) in 0.1 m TS containing a monoclonal mouse antibody directed against synaptophysin, a presynaptic marker (1:500; Sigma-Aldrich), a polyclonal goat GAD 65/67 antibody (1:100; Santa Cruz Biotechnology, Inc., Santa Cruz, CA, USA), and a polyclonal rabbit antibody directed against the InsR (1:1000, gift of Dr M. Myers) for 40 h at 4°C. Bound primary antibodies were visualised with donkey secondary antibodies conjugated to Alexa Fluors that allowed for the greatest spectral discrimination. Tissue sections were incubated in a secondary antibody cocktail made up in 0.1% BSA in 0.1 m TS for 2 h that contained donkey anti-goat conjugated to Alexa Fluor 488 (1:800; Invitrogen, Carlsbad, CA, USA), donkey anti-mouse conjugated to Alexa Fluor 546 (1:800; Invitrogen) and donkey anti-rabbit conjugated to Alexa Fluor 647 (1:800; Invitrogen). All incubations were conducted at room temperature on a shaker table unless otherwise noted, and tissue sections were rinsed with appropriate buffers, either 0.1 m PB or 0.1 m TS, between all incubations. Tissue sections were mounted onto gelatin-coated slides, coverslipped with ProLong Gold antifade reagent (Invitrogen) and stored at –20°C.
To allow more specific identification of the PVN regions that express the InsR, four additional rats were processed using the same the primary antibodies directed against the InsR, and GAD 65/67, but with the addition of NeuroTrace 500/525 (Invitrogen) a fluorescent nissl stain, or using antibodies against the InsR and vasopressin (mouse monoclonal antibody; 1:1000; gift of Dr Hal Gainer) followed by the addition of NeuroTrace. The tissue sections underwent the exact same procedure described above, but after incubation in secondary antibodies, and rinses in 0.1 m TS and 0.1 m PB, sections were incubated for 20 min in NeuroTrace 500/525 (1:400, Invitrogen) in 0.1 m PB. This incubation was followed with three 5 min rinses in 0.1 m PB and then a 2 h rinse in 0.1 m PB before mounting onto gelatin-coated slides.
Section analysis
The distribution of GAD 65/67, InsR, and synaptophysin immunoreactivity was examined at three distinct rostrocaudal levels of PVN corresponding to approximately −1.6, −1.9 and −2.1 mm from Bregma (Paxinos and Watson atlas). At each rostrocaudal level, three, non-overlapping confocal Z-projections through the vertical extent of labelling for all three antibodies were collected to sample one side of PVN. The thickness of each optical section was 0.5 μm. Images were collected using the single pass, multi-tracking format on a Zeiss LSM 510 META confocal microscope (Carl Zeiss MicroImaging, Inc., Thornwood, NY, USA).
To determine what percentage of presynaptic GABAergic terminals contain the InsR, GAD 65/67-immunoreactive (-ir) varicosities (150 varicosities per animal per level) co-localised with synaptophysin immunoreactivity were identified within the boundaries of PVN, as well as within the vertical boundaries, that included immunoreactivity for all three antibodies. These varicosities were then examined for the additional presence of InsR immunoreactivity. Criteria for co-localisation of immunoreactivity between different antigens were similar to our previous studies (Mitchell et al. 2004; Silverman et al. 2005). Specifically, the immunoreactivity for the antigens of interest had to be included entirely within the identified varicosity in at least two consecutive optical sections. Additionally, the converse analysis, to determine what percentage of presynaptic InsR-ir varicosities were GABAergic, was performed. All InsR-ir varicosities that were co-localised with synaptophysin-immunoreactivity were identified and evaluated for co-localization with GAD 65/67 immunoreactivity (total of 81 varicosities from 3 rostrocaudal levels of 3 animals). All co-localisation analyses were verified by two observers with any discrepancies being re-evaluated by both observers.
Results
Insulin increases LSNA and gain of baroreflex control of LSNA
The blood glucose level at baseline was 87 ± 5 mg dl−1 and was clamped at this level for the duration of the insulin infusion (in mg dl−1: 88 ± 7 at 30 min, 83 ± 9 at 60 min, 78 ± 10 at 90 min and 91 ± 10 at 120 min). Similarly, before the saline infusion, the blood glucose level was 84 ± 2 mg dl−1 and remained stable for the duration of the experiment (in mg dl−1: 80 ± 3 at 30 min, 84 ± 5 at 60 min, 86 ± 2 at 90 min and 82 ± 4 at 120 min).
Insulin infusion increased basal LSNA significantly after 60 min and this effect was sustained for the duration of the infusion (Fig. 1). The baroreflex maximum and range (Table 1) and baroreflex gain of LSNA (Fig. 2) were elevated 60–120 min after initiating the insulin infusion. Saline infusion had no significant effects on LSNA, any LSNA baroreflex parameter, or on LSNA gain (Table 1, Figs 1 and 2). Neither insulin nor saline infusion had a significant effect on basal HR, MAP or baroreflex gain of HR (Figs 1 and 2, Table 2).
Figure 1. Insulin infusion increases basal LSNA above control, but has no effect on MAP or HR.
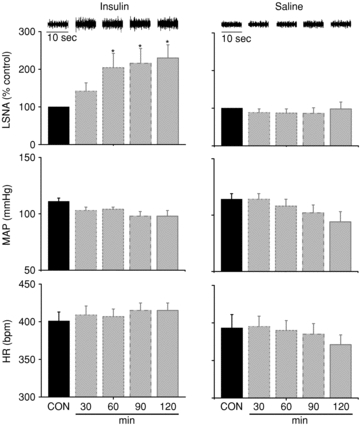
I.V. insulin infusion (left) increases basal LSNA above control (CON) at 60 min and for the duration of the infusion, but has no effect on MAP or HR. I.V. saline infusion (right) does not significantly alter LSNA, MAP or HR at any time point. Top inserts are representative raw LSNA recordings. *P < 0.05 vs. CON.
Table 1.
Time control baroreflex parameters for LSNA during insulin and saline infusion
| CON | 30 min | 60 min | 90 min | 120 min | |
|---|---|---|---|---|---|
| Insulin (n = 6) | |||||
| Max (% control) | 180 ± 17 | 206 ± 28 | 278 ± 31* | 266 ± 40* | 304 ± 48* |
| Min (% control) | 16 ± 11 | 4 ± 11 | 49 ± 32 | 43 ± 25 | 39 ± 23 |
| Range (% control) | 164 ± 23 | 202 ± 31 | 229 ± 27* | 224 ± 29* | 265 ± 47* |
| BP50 (mmHg) | 107 ± 5 | 105 ± 7 | 106 ± 6 | 105 ± 4 | 100 ± 7 |
| Width (mmHg) | 13 ± 2 | 13 ± 2 | 9 ± 3 | 8 ± 3 | 12 ± 2 |
| Saline (n = 6) | |||||
| Max (% control) | 169 ± 30 | 159 ± 24 | 117 ± 16 | 123 ± 23 | 128 ± 27 |
| Min (% control) | 19 ± 10 | 10 ± 7 | 9 ± 8 | 8 ± 4 | 12 ± 8 |
| Range (% control) | 150 ± 36 | 149 ± 28 | 108 ± 19 | 116 ± 25 | 115 ± 28 |
| BP50 (mmHg) | 106 ± 3 | 106 ± 4 | 107 ± 3 | 103 ± 6 | 97 ± 3 |
| Width (mmHg) | 13 ± 3 | 16 ± 4 | 9 ± 1 | 11 ± 3 | 14 ± 5 |
P < 0.05 vs. CON.
Figure 2. Insulin infusion increases baroreflex gain of LSNA, but has no effect on baroreflex gain of HR.
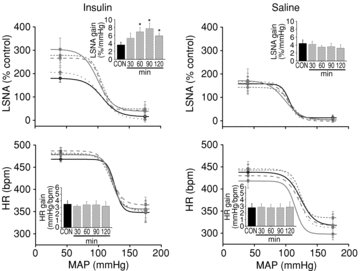
Insulin infusion (left) increases baroreflex gain of LSNA at 60 min and for the duration of the infusion, but has no effect on baroreflex gain of HR. Saline infusion (right) has no effect on baroreflex gain of LSNA or HR. Continuous black line (CON), dotted grey line (30 min), short dashed grey line (60 min), dashed grey line (90 min) and continuous grey line (120 min). *P < 0.05 vs. CON.
Table 2.
Time control baroreflex parameters for HR during insulin and saline infusion
| CON | 30 min | 60 min | 90 min | 120 min | |
|---|---|---|---|---|---|
| Insulin (n = 6) | |||||
| Max (bpm) | 468 ± 6 | 482 ± 12 | 480 ± 13 | 487 ± 8 | 478 ± 9 |
| Min (bpm) | 348 ± 21 | 349 ± 24 | 353 ± 22 | 365 ± 18 | 356 ± 20 |
| Range (bpm) | 120 ± 20 | 133 ± 23 | 127 ± 15 | 121 ± 13 | 122 ± 18 |
| BP50 (mmHg) | 126 ± 4 | 124 ± 4 | 121 ± 4 | 121 ± 3 | 122 ± 3 |
| Width (mmHg) | 6 ± 3 | 10 ± 2 | 11 ± 1 | 9 ± 1 | 7 ± 4 |
| Saline (n = 6) | |||||
| Max (bpm) | 438 ± 17 | 446 ± 16 | 443 ± 13 | 430 ± 13 | 418 ± 16 |
| Min (bpm) | 318 ± 26 | 313 ± 18 | 335 ± 14 | 317 ± 20 | 298 ± 13 |
| Range (bpm) | 120 ± 26 | 133 ± 18 | 108 ± 19 | 113 ± 15 | 115 ± 18 |
| BP50 (mmHg) | 124 ± 3 | 121 ± 3 | 123 ± 3 | 121 ± 2 | 115 ± 2 |
| Width (mmHg) | 10 ± 4 | 8 ± 4 | 7 ± 3 | 10 ± 2 | 7 ± 1 |
P < 0.05 vs. CON.
Role of the PVN
PVN inhibition reverses the effect of intravenous insulin to increase LSNA and baroreflex gain of LSNA
As in the time control experiments, blood glucose (in mg dl−1) remained stable during the experiment in both the insulin infusion group (87 ± 5 at baseline, 92 ± 5 after 60 min of insulin infusion, and 89 ± 5 after PVN inhibition with muscimol) and the saline infusion group (85 ± 8 at baseline, 84 ± 3 after 60 min of saline infusion, and 85 ± 7 after PVN inhibition with muscimol).
The effect of i.v. insulin infusion to increase basal LSNA after 60 min was reversed following acute inhibition of PVN with muscimol (Fig. 3). PVN inhibition also reversed the effect of insulin to increase the baroreflex maximum and range of LSNA and baroreflex gain of LSNA (Figs 4 and 5, Table 3). In contrast, in rats receiving i.v. saline, microinjection of muscimol into the PVN did not alter LSNA, HR, or baroreflex control of LSNA and HR (Figs 3 and 4, Tables 3 and 4). In the saline-infused group, MAP was lower following inhibition of PVN with muscimol; however, the value was not significantly different from the value at the same time point in the insulin-infused group.
Figure 3. PVN inhibition with muscimol reverses the effect of insulin (left) to increase basal LSNA, but has no effect on MAP or HR.
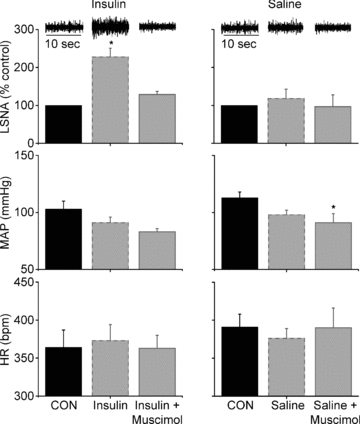
PVN inhibition during saline infusion (right) has no effect on basal LSNA or HR, but decreased MAP. *P < 0.05 vs. CON.
Figure 4. The effect of insulin to increase baroreflex gain of LSNA from control is reversed by blockade of PVN with muscimol.
The effect of insulin (left) to increase baroreflex gain of LSNA (grey continuous line) from control (black continuous line) is reversed by blockade of PVN with muscimol (grey dashed line). PVN inhibition has no effect on baroreflex gain of HR. PVN inhibition during saline infusion (right) did not change baroreflex control of LSNA or HR. *P < 0.05 vs. CON.
Figure 5. Increase in baroreflex gain of LSNA after insulin infusion, and reversal by PVN inhibition with muscimol.
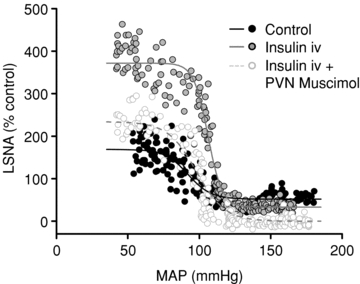
Representative experiment showing an increase in baroreflex gain of LSNA from control (black circles, continuous black line) after 60 min of insulin infusion (grey circles, continuous grey line), and reversal by PVN inhibition with muscimol (white circles, dashed grey line).
Table 3.
Baroreflex parameters for LSNA after 60 min of insulin or saline infusion and following PVN inhibition with muscimol
| CON | 60 min | Muscimol | |
|---|---|---|---|
| Insulin (n = 6) | |||
| Max (% control) | 171 ± 24 | 304 ± 51* | 198 ± 13 |
| Min (% control) | 29 ± 12 | 35 ± 9 | 22 ± 9 |
| Range (% control) | 142 ± 31 | 269 ± 52* | 176 ± 15 |
| BP50 (mmHg) | 91 ± 7 | 90 ± 8 | 83 ± 4 |
| Width (mmHg) | 11 ± 1 | 14 ± 5 | 15 ± 5 |
| Saline (n = 6) | |||
| Max (% control) | 203 ± 2 | 190 ± 12 | 192 ± 11 |
| Min (% control) | 25 ± 10 | 30 ± 10 | 31 ± 13 |
| Range (% control) | 179 ± 19 | 160 ± 4 | 160 ± 7 |
| BP50 (mmHg) | 102 ± 3 | 100 ± 4 | 88 ± 7 |
| Width (mmHg) | 10 ± 1 | 14 ± 2 | 11 ± 2 |
P < 0.05 vs. CON.
Table 4.
Baroreflex parameters for HR after 60 min of insulin or saline infusion and following PVN inhibition with muscimol
| CON | 60 min | Muscimol | |
|---|---|---|---|
| Insulin (n = 6) | |||
| Max (bpm) | 399 ± 20 | 419 ± 17 | 405 ± 16 |
| Min (bpm) | 326 ± 18 | 329 ± 17 | 317 ± 13 |
| Range (bpm) | 73 ± 8 | 90 ± 7 | 89 ± 1 |
| BP50 (mmHg) | 114 ± 5 | 107 ± 5 | 108 ± 3 |
| Width (mmHg) | 8 ± 1 | 9 ± 1 | 10 ± 1 |
| Saline (n = 6) | |||
| Max (bpm) | 422 ± 14 | 421 ± 22 | 410 ± 19 |
| Min (bpm) | 334 ± 10 | 336 ± 12 | 322 ± 15 |
| Range (bpm) | 88 ± 11 | 85 ± 15 | 89 ± 20 |
| BP50 (mmHg) | 115 ± 3 | 106 ± 7 | 105 ± 5 |
| Width (mmHg) | 11 ± 2 | 13 ± 2 | 12 ± 2 |
P < 0.05 vs. CON.
In three rats in which the muscimol microinjection was delivered ≥500 μm caudal to the PVN, the increase in LSNA gain after insulin (in % mmHg−1; from 3.4 ± 0.4 to 4.7 ± 0.4, P < 0.05) was not reversed but was further elevated (to 6.2 ± 0.7% mmHg−1, P < 0.05), although this increment was not different from values obtained in time control animals receiving i.v. insulin (2-way ANOVA; P > 0.10).
Insulin microinjection in PVN has no effect on LSNA or baroreflex gain of LSNA
PVN microinjection of the lower doses of insulin, or aCSF, each failed to affect basal LSNA, MAP and HR, as well as baroreflex parameters and baroreflex gain of LSNA and HR (Figs 6 and 7, Table 5). Similarly, microinjection of the higher insulin doses also was ineffective (data not shown).
Figure 6.
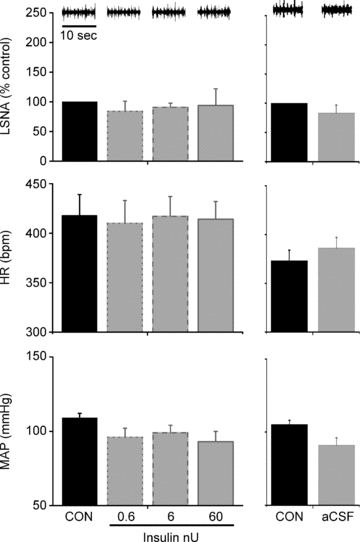
Microinjection of insulin (left) or aCSF (right) into the PVN has no effect on basal LSNA, MAP or HR
Figure 7. PVN microinjection of insulin (left) or aCSF (right) has no effect on baroreflex gain of LSNA or HR.
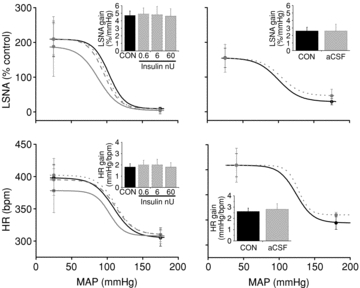
Continuous black line (CON), dotted grey line (0.6 nU), dashed grey line (6 nU), continuous grey line (60 nU) and dotted light grey line (aCSF). *P < 0.05 vs. CON.
Table 5.
Baroreflex parameters for LSNA (as % of CON) and HR (in bpm) after microinjection of insulin (0.6, 6 and 60 nU) or aCSF into the PVN
| CON (n = 4) | 0.6 nU | 6 nU | 60 nU | CON (n = 6) | aCSF | |
|---|---|---|---|---|---|---|
| LSNA | ||||||
| Max (% control) | 209 ± 49 | 209 ± 45 | 210 ± 52 | 188 ± 58 | 155 ± 28 | 154 ± 40 |
| Min (% control) | 9 ± 4 | 5 ± 5 | 9 ± 4 | 4 ± 4 | 29 ± 9 | 46 ± 19 |
| Range (% control) | 200 ± 44 | 204 ± 49 | 201 ± 51 | 186 ± 56 | 126 ± 31 | 108 ± 21 |
| BP50 (mmHg) | 103 ± 8 | 100 ± 6 | 96 ± 7 | 88 ± 13 | 100 ± 3 | 104 ± 6 |
| Width (mmHg) | 11 ± 2 | 11 ± 1 | 11 ± 1 | 14 ± 2 | 15 ± 3 | 14 ± 3 |
| HR | ||||||
| Max (bpm) | 398 ± 20 | 402 ± 26 | 395 ± 24 | 378 ± 34 | 459 ± 23 | 459 ± 34 |
| Min (bpm) | 304 ± 13 | 310 ± 11 | 310 ± 6 | 308 ± 12 | 344 ± 13 | 360 ± 5 |
| Range (bpm) | 93 ± 13 | 92 ± 18 | 85 ± 22 | 70 ± 21 | 114 ± 13 | 99 ± 30 |
| BP50 (mmHg) | 129 ± 8 | 132 ± 3 | 122 ± 10 | 123 ± 3 | 124 ± 3 | 127 ± 1 |
| Width (mmHg) | 14 ± 2 | 13 ± 3 | 12 ± 2 | 10 ± 1 | 14 ± 1 | 8 ± 1 |
InsR are found in both parvocellular and magnocellular PVN subnuclei
InsR immunoreactivity was observed in neurons (Supplemental Fig. 1) at all PVN levels examined, in both magnocellular and parvocellular subdivisions (Figs 8 and 9). In the posterior magnocellular region, InsR-staining co-localised with vasopressin immunoreactivity in some neurons (Fig. 8D–G). InsR-labelled parvocellular cells were particularly prominent in the ventral lateral parvocellular subdivision, the periventricular region, and the most caudal region of PVN (Fig. 8H–J and K–M). InsR-positive cells were not restricted to the PVN; immunoreactivity was also noted in cells just outside the boundaries of PVN (Figs 8 and 9). Presynaptic InsR immunoreactivity was rare, with only a few varicosities containing both InsR and synaptophysin immunoreactivity detected in the entire scanned area (Fig. 9 and Table 6).
Figure 8. Insulin receptor (InsR) distribution at three different rostrocaudal levels of the PVN.
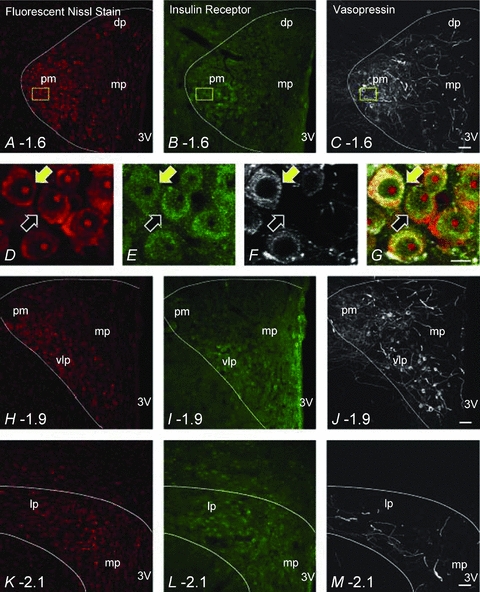
Confocal micrographs are approximately 6 μm thick projections composed of 4 consecutive optical slices in panels A–C, H–J and K–M. Panels D–G are 1.5 μm thick projections composed of 2 consecutive optical slices that are increased magnification images of the area represented by the yellow rectangle in panels A–C. Each horizontal row depicts NeuroTrace fluorescent nissl stain (red), InsR immunoreactivity (green) and vasopressin immunoreactivity (white) in the PVN (approximated by the white line) at the three different rostrocaudal levels examined. Panels A, B and C approximately 1.6 mm caudal from Bregma. Panels D–G illustrate InsR immunoreactivity and vasopressin immunoreactivity in NeuroTrace fluorescent nissl stained PVN neurons. The yellow arrows point to a neuron that contains both InsR and vasopressin. The black arrows indicate a neuron that only contains InsR immunoreactivity. Scale bar = 10 μm. Panels H, I and J, approximately 1.9 mm caudal from Bregma, and panels K, L and M, approximately 2.1 mm caudal from Bregma. NeuroTrace fluorescent nissl staining, InsR immunoreactivity and vasopressin immunoreactivity are clearly present at all levels examined. dp, dorsal parvocellular; pm, posterior magnocellular; mp, medial parvocellular; 3V, 3rd ventricle; vlp, ventrolateral posterior subnucleus; lp, lateral parvocellular. Scale bar = 50 μm for panels A–C, H–J and K–M.
Figure 9. GAD65/67 varicosities contact InsR immunoreactive cells.
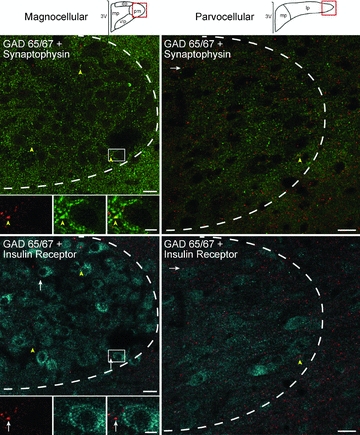
Confocal micrographs illustrate GAD65/67 (red), synaptophysin (green), and InsR (blue) immunoreactivity within PVN at approximately –1.9 from Bregma (left) and –2.1 from Bregma (right). Representative diagrams of magnocellular and parvocellular regions are similar to Stocker et al. (2004) and are modified from the digital atlas of Paxinos and Watson (1998) with permission from the publisher. Left column: in the posterior magnocellular subnucleus (pm), most GAD 65/67-immunoreactive (-ir) varicosities that contain synaptophysin (yellow arrowheads) did not contain the insulin receptor (inset, top left). However, they did occasionally form appositions with InsR labelled cells (white arrows, inset bottom left). Insets represented by white rectangle. The dashed white line delineates the approximate boundary of the PVN. Right column: similar results are seen in the lateral parvocelluar subnucleus (lp). Images on left are 1.0 μm thick, composed of 3 consecutive optical sections. Images on right are 1.5 μm thick, composed of 4 consecutive optical sections. dp, dorsal parvocellular; mp, medial parvocellular; 3V, 3rd ventricle. Scale bar = 5 μm for all inset pictures and 20 μm for all low magnification images.
Table 6.
Quantification of GAD65/67 (GAD), synaptophysin (syn) and insulin receptor (InsR) profiles and their interactions in PVN (n = 3 animals)
| PVN level (mm from Bregma) | Total no.(GAD+syn) varicosities counted | No.of (GAD+syn) +InsR | Total no.(InsR+syn) varicosities counted | No.of (InsR+syn) +GAD | No.of (GAD+syn) apposed to InsR cell |
|---|---|---|---|---|---|
| 1.6 | 450 | 6 | 26 | 2 | 116 (26%) |
| 1.9 | 450 | 1 | 21 | 1 | 69 (15%) |
| 2.1 | 450 | 12 | 34 | 3 | 32 (7%) |
| Totals | 1350 | 19 (1.4%) | 81 | 6 (7.4%) | 217 |
PVN InsRs rarely co-localise with GAD 65/67
GAD 65/67 immunoreactivity was also seen throughout the PVN but was predominantly observed in varicosities (Fig. 9). Of 1350 GAD65/67-ir varicosities very few contained InsR immunoreactivity (1.4%; 19 of 1350; Table 6; Fig. 9). In the converse, of the 81 InsR-immunoreactive varicosities found, only a small portion contained GAD 65/67 immunoreactivity (7.4%, 6 of 81; Table 6). Thus, while InsR immunoreactivity was found predominantly postsynaptically, GAD 65/67 immunoreactivity was primarily observed presynaptically.
While co-localisation of InsR and GAD 65/67 immunoreactivity was rare, there was evidence of direct interactions between InsR and GAD 65/67 elements. Namely presynaptic GAD 65/67-ir varicosities were often apposed to InsR-labelled cells (Fig. 9). In addition, the prevalence of this interaction appeared to vary across rostrocaudal levels of PVN. At the most rostral level examined, 1.6 mm from Bregma, 26% (116 of 450) of the presynaptic GAD 65/67-ir varicosities were apposed to InsR-ir cells and this percentage decreased caudally through the PVN, to 15% (69 of 450) at 1.9 mm from Bregma, and 7% (32 of 450) at 2.1 mm from Bregma (Table 6).
Role of the ArcN
ArcN blockade reverses the effect of intravenous insulin to increase LSNA and baroreflex gain of LSNA
Blood glucose (in mg dl−1) remained stable during the experiment in both the insulin infusion group (87 ± 4 at baseline, 90 ± 8 after 60 min of insulin infusion, and 90 ± 8 after ArcN inhibition with muscimol) and the saline infusion group (87 ± 7 at baseline, 85 ± 4 after 60 min of saline infusion, and 89 ± 8 after ArcN inhibition with muscimol).
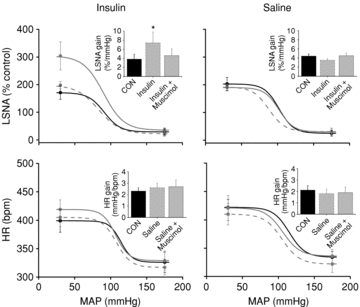
The effect of 60 min i.v. insulin infusion to increase basal LSNA and the baroreflex maximum, range and gain of LSNA was reversed following acute inhibition of the ArcN with muscimol (Figs 10–12 and Table 7). In contrast, neither insulin nor ArcN muscimol during i.v. insulin modified HR or its baroreflex regulation (Figs 10 and 11 and Table 8). Similarly, in rats receiving i.v. saline, microinjection of muscimol into the ArcN did not alter LSNA, HR, or baroreflex control of LSNA and HR (Figs 10 and 11 and Tables 7 and 8).
Figure 10. ArcN inhibition with muscimol reverses the effect of insulin (left) to increase basal LSNA, but has no effect on MAP or HR.
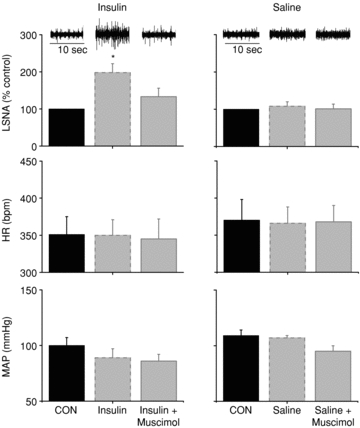
ArcN blockade during saline infusion (right) has no effect on basal LSNA, MAP or HR. *P < 0.05 vs. CON.
Figure 12. Representative experiments demonstrating the role of the ArcN in the effect of insulin to increase LSNA baroreflex gain.
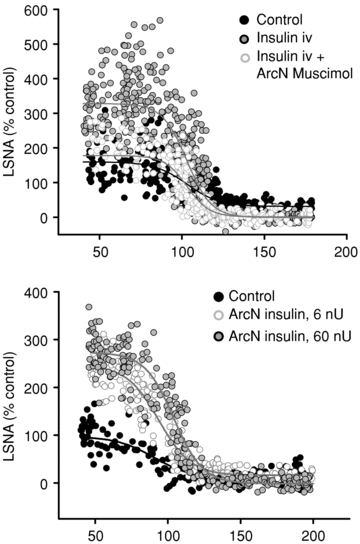
Microinjection of muscimol (top) into the ArcN (continuous grey line, white circles) reverses the effect of i.v. insulin (continuous grey line, grey circles) to increase LSNA baroreflex gain compared to control (continuous black line, black circles). Microinjection of insulin in ArcN (bottom) with doses of 6 nU (continuous grey line, white circles) and 60 nU (continuous grey line, grey circles) increases baroreflex gain of LSNA compared to control (continuous black line, black circles).
Table 7.
Baroreflex parameters for LSNA (as % of control) after 60 min of insulin or saline infusion and following ArcN inhibition with muscimol
| CON | 60 min | Muscimol | |
|---|---|---|---|
| Insulin (n = 4) | |||
| Max (% control) | 164 ± 7 | 345 ± 40* | 212 ± 23 |
| Min (% control) | 7 ± 7 | 11 ± 4 | 17 ± 12 |
| Range (% control) | 157 ± 11 | 334 ± 42* | 195 ± 11 |
| BP50 (mmHg) | 98 ± 7 | 98 ± 6 | 99 ± 7 |
| Width (mmHg) | 10 ± 0 | 9 ± 1 | 10 ± 1 |
| Saline (n = 4) | |||
| Max (% control) | 243 ± 28 | 223 ± 41 | 211 ± 30 |
| Min (% control) | 43 ± 8 | 34 ± 13 | 22 ± 7 |
| Range (% control) | 200 ± 24 | 189 ± 29 | 189 ± 25 |
| BP50 (mmHg) | 91 ± 6 | 93 ± 3 | 98 ± 7 |
| Width (mmHg) | 14 ± 1 | 13 ± 1 | 14 ± 1 |
P < 0.05 vs. CON.
Figure 11. The effect of insulin to increase baroreflex gain of LSNA is reversed by inhibition of ArcN with muscimol.
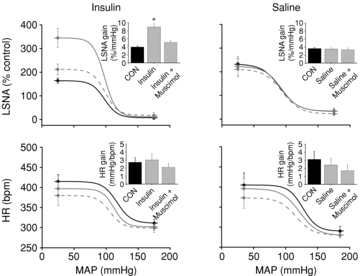
The effect of insulin (left) to increase baroreflex gain of LSNA (grey continuous line) from control (black continuous line) is reversed by inhibition of ArcN with muscimol (grey dashed line). ArcN inhibition has no effect on baroreflex gain of HR. ArcN inhibition during saline infusion (right) did not change baroreflex control of LSNA or HR. *P < 0.05 vs. CON.
Table 8.
Baroreflex parameters for HR (in bpm) after 60 min of insulin or saline infusion and following ArcN inhibition with muscimol
| CON | 60 min | Muscimol | |
|---|---|---|---|
| Insulin (n = 4) | |||
| Max (bpm) | 415 ± 17 | 397 ± 16 | 380 ± 25 |
| Min (bpm) | 311 ± 9 | 302 ± 8 | 299 ± 11 |
| Range (bpm) | 104 ± 18 | 96 ± 22 | 82 ± 18 |
| BP50 (mmHg) | 117 ± 2 | 112 ± 3 | 106 ± 4 |
| Width (mmHg) | 11 ± 1 | 9 ± 1 | 10 ± 1 |
| Saline (n = 4) | |||
| Max (bpm) | 396 ± 27 | 396 ± 21 | 373 ± 26 |
| Min (bpm) | 277 ± 6 | 279 ± 6 | 280 ± 3 |
| Range (bpm) | 119 ± 31 | 117 ± 27 | 92 ± 28 |
| BP50 (mmHg) | 130 ± 3 | 122 ± 7 | 116 ± 5 |
| Width (mmHg) | 11 ± 1 | 14 ± 1 | 13 ± 1 |
Insulin microinjection in the ArcN increases LSNA and baroreflex gain of LSNA
ArcN insulin microinjections increased basal LSNA at all of the lower doses given (Fig. 13) and also significantly increased the maximum, range and gain of baroreflex control of LSNA (Figs 12 and 14, Table 9). ArcN microinjection of the higher insulin doses also increased LSNA (in % control: from 100 ± 0 to 155 ± 16 (6 μU), 209 ± 42 (60 μU), and 203 ± 17 (600 μU)) and increased gain of baroreflex control of LSNA (in % mmHg−1: from 3.3 ± 0.4 to 4.6 ± 0.7 (6 μU), 5.4 ± 0.5 (60 μU), and 4.3 ± 0.4 (600 μU)). In contrast, low dose (and high dose, data not shown) insulin microinjection into the ArcN had no effect on basal HR, MAP, any baroreflex parameters for HR, or baroreflex gain of HR (Figs 13 and 14, Table 9). Microinjection of aCSF also did not affect basal LSNA, MAP, HR (Fig. 13), any of the baroreflex parameters for HR or LSNA (Table 9), or baroreflex gain of HR and LSNA (Fig. 14).
Figure 13. Microinjection of insulin (left) but not aCSF (right) into the ArcN increases basal LSNA, but has no effect on MAP or HR.
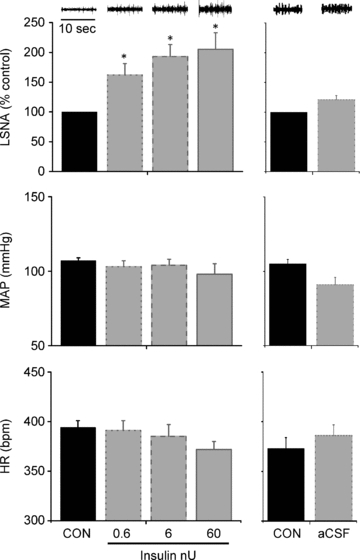
*P < 0.05 vs. CON.
Figure 14. ArcN microinjection of insulin (left) but not aCSF (right) increases gain of baroreflex control of LSNA but not HR.
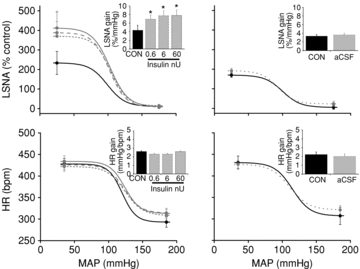
Continuous black line (CON), dotted grey line (0.6 nU), dashed grey line (6 nU), continuous grey line (60 nU) and dotted light grey line (aCSF). *P < 0.05 vs. CON.
Table 9.
Baroreflex parameters for LSNA (as % of CON) and HR (in bpm) after microinjection of insulin (0.6, 6 and 60 nU) or aCSF into the ArcN
| CON (n = 6) | 0.6 nU | 6 nU | 60 nU | CON (n = 8) | aCSF | |
|---|---|---|---|---|---|---|
| LSNA | ||||||
| Max (% control) | 238 ± 57 | 374 ± 73* | 401 ± 101* | 412 ± 86* | 163 ± 12 | 190 ± 12 |
| Min (% control) | 11 ± 8 | 13 ± 9 | 6 ± 12 | 10 ± 10 | 8 ± 9 | 21 ± 12 |
| Range (% control) | 226 ± 62 | 361 ± 75* | 395 ± 104* | 406 ± 84* | 156 ± 14 | 168 ± 12 |
| BP50 (mmHg) | 99 ± 3 | 103 ± 2 | 104 ± 3 | 103 ± 5 | 103 ± 6 | 94 ± 4 |
| Width (mmHg) | 14 ± 1 | 13 ± 1 | 12 ± 1 | 13 ± 1 | 14 ± 2 | 11 ± 2 |
| HR | ||||||
| Max (bpm) | 428 ± 13 | 422 ± 11 | 426 ± 11 | 434 ± 13 | 429 ± 14 | 431 ± 12 |
| Min (bpm) | 293 ± 12 | 308 ± 7 | 314 ± 8 | 313 ± 10 | 311 ± 19 | 312 ± 8 |
| Range (bpm) | 135 ± 16 | 114 ± 12 | 112 ± 14 | 122 ± 18 | 118 ± 14 | 119 ± 16 |
| BP50 (mmHg) | 120 ± 4 | 124 ± 5 | 123 ± 6 | 124 ± 3 | 116 ± 5 | 111 ± 6 |
| Width (mmHg) | 10 ± 1 | 13 ± 1 | 12 ± 1 | 11 ± 1 | 12 ± 2 | 14 ± 1 |
P < 0.05 vs. CON.
Insulin microinjection in the DMH has no effect on LSNA or baroreflex gain of LSNA
Microinjection of aCSF or insulin at any dose in the DMH had no effect on basal LSNA, HR or MAP, baroreflex gain of LSNA or HR, or any baroreflex parameters for LSNA and HR (Table 10).
Table 10.
Basal, gain and baroreflex parameters for LSNA (as % of CON) and HR (in bpm) after microinjection of insulin (6, 60 and 600 μU) and vehicle (aCSF) into the DMH (n = 3)
| CON | 6 μU | 60 μU | 600 μU | aCSF | |
|---|---|---|---|---|---|
| Basal | |||||
| LSNA (% control) | 100 ± 0 | 116 ± 13 | 119 ± 16 | 117 ± 13 | 117 ± 19 |
| HR (bpm) | 398 ± 18 | 400 ± 18 | 393 ± 17 | 395 ± 21 | 393 ± 14 |
| MAP (mmHg) | 119 ± 4 | 103 ± 6 | 100 ± 4 | 103 ± 9 | 108 ± 5 |
| LSNA | |||||
| Gain (% control mmHg−1) | 4.4 ± 0.3 | 4.5 ± 0.6 | 4.2 ± 0.2 | 4.3 ± 0.2 | 4.4 ± 0.3 |
| Max (% control) | 230 ± 25 | 208 ± 17 | 190 ± 7 | 206 ± 33 | 229 ± 32 |
| Min (% control) | 12 ± 3 | 24 ± 2 | 15 ± 5 | 21 ± 6 | 13 ± 0 |
| Range (% control) | 218 ± 28 | 184 ± 15 | 175 ± 15 | 185 ± 38 | 217 ± 32 |
| BP50 (mmHg) | 113 ± 2 | 108 ± 6 | 101 ± 1 | 103 ± 5 | 110 ± 0 |
| Width (mmHg) | 11 ± 0 | 10 ± 2 | 10 ± 2 | 11 ± 1 | 12 ± 1 |
| HR | |||||
| Gain (bpm mmHg−1) | 1.5 ± 0.2 | 1.6 ± 0.2 | 1.4 ± 0.2 | 1.6 ± 0.1 | 1.6 ± 0.1 |
| Max (bpm) | 430 ± 3 | 419 ± 3 | 393 ± 4 | 397 ± 12 | 420 ± 11 |
| Min (bpm) | 361 ± 3 | 323 ± 13 | 289 ± 6 | 301 ± 12 | 331 ± 14 |
| Range (bpm) | 70 ± 6 | 97 ± 9 | 119 ± 5 | 99 ± 10 | 131 ± 2 |
| BP50 (mmHg) | 128 ± 3 | 135 ± 2 | 119 ± 5 | 125 ± 3 | 131 ± 2 |
| Width (mmHg) | 14 ± 3 | 21 ± 4 | 18 ± 3 | 16 ± 1 | 15 ± 2 |
Histology
Figure 15 illustrates representative histological sections and the centres of microinjection sites into the PVN, ArcN and DMH, as indicated by position of the dye injected at the end of the experiment.
Figure 15. The sites of PVN and ArcN microinjections.
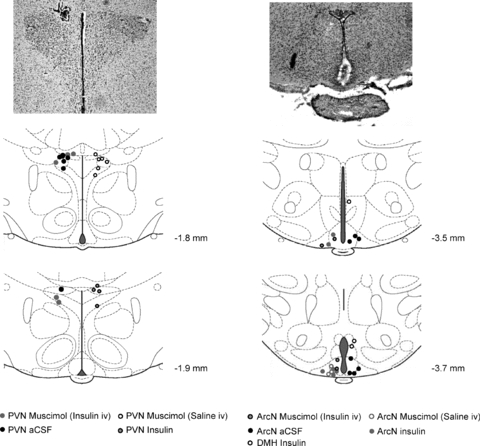
Representative histological sections (top) and hypothalamic anatomical diagrams (bottom) showing the sites of PVN microinjections of muscimol (left; grey circles for insulin infused rats and black open circles for saline infused rats), insulin (left; black, grey-filled circles), and aCSF (black circles), as well as ArcN microinjections of muscimol (right; black, grey-filled circles for insulin infused rats and grey open circles for saline infused rats), insulin (grey circles) and aCSF (black circles), and DMH (right, black open circles). Diagrams were modified from the Paxinos and Watson brain atlas with permission from the publisher.
Discussion
The purpose of this study was to identify the specific brain site at which insulin acts to increase LSNA and gain of baroreflex control of LSNA. The major new findings are that (1) the effect of i.v. insulin to increase LSNA and baroreflex gain of LSNA was reversed by local inhibition of the PVN or the ArcN; (2) microinjection of insulin into the PVN had no effect on LSNA or baroreflex control of LSNA; (3) while InsRs were identified in preautonomic regions in PVN, they were expressed largely postsynaptically and rarely co-localised with GAD 65/67 in synaptic varicosities; and (4) microinjection of insulin into the ArcN increased both LSNA and baroreflex control of LSNA. Collectively, these data demonstrate that insulin acts in the ArcN, within a neural pathway that includes the PVN, to elicit increases in LSNA and gain of baroreflex control of LSNA.
One finding of the present study is that i.v. insulin is sympathoexcitatory, in agreement with previous studies of LSNA in rats (Morgan et al. 1993; Bardgett et al. 2010) and of muscle SNA (MSNA) in humans (Rowe et al. 1981; Anderson et al. 1991; Young et al. 2010). We also confirm that though increases in SNA are observed during increases in circulating insulin, the infusion has no significant effect on MAP, possibly due to the simultaneous systemic vasodilatory action of insulin counteracting sympathoexcitation (Anderson et al. 1991). The effect of insulin to increase SNA appears to be centrally mediated, as intracerebroventricular (i.c.v.) infusion of insulin has also been shown to increase LSNA (Muntzel et al. 1994; Pricher et al. 2008). In addition, through different signalling pathways, i.c.v. insulin increases SNA to brown adipose tissue and to the kidney (Muntzel et al. 1994; Rahmouni et al. 2004), although insulin has the most profound and rapid effect on LSNA (Morgan et al. 1993; Rahmouni et al. 2004). Because of this dominant effect of insulin on LSNA, we chose to focus on SNA to this vascular bed to identify its central site of action. We used a dose of insulin that produces rather high levels of insulin in plasma (Morgan et al. 1993) in order to maximise our ability to detect reversal following blockade of specific brain regions. Nevertheless, it is important to emphasise that lower, more physiological doses also increase SNA (Morgan et al. 1993; Bardgett et al. 2010; Young et al. 2010) and that the dose used in the present study probably increased plasma insulin to levels found in rats with type 2 diabetes mellitus (e.g. Zucker rats; Schwartz et al. 1990).
Our lab has recently shown that infusion of insulin into the lateral ventricle, but not the fourth ventricle, of anaesthetised rats increases LSNA (Pricher et al. 2008), suggesting the effect of insulin is initiated within the forebrain, probably the hypothalamus. We investigated the PVN and ArcN as two likely sites of action for insulin to increase LSNA.
Both sites contain insulin receptors (Werther et al. 1987; Unger et al. 1989; Marks et al. 1990), influence neural control of the circulation (Kenney et al. 2003; Weiss et al. 2003; Nakamura et al. 2009), and project to cardiovascular-regulating regions within the brainstem, such as the RVLM, and to the spinal cord (Sim & Joseph, 1991; Geerling et al. 2010). Blockade of the PVN reversed the effects of insulin, and this was not due to deterioration of the preparation, as time control experiments demonstrated that the experimental variables were stable for at least 2 h. Therefore, the reversal following PVN muscimol suggests that the neuronal pathway mediating the responses to i.v. insulin is likely to be via the PVN. Interestingly, 85% of PVN neurons projecting to the RVLM are glutamatergic (Stocker et al. 2006), and a glutamatergic synapse in the RVLM has recently been shown to mediate the effects of i.v. insulin to increase LSNA (Bardgett et al. 2010). Therefore, we speculate that a PVN to RVLM glutamatergic projection ultimately drives the increase in LSNA during systemic hyperinsulinaemia.
One approach used to investigate whether the sympathoexcitatory effects of insulin are initiated in the PVN was to determine if PVN insulin microinjection mimicked the effects of i.v. insulin infusion. However, a broad range of PVN insulin doses failed to significantly increase LSNA, suggesting that, although it is part of the pathway, the PVN is not the primary site of action of insulin.
In another approach, it was determined if InsRs are expressed in pre-autonomic PVN regions. The presence of InsRs in brain, specifically in the PVN, has been known for decades (Hill et al. 1986; Werther et al. 1987; Schulingkamp et al. 2000). Yet, surprisingly, specific locations within the multiple PVN subnuclei had not been previously described. The present study took advantage of the availability of an antibody previously documented as specific for the InsR (Figlewicz et al. 2003) to identify, using immunocytochemistry, InsR neuronal staining in both parvocellular and magnocellular PVN regions. In the posterior magnocellular region, neurons exhibiting dual labelling for vasopressin and the InsR were identified. Within parvocellular subdivisions, neurons positive for the InsR were found in subnuclei enriched with pre-autonomic neurons that project to the RVLM or the spinal cord (Stocker et al. 2004), including the ventral lateral parvocellular and the more caudally located lateral parvocellular subdivisions. Thus, InsRs are well poised to influence several systems controlled by the PVN, including the autonomic nervous system, vasopressin and oxytocin.
Because insulin is an inhibitory neuromodulator (Spanswick et al. 2000; Williams et al. 2010), if it acts in PVN, it would be expected to excite PVN pre-autonomic neurons by disinhibition. Therefore, we also tested if InsRs co-localised with enzymes prototypical of GABAergic neurons, GAD 65/67. However, InsRs rarely localised to axonal varicosities and were almost never found in GABAergic varicosities, suggesting that insulin's dominant role in the PVN is postsynaptic rather than presynaptic. Thus, we conclude that insulin does not appear to excite PVN neurons (including pre-autonomic neurons) by presynaptic inhibition of GABAergic inputs. These data also suggest that insulin and its receptors do not influence the autonomic nervous system and its baroreflex regulation via presynaptic inhibition of other PVN inputs shown to alter the baroreflex, such as noradrenaline or glutamate (Chen et al. 1996; Hwang et al. 1998).
The abundant presence of the InsR in neuronal cell bodies in pre-autonomic regions of PVN, in particular the most caudal regions, suggests that as an inhibitory neuromodulator, PVN microinjection of insulin would be expected to decrease rather than increase LSNA, as hypothesised. In this context, the lack of effect of PVN insulin microinjections suggests several possible interpretations. First, it is possible that while insulin directly inhibits PVN pre-autonomic neurons, it simultaneously suppresses pre-autonomic inhibitory PVN interneurons, causing excitation, so that the net effect is null. However, if this were the case, insulin is probably not acting presynaptically, as it was almost never found in synaptic varicosities. Second, in this anaesthetised preparation, the activity of PVN pre-autonomic neurons may be minimal; therefore, further inhibition by insulin would fail to cause demonstrable decreases in LSNA or blood pressure. In support of this possibility, the depressor and sympathoinhibitory actions of PVN microinjection of the inhibitory GABAA agonist muscimol are usually minimal (Fig. 3). Third, while the InsR was prominently expressed postsynaptically in the caudal PVN, not all neurons were positive (Figs 8 and 9). Therefore, the possibility remains that the InsR may not be expressed on PVN pre-autonomic neurons.
While the present data suggest that insulin does not act in PVN to influence the autonomic nervous system, two findings implicate the ArcN. First, local inhibition of the ArcN reversed the sympathoexcitatory actions of i.v. insulin. This finding alone does not directly establish the ArcN as the site at which systemic insulin acts; instead, use of molecules that specifically interfere with insulin's ability to activate its receptor is required. However, we further found that ArcN microinjection of insulin increased LSNA. Importantly, microinjection of insulin into the more dorsal DMH was without effect, indicating the site specificity of insulin's sympathoexcitatory action. Therefore, we conclude that the ArcN is a specific hypothalamic site at which insulin initiates its actions to increase basal LSNA.
As we only recorded LSNA, we cannot discount that other sympathetic nerves were also activated by insulin acting within the ArcN, as it has been shown that other nerves, such as the renal nerve, may respond to i.c.v. insulin albeit more slowly and at higher doses (Muntzel et al. 1994; Rahmouni et al. 2004). Moreover, since insulin's metabolic partner, leptin, triggers sympathoexcitation via several hypothalamic sites (Marsh et al. 2003; Montanaro et al. 2005; Rahmouni & Morgan, 2007), it is possible that other forebrain sites are also involved in the action of systemic insulin to increase LSNA or the activity of other sympathetic nerves. However, the finding that bilateral ArcN microinjection of muscimol largely reversed the effects of i.v. insulin indicates that the ArcN is the major site of action.
The effect of insulin to increase baroreflex gain of LSNA has been previously demonstrated in rats (Okada & Bunag, 1994; Pricher et al. 2008), and very recently in humans (Young et al. 2010), in which baroreflex gain of MSNA was increased in healthy males both postprandially and during the hyperinsulinaemic–euglycaemic clamp. An increase in LSNA and baroreflex gain of LSNA may contribute to MAP regulation during physiological increases in plasma insulin such as that which occurs after consumption of a meal, when splanchnic blood flow increases secondary to local vasodilatation. The present study confirms these earlier reports and also demonstrates for the first time that the effect of insulin to increase baroreflex gain of LSNA, in parallel to its sympathoexcitatory effect, requires the PVN, though the action is initiated in the ArcN.
Currently, the cellular mechanisms by which the effect of insulin in the ArcN is conveyed to the PVN are unknown. However, one or both of two major neuronal populations that project from the ArcN to the PVN could mediate the effects of insulin: neuropeptide Y (NPY) and pro-opiomelanocortin (POMC) neurons (Niswender et al. 2004; Plum et al. 2005). Insulin is an inhibitory peptide, causing hyperpolarisation of hypothalamic neurons (Spanswick et al. 2000). Therefore, to result in overall excitation, the effect of insulin is likely to be by suppression of an inhibitory projection from the ArcN to the PVN. i.c.v. infusion of NPY has been shown to decrease baroreflex gain of HR and renal SNA in rabbits (Matsumura et al. 2000). We therefore speculate that the effect of insulin is mediated via actions on ArcN NPY projections to PVN. Alternatively, it is possible that the neuronal pathway between the ArcN and PVN includes one or more additional relays. Finally, PVN inputs to another currently unknown brain region may be permissively required for insulin's actions to be transmitted via neuronal circuitry from the ArcN to brainstem premotor nuclei. Future experiments are required to test these hypotheses.
An interesting finding in our study was that while i.v. insulin infusion increased LSNA and baroreflex gain of LSNA, it had no significant effect on basal or baroreflex control of HR. These findings are in agreement with the recent study of Young et al. (2010) in humans, in which insulin was infused systemically and also our studies in conscious rats, utilising i.c.v. infusion of insulin (Azar & Brooks, 2011). These data suggest that normally insulin levels are sufficiently high to maximally support baroreflex gain of HR. However, other studies in anaesthetised rats have shown that central insulin increases gain of baroreflex control of HR (Okada & Bunag, 1994; Pricher et al. 2008). The discrepancy may be due to a difference in anaesthetic agents used. Urethane has been used routinely in anaesthetised rat studies investigating the effects of insulin on cardiovascular control, even though urethane by itself causes significant insulin resistance and hyperglycaemia (Porter, 1994; Kotanidou et al. 1996). Insulin resistance, such as that which occurs in pregnancy and obesity, is associated with attenuated HR baroreflex gain and decreases in brain insulin levels (Bunag et al. 1990; Kaiyala et al. 2000; Daubert et al. 2007; Azar & Brooks, 2011). In conscious pregnant (insulin resistant) rats, central infusion of insulin improves baroreflex gain of HR (Azar & Brooks, 2011). Therefore, we speculate that the significant increases in baroreflex gain of HR in response to insulin in urethane-anaesthetised rats might be explained by urethane-mediated insulin resistance, causing brain insulin levels to fall. In contrast, in the present study, rats were anaesthetised with α-chloralose, which does not cause insulin resistance, as noted by normal blood glucose levels.
The association between insulin resistance and blunted baroreflex function, such as during pregnancy and obesity, suggests a functional link between the two. This hypothesis is supported by evidence showing that when obese individuals lose weight, both insulin sensitivity and baroreflex function improve (Grassi et al. 1998; Emdin et al. 2001) and that in pregnant rabbits, normalisation of insulin sensitivity with rosiglitazone enhances baroreflex gain (Daubert et al. 2007). Although the mechanism by which insulin resistance impairs baroreflex gain is unclear, the link may be brain insulin. In insulin resistant states, CSF levels of insulin are considerably lower than in normal states (Kaiyala et al. 2000; Daubert et al. 2007; Azar & Brooks, 2011), possibly secondary to reduced transport of insulin from the circulation across the blood–brain barrier into the brain (Banks, 2004). Moreover, i.c.v. infusion of insulin normalises baroreflex function in pregnant and obese animals (Zhao & Brooks, 2010; Azar & Brooks, 2011). Therefore, our findings may lead to more cellular–molecular studies of the mechanisms by which insulin resistance and possibly low insulin brain levels attenuate baroreflex function.
In conclusion, we have demonstrated that the PVN and the ArcN are necessary for the effect of insulin to increase basal LSNA and baroreflex control of LSNA. The finding that microinjection of insulin into the PVN does not induce increases of LSNA or baroreflex gain suggests that it is not, however, the primary site of action. Instead, microinjections of insulin into the ArcN reveal it to be a site of action for insulin to increase both basal and baroreflex control of LSNA.
Acknowledgments
The authors are grateful to Dr Martin Myers for the gift of the InsR antibody and to Dr Hal Gainer for the gift of the vasopressin antibody. We also appreciate the technical assistance provided by Kelsey Whittier. This work was supported in part by NIH grants HL70962 and HL088552 (V.L.B.), and HL056301 (S.A.A.), and a Grant-in-Aid from the American Heart Association, Pacific Mountain Affiliate (V.L.B.).
Glossary
Abbreviations
- ArcN
arcuate nucleus
- BRG
baroreflex gain
- HR
heart rate
- LSNA
lumbar sympathetic nerve activity
- MAP
mean arterial pressure
- PVN
paraventricular nucleus
- SNA
sympathetic nerve activity
Author contributions
P.A.C and V.L.B. contributed to the conception, design, analysis and/or interpretations of the microinjection rat data presented in this paper. V.L.B., S.A.A. and S.M.H. contributed to the conception, design, analysis and/or interpretations of the PVN anatomical/immunocytochemistry data. All authors approved the final version of the paper for publication.
Supplementary material
Suppl. Fig. 1
Suppl. Fig. 2
Suppl. Fig. 3
Suppl. Fig. 4
Suppl. Fig. 5
Suppl. Fig. 6
Suppl. Fig. 7
Suppl. Fig. 8
Suppl. Fig. 9
Suppl. Fig. 10
As a service to our authors and readers, this journal provides supporting information supplied by the authors. Such materials are peer-reviewed and may be re-organized for online delivery, but are not copy-edited or typeset. Technical support issues arising from supporting information (other than missing files) should be addressed to the authors
References
- Anderson EA, Hoffman RP, Balon TW, Sinkey CA, Mark AL. Hyperinsulinemia produces both sympathetic neural activation and vasodilation in normal humans. J Clin Invest. 1991;87:2246–2252. doi: 10.1172/JCI115260. [DOI] [PMC free article] [PubMed] [Google Scholar]
- Azar AS, Brooks VL. Impaired baroreflex gain during pregnancy in conscious rats: role of brain insulin. Hypertension. 2011;57:283–288. doi: 10.1161/HYPERTENSIONAHA.110.162354. [DOI] [PMC free article] [PubMed] [Google Scholar]
- Banks WA. The source of cerebral insulin. Eur J Pharmacol. 2004;490:5–12. doi: 10.1016/j.ejphar.2004.02.040. [DOI] [PubMed] [Google Scholar]
- Bardgett ME, McCarthy JJ, Stocker SD. Glutamatergic receptor activation in the rostral ventrolateral medulla mediates the sympathoexcitatory response to hyperinsulinemia. Hypertension. 2010;55:284–290. doi: 10.1161/HYPERTENSIONAHA.109.146605. [DOI] [PMC free article] [PubMed] [Google Scholar]
- Brooks VL, Dampney RA, Heesch CM. Pregnancy and the endocrine regulation of the baroreceptor reflex. Am J Physiol Regul Integr Comp Physiol. 2010a;299:R439–R451. doi: 10.1152/ajpregu.00059.2010. [DOI] [PMC free article] [PubMed] [Google Scholar]
- Brooks VL, Mulvaney JM, Azar AS, Zhao D, Goldman RK. Pregnancy impairs baroreflex control of heart rate in rats: role of insulin sensitivity. Am J Physiol Regul Integr Comp Physiol. 2010b;298:R419–R426. doi: 10.1152/ajpregu.00441.2009. [DOI] [PMC free article] [PubMed] [Google Scholar]
- Bunag RD, Eriksson L, Krizsan D. Baroreceptor reflex impairment and mild hypertension in rats with dietary-induced obesity. Hypertension. 1990;15:397–406. doi: 10.1161/01.hyp.15.4.397. [DOI] [PubMed] [Google Scholar]
- Carrasco M, Portillo F, Larsen PJ, Vallo JJ. Insulin and glucose administration stimulates Fos expression in neurones of the paraventricular nucleus that project to autonomic preganglionic structures. J Neuroendocrinol. 2001;13:339–346. doi: 10.1046/j.1365-2826.2001.00631.x. [DOI] [PubMed] [Google Scholar]
- Chen YL, Chan SH, Chan JY. Participation of galanin in baroreflex inhibition of heart rate by hypothalamic PVN in rat. Am J Physiol Heart Circ Physiol. 1996;271:H1823–H1828. doi: 10.1152/ajpheart.1996.271.5.H1823. [DOI] [PubMed] [Google Scholar]
- Daubert DL, Chung MY, Brooks VL. Insulin resistance and impaired baroreflex gain during pregnancy. Am J Physiol Regul Integr Comp Physiol. 2007;292:R2188–R2195. doi: 10.1152/ajpregu.00614.2006. [DOI] [PubMed] [Google Scholar]
- Davidowa H, Ziska T, Plagemann A. GABA receptor antagonists prevent abnormalities in leptin, insulin and amylin actions on paraventricular hypothalamic neurons of overweight rats. Eur J Neurosci. 2006;23:1248–1254. doi: 10.1111/j.1460-9568.2006.04636.x. [DOI] [PubMed] [Google Scholar]
- Decavel C, Van Den Pol AN. GABA: a dominant neurotransmitter in the hypothalamus. J Comp Neurol. 1990;302:1019–1037. doi: 10.1002/cne.903020423. [DOI] [PubMed] [Google Scholar]
- Emdin M, Gastaldelli A, Muscelli E, Macerata A, Natali A, Camastra S, Ferrannini E. Hyperinsulinemia and autonomic nervous system dysfunction in obesity: effects of weight loss. Circulation. 2001;103:513–519. doi: 10.1161/01.cir.103.4.513. [DOI] [PubMed] [Google Scholar]
- Figlewicz DP, Evans SB, Murphy J, Hoen M, Baskin DG. Expression of receptors for insulin and leptin in the ventral tegmental area/substantia nigra (VTA/SN) of the rat. Brain Research. 2003;964:107–115. doi: 10.1016/s0006-8993(02)04087-8. [DOI] [PubMed] [Google Scholar]
- Geerling JC, Shin JW, Chimenti PC, Loewy AD. Paraventricular hypothalamic nucleus: axonal projections to the brainstem. J Comp Neurol. 2010;518:1460–1499. doi: 10.1002/cne.22283. [DOI] [PMC free article] [PubMed] [Google Scholar]
- Grassi G, Seravalle G, Colombo M, Bolla G, Cattaneo BM, Cavagnini F, Mancia G. Body weight reduction, sympathetic nerve traffic, and arterial baroreflex in obese normotensive humans. Circulation. 1998;97:2037–2042. doi: 10.1161/01.cir.97.20.2037. [DOI] [PubMed] [Google Scholar]
- Hill JM, Lesniak MA, Pert CB, Roth J. Autoradiographic localization of insulin receptors in rat brain: prominence in olfactory and limbic areas. Neuroscience. 1986;17:1127–1138. doi: 10.1016/0306-4522(86)90082-5. [DOI] [PubMed] [Google Scholar]
- Hwang KR, Chan SH, Chan JY. Noradrenergic neurotransmission at PVN in locus ceruleus-induced baroreflex suppression in rats. Am J Physiol Heart Circ Physiol. 1998;274:H1284–H1292. doi: 10.1152/ajpheart.1998.274.4.H1284. [DOI] [PubMed] [Google Scholar]
- Kaiyala KJ, Prigeon RL, Kahn SE, Woods SC, Schwartz MW. Obesity induced by a high-fat diet is associated with reduced brain insulin transport in dogs. Diabetes. 2000;49:1525–1533. doi: 10.2337/diabetes.49.9.1525. [DOI] [PubMed] [Google Scholar]
- Kenney MJ, Weiss ML, Haywood JR. The paraventricular nucleus: an important component of the central neurocircuitry regulating sympathetic nerve outflow. Acta Physiol Scand. 2003;177:7–15. doi: 10.1046/j.1365-201X.2003.01042.x. [DOI] [PubMed] [Google Scholar]
- Kotanidou A, Choi AM, Winchurch RA, Otterbein L, Fessler HE. Urethan anesthesia protects rats against lethal endotoxemia and reduces TNF-α release. J Appl Physiol. 1996;81:2305–2311. [PubMed] [Google Scholar]
- Li DP, Chen SR, Pan HL. Nitric oxide inhibits spinally projecting paraventricular neurons through potentiation of presynaptic GABA release. J Neurophysiol. 2002;88:2664–2674. doi: 10.1152/jn.00540.2002. [DOI] [PubMed] [Google Scholar]
- Li DP, Pan HL. Angiotensin II attenuates synaptic GABA release and excites paraventricular-rostral ventrolateral medulla output neurons. J Pharmacol Exp Ther. 2005;313:1035–1045. doi: 10.1124/jpet.104.082495. [DOI] [PubMed] [Google Scholar]
- Marks JL, Porte D, Jr, Stahl WL, Baskin DG. Localization of insulin receptor mRNA in rat brain by in situ hybridization. Endocrinology. 1990;127:3234–3236. doi: 10.1210/endo-127-6-3234. [DOI] [PubMed] [Google Scholar]
- Marsh AJ, Fontes MA, Killinger S, Pawlak DB, Polson JW, Dampney RA. Cardiovascular responses evoked by leptin acting on neurons in the ventromedial and dorsomedial hypothalamus. Hypertension. 2003;42:488–493. doi: 10.1161/01.HYP.0000090097.22678.0A. [DOI] [PubMed] [Google Scholar]
- Matsumura K, Tsuchihashi T, Abe I. Central cardiovascular action of neuropeptide Y in conscious rabbits. Hypertension. 2000;36:1040–1044. doi: 10.1161/01.hyp.36.6.1040. [DOI] [PubMed] [Google Scholar]
- McKernan AM, Calaresu FR. Insulin microinjection into the nucleus tractus solitarii of the rat attenuates the baroreceptor reflex. J Auton Nerv Syst. 1996;61:128–138. doi: 10.1016/s0165-1838(96)00074-4. [DOI] [PubMed] [Google Scholar]
- Mitchell JL, Silverman MB, Aicher SA. Rat trigeminal lamina I neurons that project to thalamic or parabrachial nuclei contain the mu-opioid receptor. Neuroscience. 2004;128:571–582. doi: 10.1016/j.neuroscience.2004.07.026. [DOI] [PubMed] [Google Scholar]
- Montanaro MS, Allen AM, Oldfield BJ. Structural and functional evidence supporting a role for leptin in central neural pathways influencing blood pressure in rats. Exp Physiol. 2005;90:689–696. doi: 10.1113/expphysiol.2005.030775. [DOI] [PubMed] [Google Scholar]
- Morgan DA, Balon TW, Ginsberg BH, Mark AL. Nonuniform regional sympathetic nerve responses to hyperinsulinemia in rats. Am J Physiol Regul Integr Comp Physiol. 1993;264:R423–R427. doi: 10.1152/ajpregu.1993.264.2.R423. [DOI] [PubMed] [Google Scholar]
- Muntzel MS, Morgan DA, Mark AL, Johnson AK. Intracerebroventricular insulin produces nonuniform regional increases in sympathetic nerve activity. Am J Physiol Regul Integr Comp Physiol. 1994;267:R1350–R1355. doi: 10.1152/ajpregu.1994.267.5.R1350. [DOI] [PubMed] [Google Scholar]
- Nakamura T, Bhatt S, Sapru HN. Cardiovascular responses to hypothalamic arcuate nucleus stimulation in the rat: role of sympathetic and vagal efferents. Hypertension. 2009;54:1369–1375. doi: 10.1161/HYPERTENSIONAHA.109.140715. [DOI] [PubMed] [Google Scholar]
- Niswender KD, Baskin DG, Schwartz MW. Insulin and its evolving partnership with leptin in the hypothalamic control of energy homeostasis. Trends Endocrinol Metab. 2004;15:362–369. doi: 10.1016/j.tem.2004.07.009. [DOI] [PubMed] [Google Scholar]
- Okada M, Bunag RD. Insulin acts centrally to enhance reflex tachycardia in conscious rats. Am J Physiol Regul Integr Comp Physiol. 1994;266:R481–R486. doi: 10.1152/ajpregu.1994.266.2.R481. [DOI] [PubMed] [Google Scholar]
- Paxinos G, Watson C. The rat brain in stereotaxic coordinates. 4th edition. London: Elsevier/Academic Press; 1998. [Google Scholar]
- Plum L, Schubert M, Bruning JC. The role of insulin receptor signaling in the brain. Trends Endocrinol Metab. 2005;16:59–65. doi: 10.1016/j.tem.2005.01.008. [DOI] [PubMed] [Google Scholar]
- Porter JP. Effect of intrahypothalamic insulin on sympathetic nervous function in rats drinking a high-sucrose solution. Am J Physiol Regul Integr Comp Physiol. 1994;266:R1463–R1469. doi: 10.1152/ajpregu.1994.266.5.R1463. [DOI] [PubMed] [Google Scholar]
- Pricher MP, Freeman KL, Brooks VL. Insulin in the brain increases gain of baroreflex control of heart rate and lumbar sympathetic nerve activity. Hypertension. 2008;51:514–520. doi: 10.1161/HYPERTENSIONAHA.107.102608. [DOI] [PubMed] [Google Scholar]
- Prodi E, Obici S. Minireview: the brain as a molecular target for diabetic therapy. Endocrinology. 2006;147:2664–2669. doi: 10.1210/en.2006-0143. [DOI] [PubMed] [Google Scholar]
- Rahmouni K, Morgan DA. Hypothalamic arcuate nucleus mediates the sympathetic and arterial pressure responses to leptin. Hypertension. 2007;49:647–652. doi: 10.1161/01.HYP.0000254827.59792.b2. [DOI] [PubMed] [Google Scholar]
- Rahmouni K, Morgan DA, Morgan GM, Liu X, Sigmund CD, Mark AL, Haynes WG. Hypothalamic PI3K and MAPK differentially mediate regional sympathetic activation to insulin. J Clin Invest. 2004;114:652–658. doi: 10.1172/JCI21737. [DOI] [PMC free article] [PubMed] [Google Scholar]
- Roland BL, Sawchenko PE. Local origins of some GABAergic projections to the paraventricular and supraoptic nuclei of the hypothalamus in the rat. J Comp Neurol. 1993;332:123–143. doi: 10.1002/cne.903320109. [DOI] [PubMed] [Google Scholar]
- Rowe JW, Young JB, Minaker KL, Stevens AL, Pallotta J, Landsberg L. Effect of insulin and glucose infusions on sympathetic nervous system activity in normal man. Diabetes. 1981;30:219–225. doi: 10.2337/diab.30.3.219. [DOI] [PubMed] [Google Scholar]
- Ruggeri P, Molinari C, Brunori A, Cogo CE, Mary DA, Picchio V, Vacca G. The direct effect of insulin on barosensitive neurones in the nucleus tractus solitarii of rats. Neuroreport. 2001;12:3719–3722. doi: 10.1097/00001756-200112040-00023. [DOI] [PubMed] [Google Scholar]
- Sakaguchi T, Bray GA. Sympathetic activity following paraventricular injections of glucose and insulin. Brain Res Bull. 1988;21:25–29. doi: 10.1016/0361-9230(88)90115-3. [DOI] [PubMed] [Google Scholar]
- Sakaguchi T, Takahashi M, Bray GA. Diurnal changes in sympathetic activity. Relation to food intake and to insulin injected into the ventromedial or suprachiasmatic nucleus. J Clin Invest. 1988;82:282–286. doi: 10.1172/JCI113584. [DOI] [PMC free article] [PubMed] [Google Scholar]
- Schulingkamp RJ, Pagano TC, Hung D, Raffa RB. Insulin receptors and insulin action in the brain: review and clinical implications. Neurosci Biobehav Rev. 2000;24:855–872. doi: 10.1016/s0149-7634(00)00040-3. [DOI] [PubMed] [Google Scholar]
- Schwartz MW, Figlewicz DF, Kahn SE, Baskin DG, Greenwood MR, Porte D., Jr Insulin binding to brain capillaries is reduced in genetically obese, hyperinsulinemic Zucker rats. Peptides. 1990;11:467–472. doi: 10.1016/0196-9781(90)90044-6. [DOI] [PubMed] [Google Scholar]
- Schwartz MW, Figlewicz DP, Baskin DG, Woods SC, Porte D., Jr Insulin in the brain: a hormonal regulator of energy balance. Endocr Rev. 1992;13:387–414. doi: 10.1210/edrv-13-3-387. [DOI] [PubMed] [Google Scholar]
- Silverman MB, Hermes SM, Zadina JE, Aicher SA. Mu-opioid receptor is present in dendritic targets of nndomorphin-2 axon terminals in the nuclei of the solitary tract. Neuroscience. 2005;135:887–896. doi: 10.1016/j.neuroscience.2005.06.072. [DOI] [PubMed] [Google Scholar]
- Sim LJ, Joseph SA. Arcuate nucleus projections to brainstem regions which modulate nociception. J Chem Neuroanat. 1991;4:97–109. doi: 10.1016/0891-0618(91)90034-a. [DOI] [PubMed] [Google Scholar]
- Spanswick D, Smith MA, Mirshamsi S, Routh VH, Ashford ML. Insulin activates ATP-sensitive K+ channels in hypothalamic neurons of lean, but not obese rats. Nat Neurosci. 2000;3:757–758. doi: 10.1038/77660. [DOI] [PubMed] [Google Scholar]
- Stocker SD, Cunningham JT, Toney GM. Water deprivation increases Fos immunoreactivity in PVN autonomic neurons with projections to the spinal cord and rostral ventrolateral medulla. Am J Physiol Regul Integr Comp Physiol. 2004;287:R1172–1183. doi: 10.1152/ajpregu.00394.2004. [DOI] [PubMed] [Google Scholar]
- Stocker SD, Simmons JR, Stornetta RL, Toney GM, Guyenet PG. Water deprivation activates a glutamatergic projection from the hypothalamic paraventricular nucleus to the rostral ventrolateral medulla. J Comp Neurol. 2006;494:673–685. doi: 10.1002/cne.20835. [DOI] [PMC free article] [PubMed] [Google Scholar]
- Sykova E, Nicholson C. Diffusion in brain extracellular space. Physiol Rev. 2008;88:1277–1340. doi: 10.1152/physrev.00027.2007. [DOI] [PMC free article] [PubMed] [Google Scholar]
- Unger J, McNeill TH, Moxley RT, III, White M, Moss A, Livingston JN. Distribution of insulin receptor-like immunoreactivity in the rat forebrain. Neuroscience. 1989;31:143–157. doi: 10.1016/0306-4522(89)90036-5. [DOI] [PubMed] [Google Scholar]
- Weiss ML, Kenney MJ, Musch TI, Patel KP. Modifications to central neural circuitry during heart failure. Acta Physiol Scand. 2003;177:57–67. doi: 10.1046/j.1365-201X.2003.01047.x. [DOI] [PubMed] [Google Scholar]
- Werther GA, Hogg A, Oldfield BJ, McKinley MJ, Figdor R, Allen AM, Mendelsohn FA. Localization and characterization of insulin receptors in rat brain and pituitary gland using in vitro autoradiography and computerized densitometry. Endocrinology. 1987;121:1562–1570. doi: 10.1210/endo-121-4-1562. [DOI] [PubMed] [Google Scholar]
- Williams KW, Margatho LO, Lee CE, Choi M, Lee S, Scott MM, Elias CF, Elmquist JK. Segregation of acute leptin and insulin effects in distinct populations of arcuate proopiomelanocortin neurons. J Neurosci. 2010;30:2472–2479. doi: 10.1523/JNEUROSCI.3118-09.2010. [DOI] [PMC free article] [PubMed] [Google Scholar]
- Young CN, Deo SH, Chaudhary K, Thyfault JP, Fadel PJ. Insulin enhances the gain of arterial baroreflex control of muscle sympathetic nerve activity in humans. J Physiol. 2010;588:3593–3603. doi: 10.1113/jphysiol.2010.191866. [DOI] [PMC free article] [PubMed] [Google Scholar]
- Zhao D, Brooks VL. Diet-induced obesity impairs baroreflex gain: role of brain insulin. Hypertension. 2010;56:e102. [Google Scholar]
Associated Data
This section collects any data citations, data availability statements, or supplementary materials included in this article.


